Gene elevating cereal yield and utilization thereof
- Summary
- Abstract
- Description
- Claims
- Application Information
AI Technical Summary
Benefits of technology
Problems solved by technology
Method used
Image
Examples
example 1
Selection of Test Materials and Production of a Semi-isogenic Line
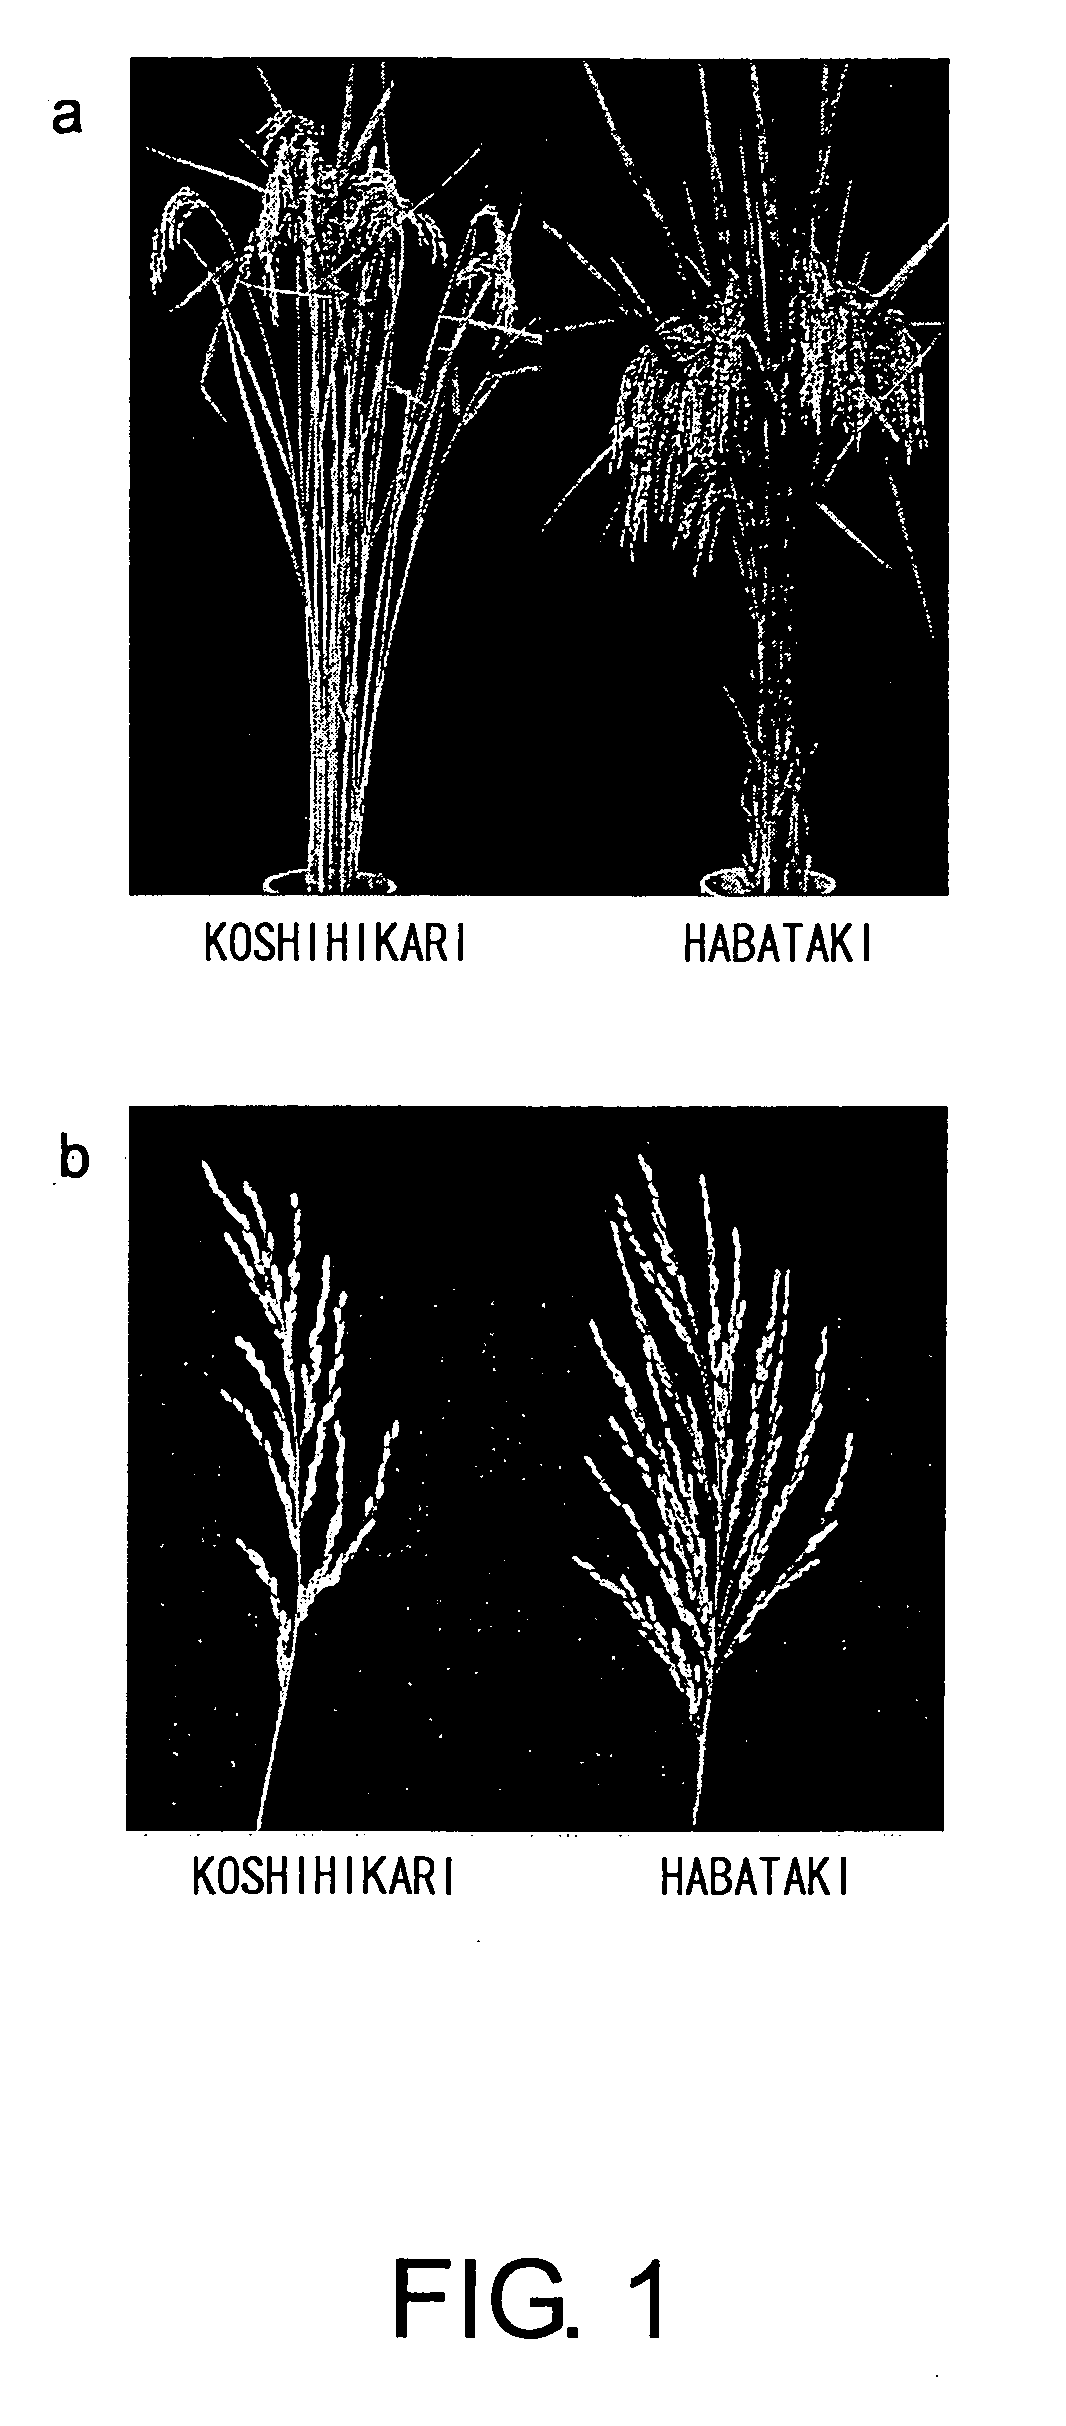
[0100] Initially, in order to generate a hybrid population for QTL analysis, varieties that would become the parents of the hybrids were selected. First, the average particle-bearing numbers in several varieties of japonica rice and several varieties of indica rice were investigated, and from these varieties, two varieties showing a clear difference in the particle-bearing number, “Koshihikari” which is a japonica rice, and “Habataki” which is an indica rice, were selected (FIG. 1). To F1 individuals produced by crossing japonica rice “Koshihikari” and indica rice “Habataki”, backcrossing using Koshihikari as the repeated parent and self-fertilization were carried out, and 74 varieties of BC2F1, BC2F2, and BC3F2 population were cultivated and developed on the Nagoya University Farm.
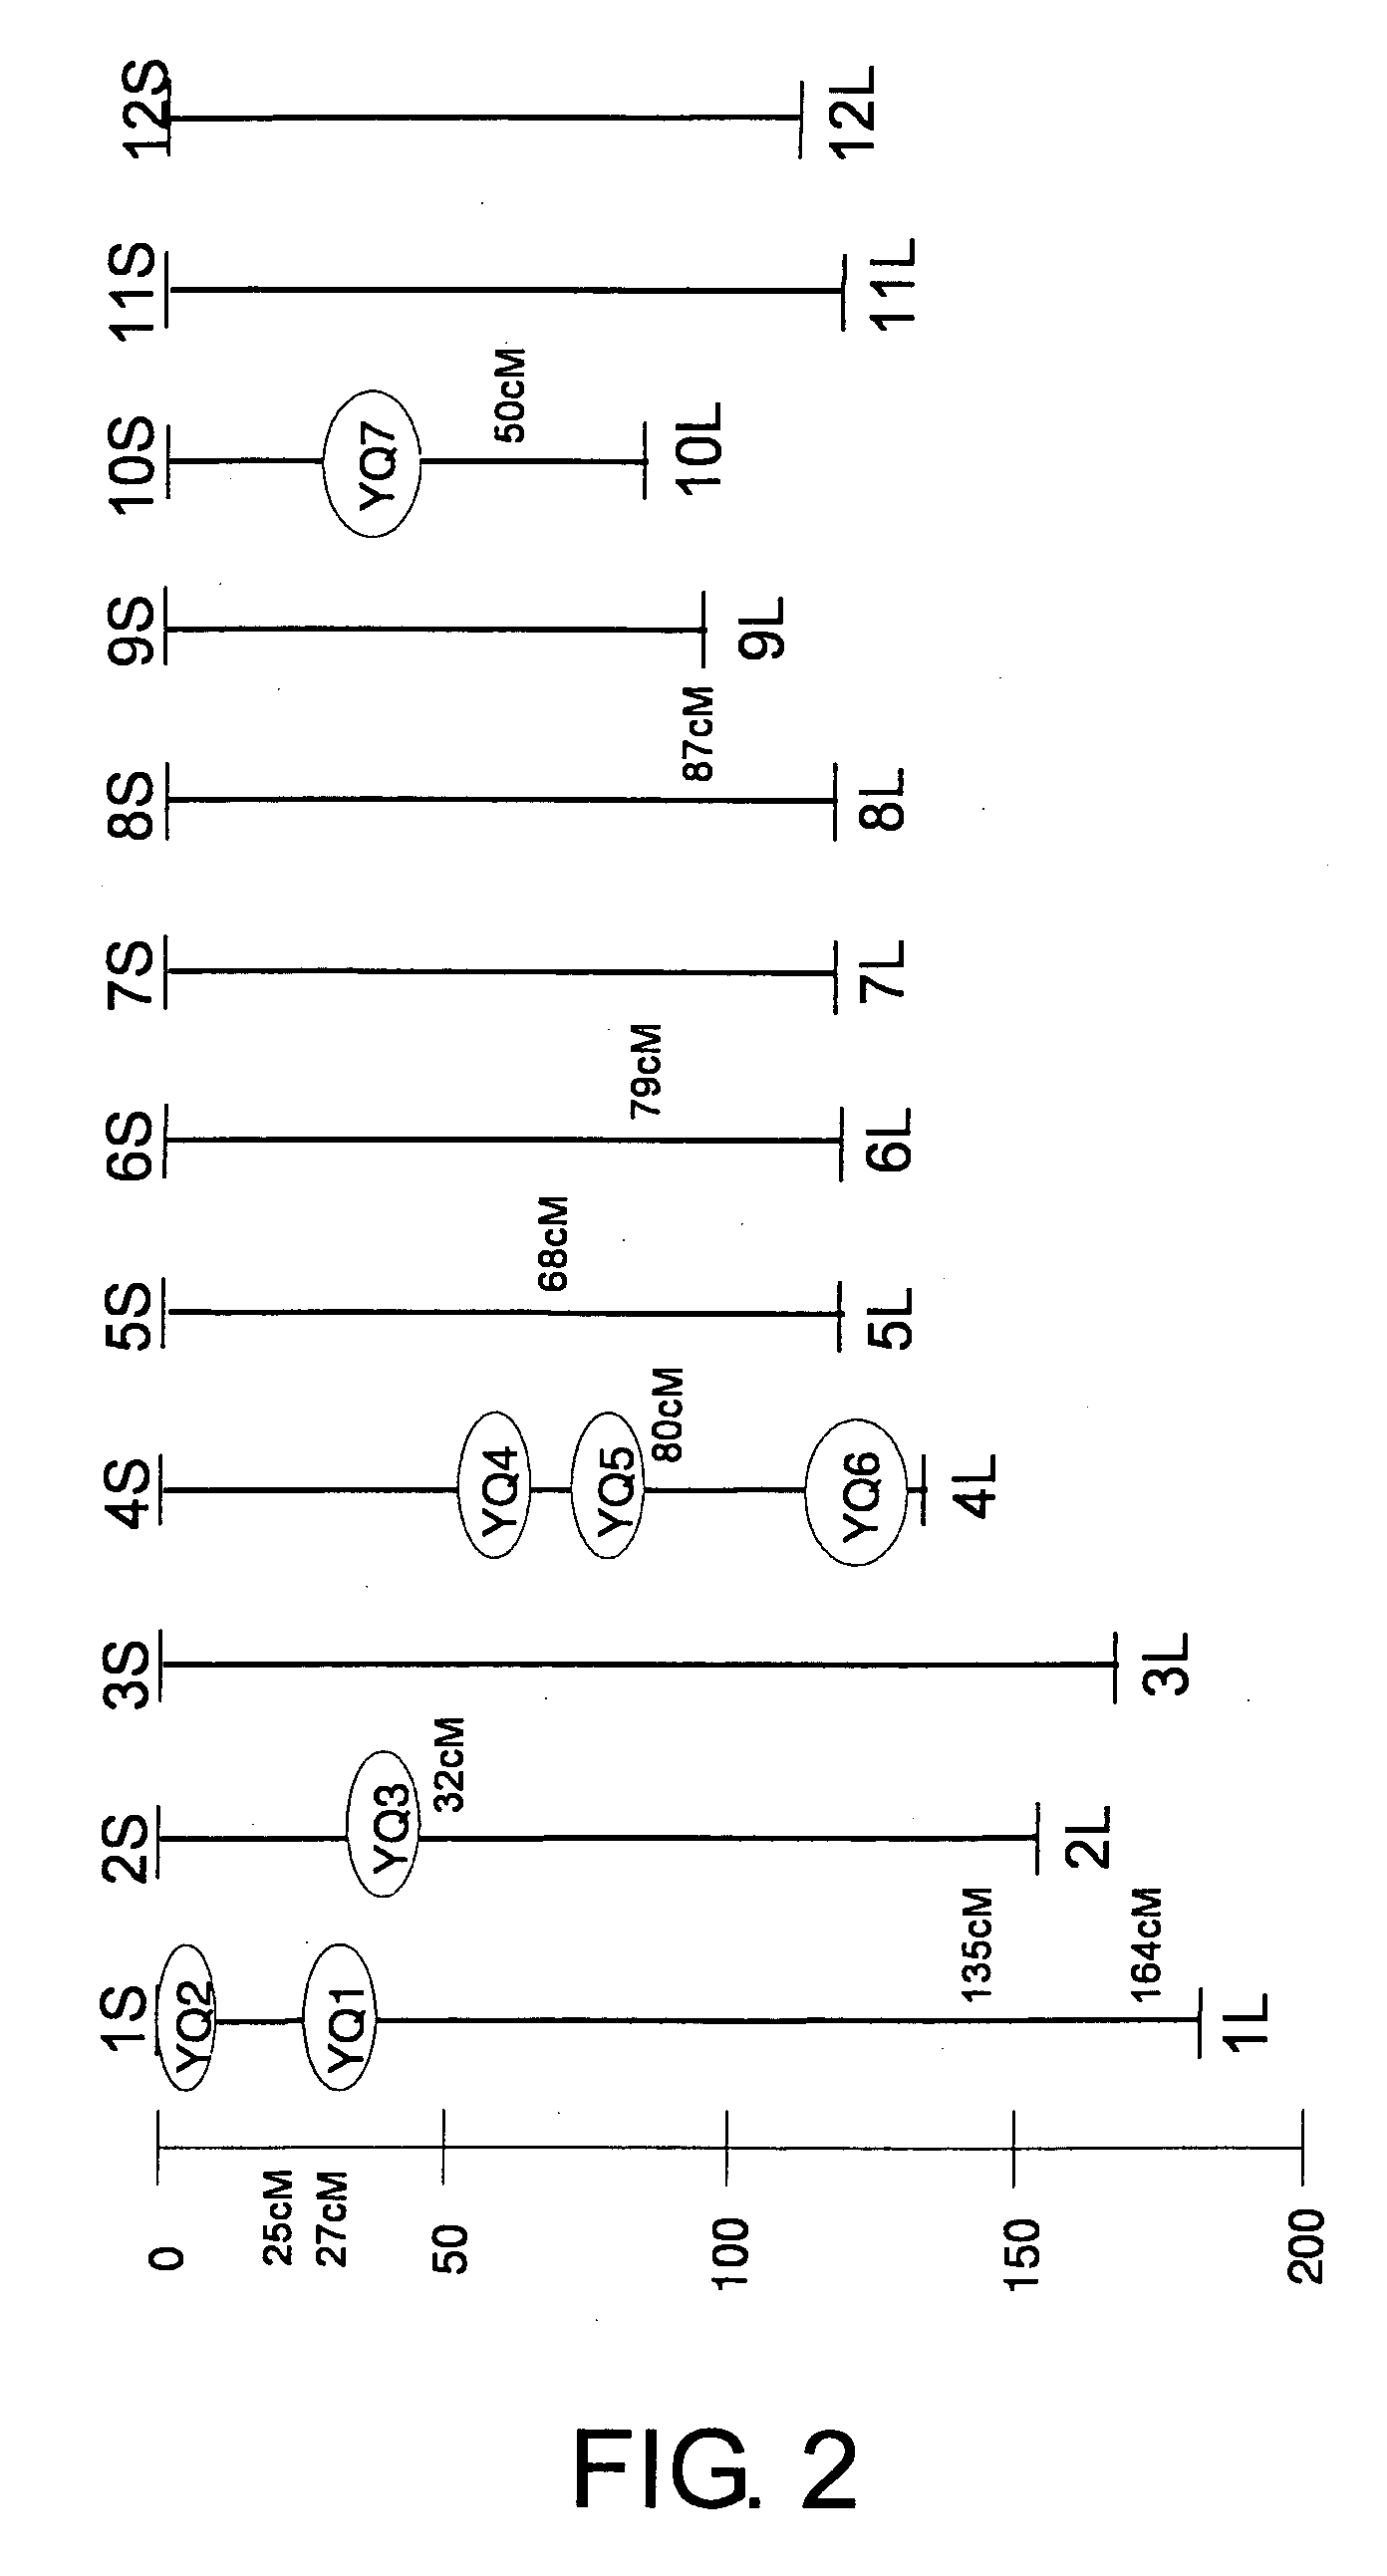
[0101] By performing a QTL analysis relating to the particle-bearing number using 74 BC2F2 plants, a plurality of QTL that increase the ...
example 2
[0102] From each of the 74 BC2F1 individuals, DNAs were extracted using the CTAB method, and the genotype of each individual was determined using 93 molecular markers that thoroughly cover all chromosomes. Their self-fertilized progeny, BC2F2, was developed at ten individuals per variety, and from among them, one individual per variety was randomly selected, and after sampling six panicles from each of the selected individuals, the particle-bearing number was investigated for each panicle. Among the six panicles of each variety, the panicle having the largest particle-bearing number was selected, and this number was used as the maximum particle-bearing number. QTL analysis was performed using the Qgene software.
example 3
High Resolution Linkage Analysis Using a Segregating Population of YQ
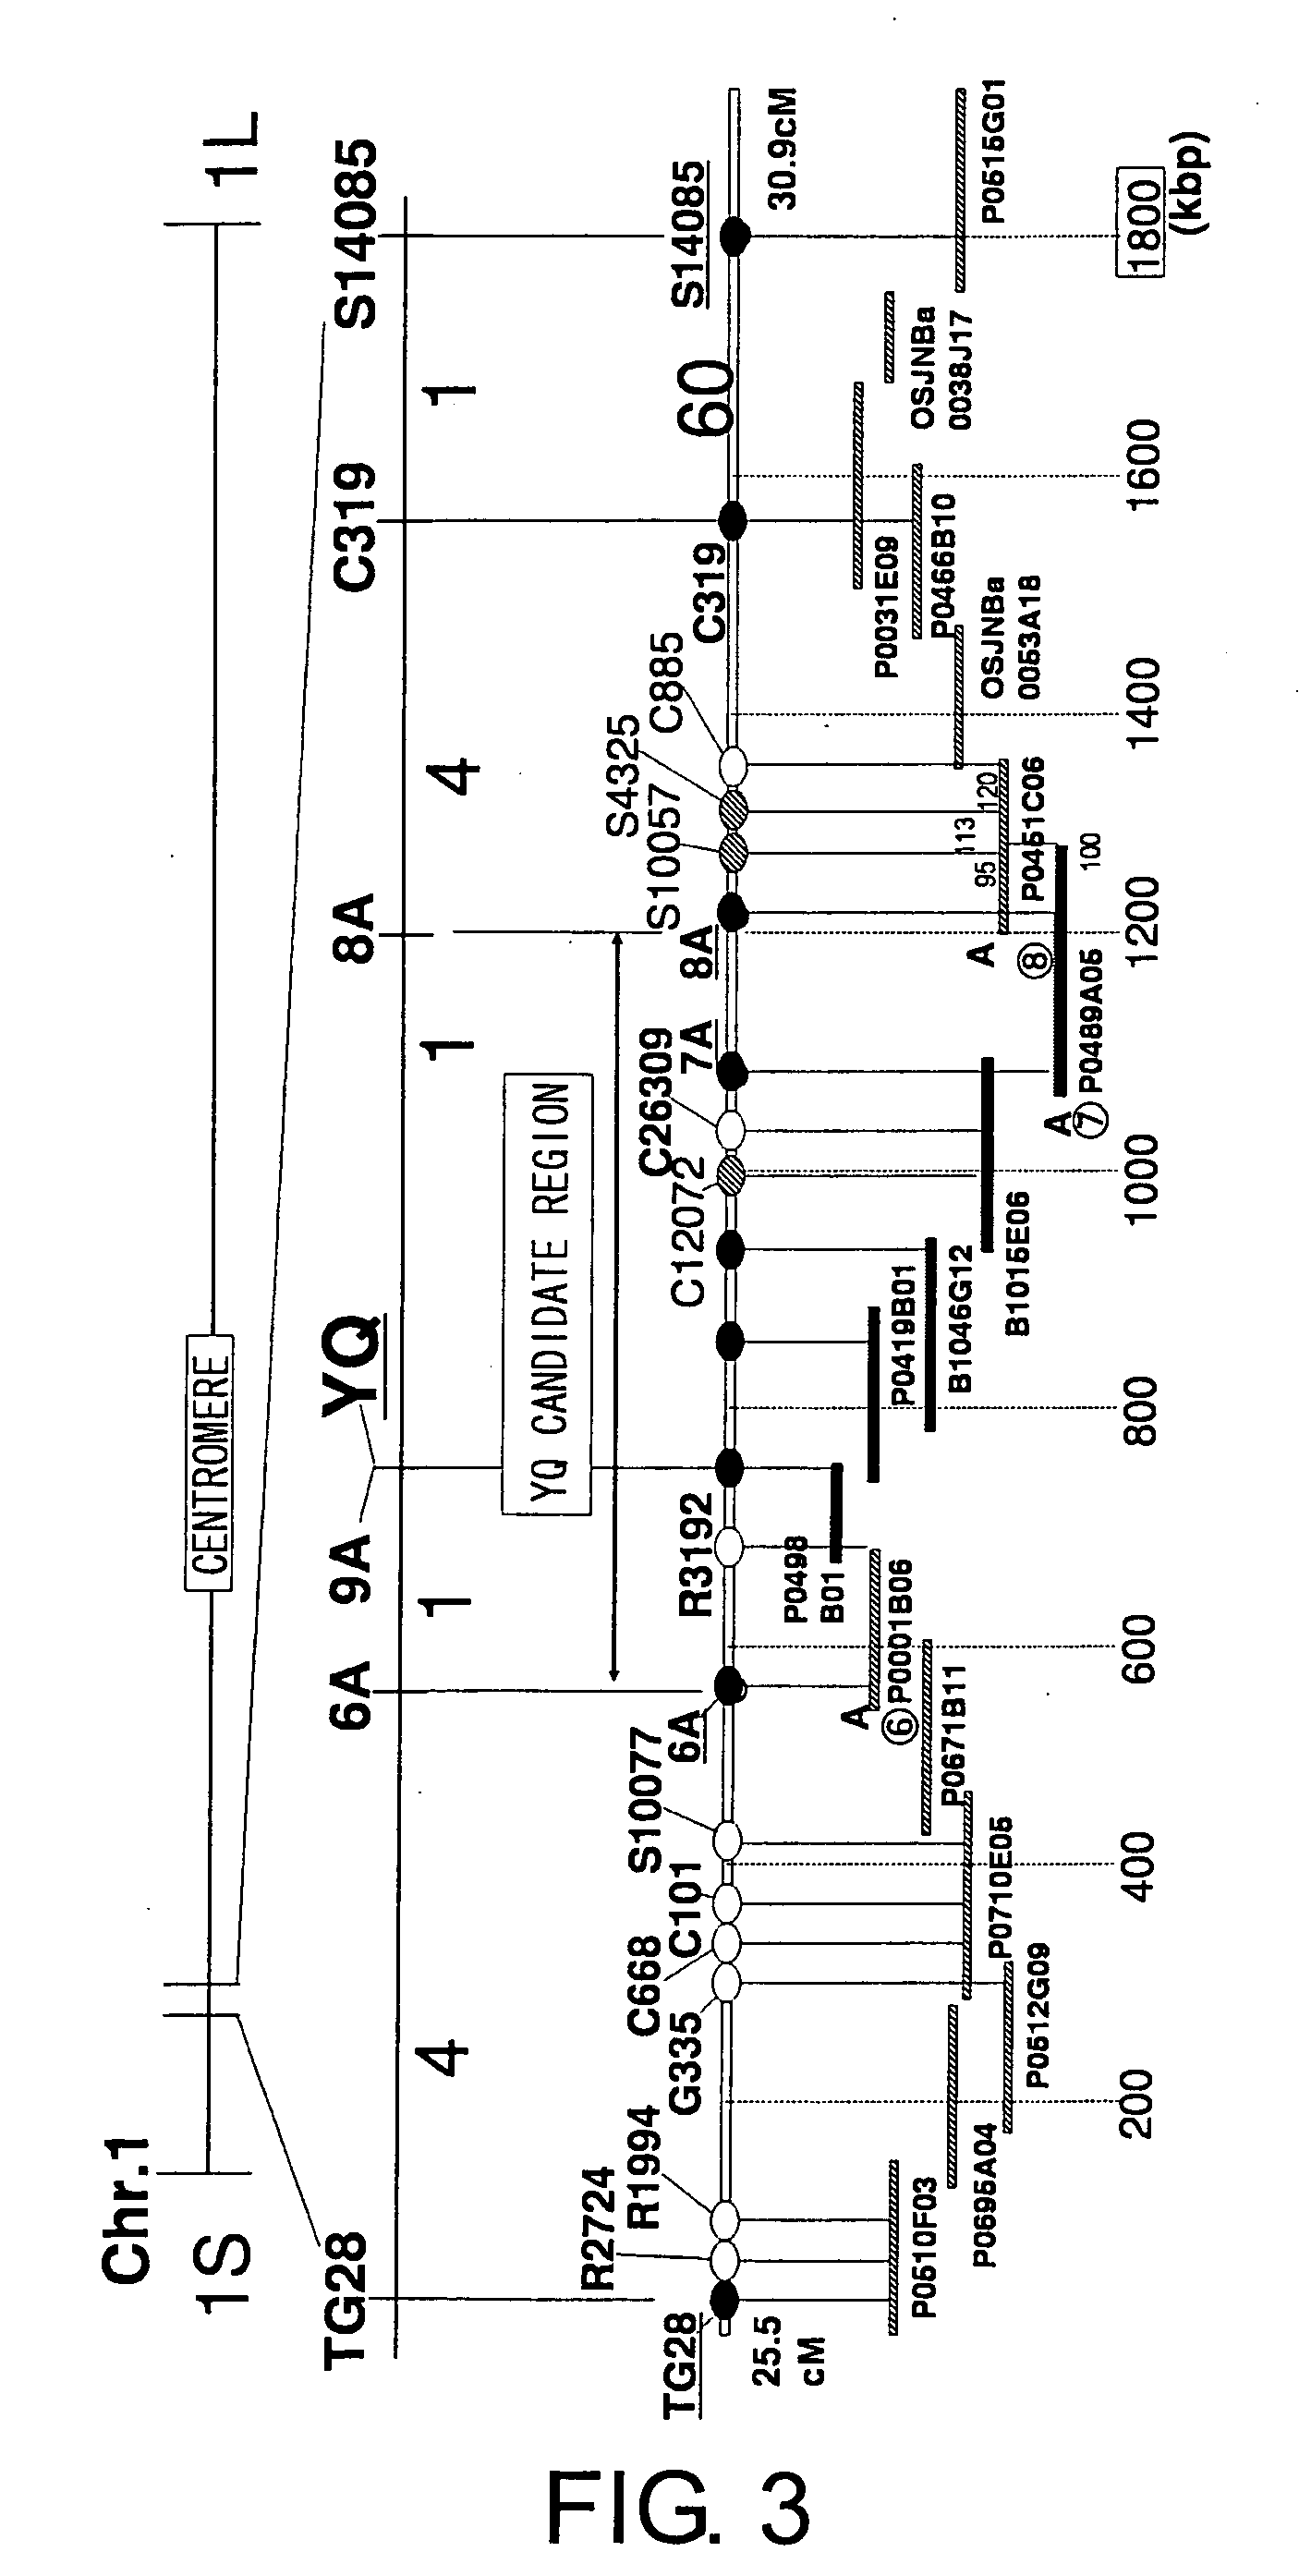
[0103] The BC3F2 population was used to investigate the phenotype and genotype (F2 and F3) using molecular markers, and linkage analysis was performed again. The results showed that YQ1 is located at the region between molecular markers 6A and 8A (FIG. 3). As a result of performing high-resolution linkage analysis using a segregating population (12500 individuals) of YQ to specify the region of the YQ1 locus, YQ1 was specified to be a region of approximately 8 Kb positioned between molecular markers 4A9 and 20 (FIG. 4). When gene prediction was performed in this region, a single gene was predicted, and as a result of a homology search, a gene that is highly homologous to CKX (cytokinin oxidase) was found (FIG. 4). When the nucleotide sequence of this CKX gene was determined for Habataki and Koshihikari, differences in the nucleotides were found, and the CKX of Habataki seemed to have lost its function (FIG. 5).
PUM
| Property | Measurement | Unit |
|---|---|---|
| Time | aaaaa | aaaaa |
Abstract
Description
Claims
Application Information
 - R&D
- Intellectual Property
- Life Sciences
- Materials
- Tech Scout
- Unparalleled Data Quality
- Higher Quality Content
- 60% Fewer Hallucinations
Browse by: Latest US Patents, China's latest patents, Technical Efficacy Thesaurus, Application Domain, Technology Topic, Popular Technical Reports.
© 2025 PatSnap. All rights reserved.Legal|Privacy policy|Modern Slavery Act Transparency Statement|Sitemap|About US| Contact US: help@patsnap.com


