Method and system for robust classification strategy for cancer detection from mass spectrometry data

a mass spectrometry and classification strategy technology, applied in the field of data classification strategies, can solve the problems of incoherence between predictions provided by different techniques, large data size, limitations of conventional techniques, etc., and achieve the effect of reducing noise sensitivity, optimal prediction, and reducing noise sensitivity

Inactive Publication Date: 2008-01-31
IBM CORP
View PDF5 Cites 57 Cited by
  • Summary
  • Abstract
  • Description
  • Claims
  • Application Information

AI Technical Summary

Benefits of technology

[0009]The present invention provides a robust, error optimum method to distinguish prostate cancer cases from non-cancer cases using only the location and the amplitude of peaks in mass spectrometry data. The method of the present invention identifies biomarkers that are robust against experimental noise, sample composition, and classification method used. The method uses patterns as synthetic variables, which add structural information to the data, reduce sensitivity to noise and identify combinatorial biomarkers. The meta-classifier of the present invention incorporates averaging to achieve optimal prediction by using orthogonal components.
[0010]In accordance with certain aspects of the present invention, a method for phenotype identification involves a stringent noise analysis and filtering procedure followed by combining the results of several machine learning tools trained on pattern data to produce a robust predictor. The method iden

Problems solved by technology

However, these conventional techniques have limitations, due to the current status of the instruments used to obtain the data, due to a lack of robustness of the selected biomarkers or of the predictive models, due to poor validation and due to a lack of protein biomarker and pathway identification.
Other difficulties with mass spectrometry data include the larg

Method used


Image

  • Method and system for robust classification strategy for cancer detection from mass spectrometry data
  • Method and system for robust classification strategy for cancer detection from mass spectrometry data
  • Method and system for robust classification strategy for cancer detection from mass spectrometry data

Examples


example

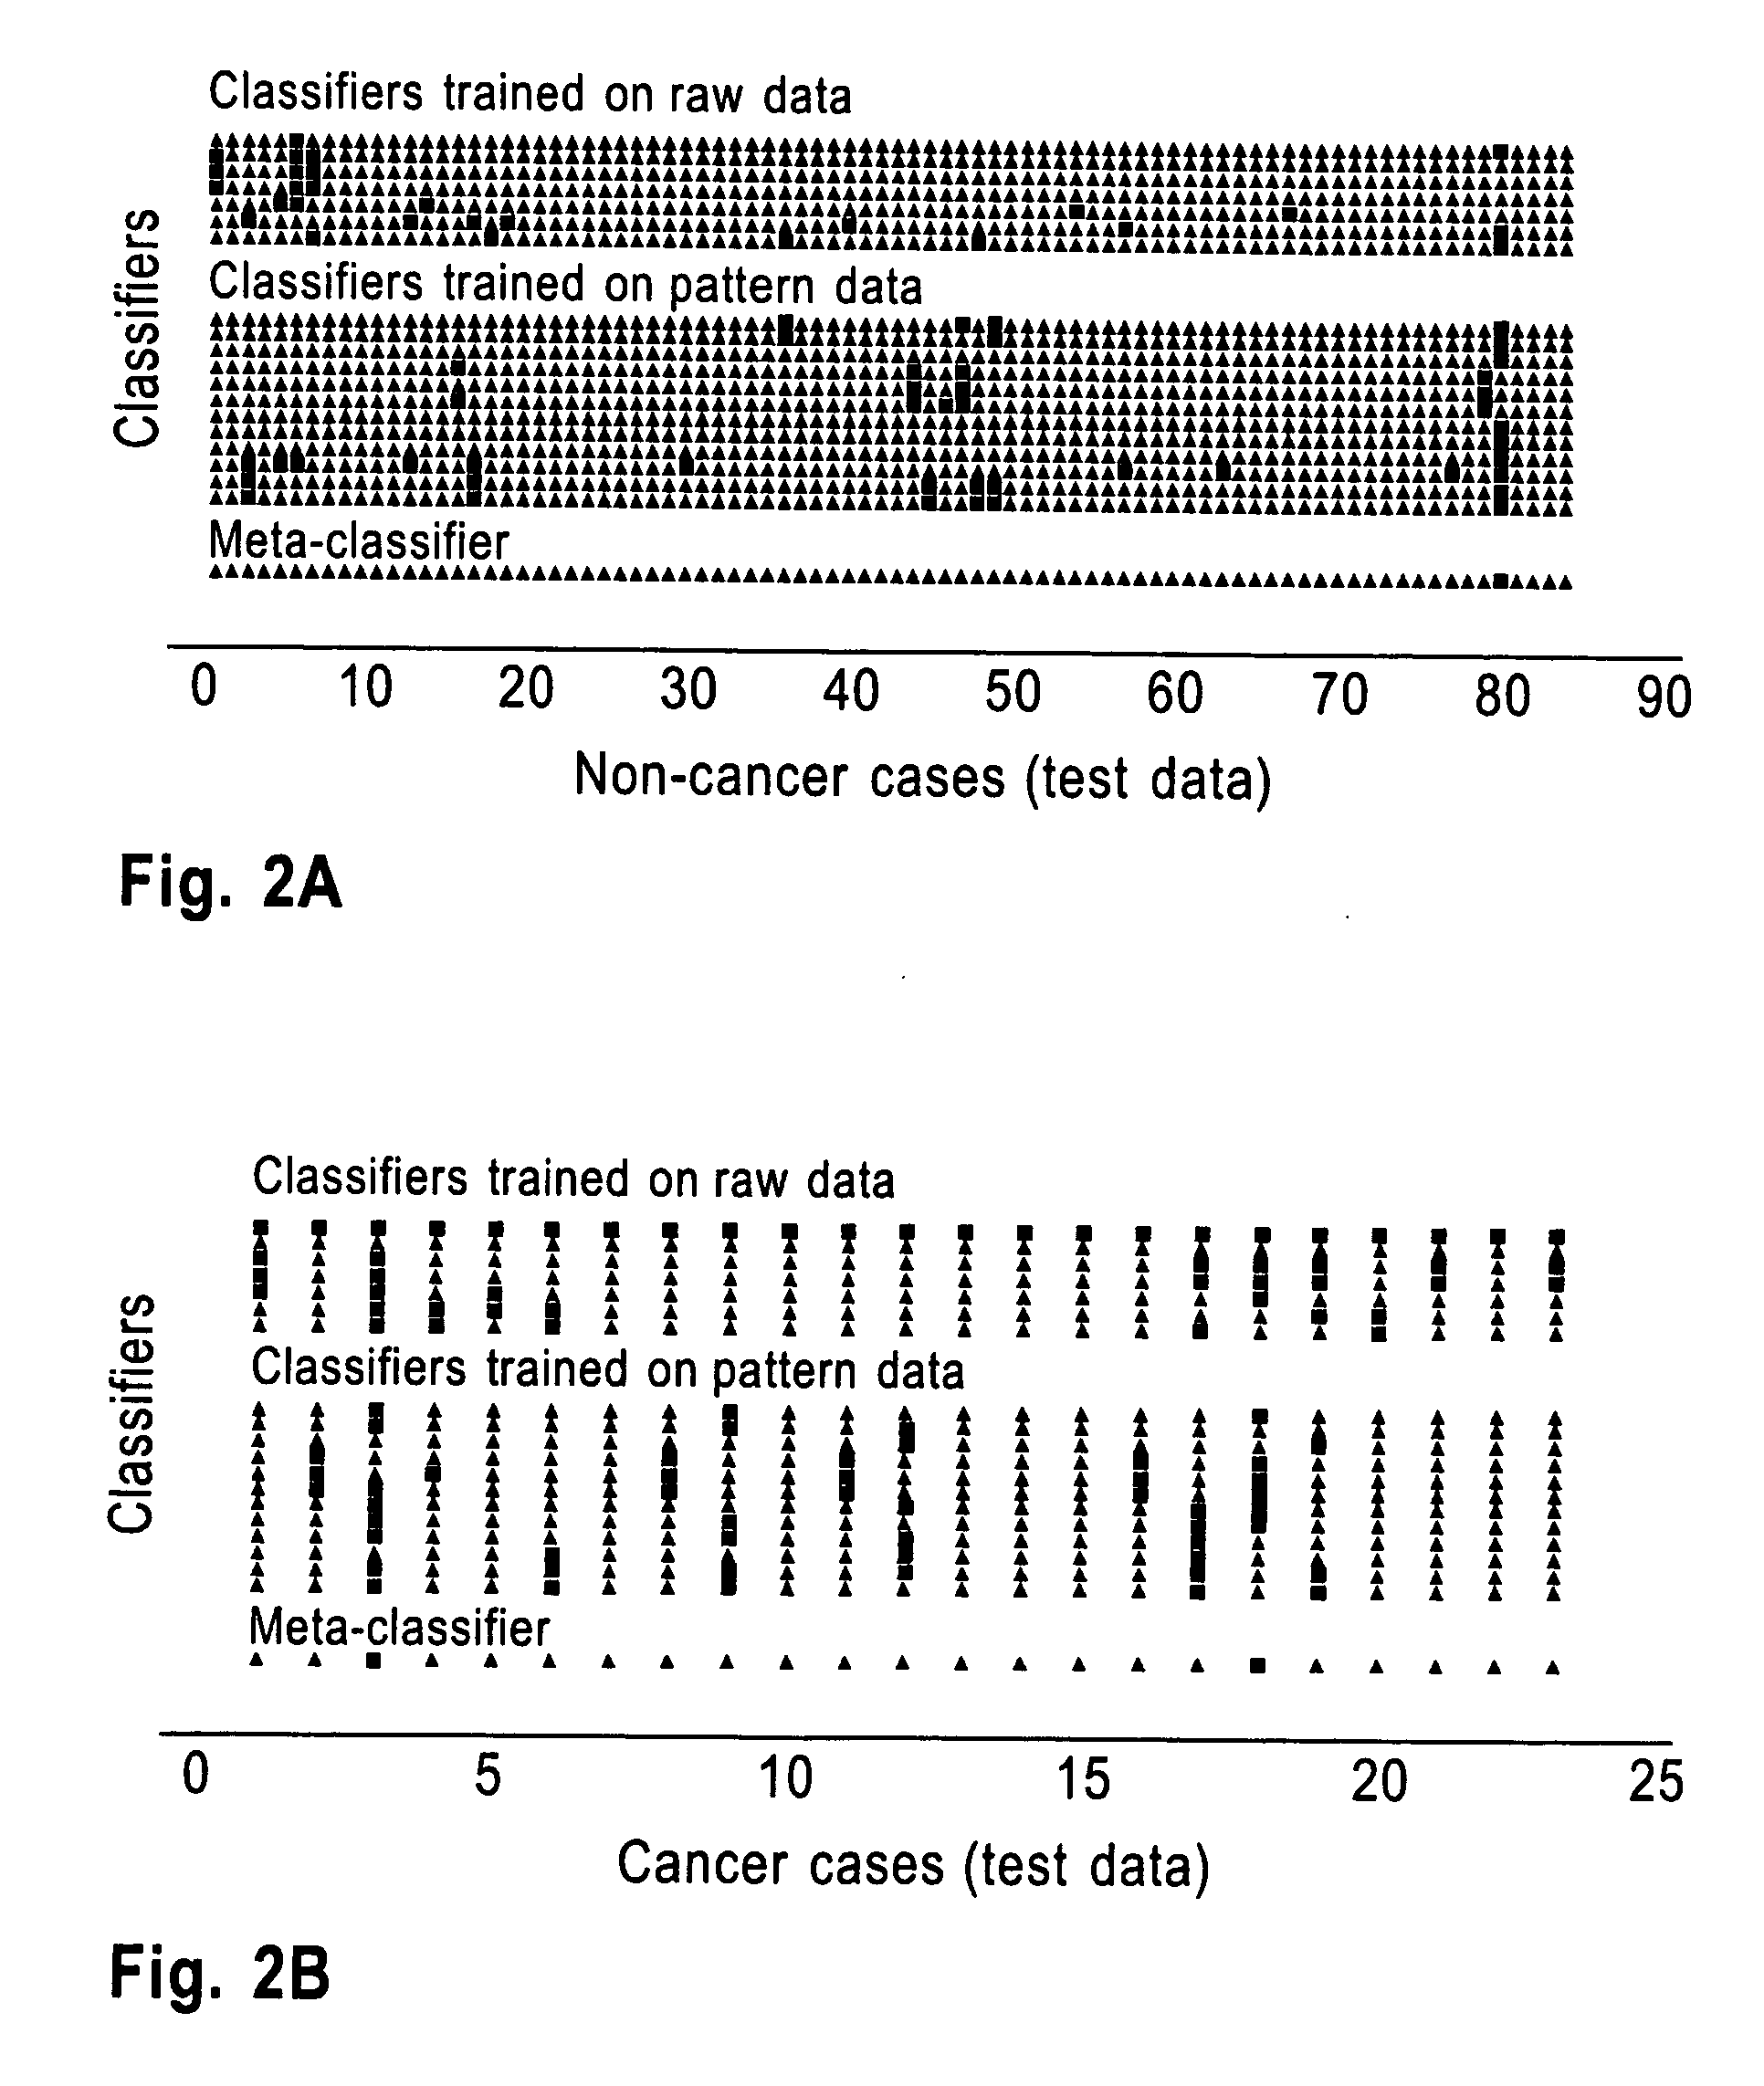
[0061]A subset of 215 cases (169 non-cancer and 46 cancer patients) was selected for training data; the remaining 107 cases (84 non-cancer and 23 cancer patients) defined the test data. It was found that each spectrum had an average of 6790 peaks (95% CI 6750-6820). The union of the peaks in the 215 spectra in the training set covered all the 15,154 m / z values in the data. Some of the peaks (e.g., m / z=1966, m / z=2729, m / z=4052) occurred in all the 215 samples in the training data, while about 2000 peaks occurred in less than 10% of the samples.

[0062]Next, 100 datasets were generated as perturbations of the training data with experimental noise normally distributed as N(0, 1.75). 1289 peaks had p <0.05 for each of the tests (two-tailed t-test, signal-to-noise (s2n), Pearson correlation, two-tailed F-test) in each of the perturbed datasets and the smoothed training dataset. q-values were computed by using the Q-Value library (http: / / www.Bioconductor.org) for the corresponding lists of ...


PUM


Abstract

A robust classification method for cancer detection from mass spectrometry data includes inputting the mass spectrometry data, preprocessing the spectrometry data, conducting robust feature selection, generating predictions for the test data sets using multiple data classifiers, the multiple data classifiers including artificial neural networks, support vector machines, weighted voting on data patterns, classification and regression trees, k-nearest neighbor classification, and logistic regression, and constructing and validating a meta-classifier by combining individual predictions of the multiple data classifiers to generate a robust prediction of a phenotype. The test data sets are used exclusively for validation of the meta-classifier.

Description

BACKGROUND OF THE INVENTION[0001]1. Field of the Invention[0002]The present invention relates to data classification strategies, and more particularly to a robust data classification strategy using machine learning tools on mass spectrometry data to create a robust phenotype identifier to detect cancer.[0003]2. Description of the Related Art[0004]The field of genomics and proteomics has grown rapidly. However, in spite of much effort there remains a need for robust, clinically useful predictors that might be adopted by the medical community.[0005]Conventional techniques have been developed to use biological data for phenotype identification from data and, more particularly, phenotype prediction for various types of cancer. However, these conventional techniques have limitations, due to the current status of the instruments used to obtain the data, due to a lack of robustness of the selected biomarkers or of the predictive models, due to poor validation and due to a lack of protein b...

Claims


Application Information

Patent Timeline
IPC IPC(8): G06K9/00G06K9/62
CPCG06K9/00536G06K9/6262G06K9/6253G06F2218/12G06F18/40G06F18/217
Inventor BHANOT, GYAN VATSARAJAALEXE, GABRIELELEVINE, ARNOLD J.VENKATARAGHAVAN, BABU
Owner IBM CORP
Why Eureka
Try Eureka