Systems and methods for predicting a livestock marketing method

a marketing method and livestock technology, applied in the field of livestock marketing methods, can solve the problems of reduced profits, higher meat grades, and no totally reliable way, and achieve the effects of optimizing the desired traits of the animal, optimizing the feeding regimen efficiencies, and efficiently managing the resources of the livestock producer

Inactive Publication Date: 2009-02-26
MERIAL LTD
View PDF6 Cites 3 Cited by
  • Summary
  • Abstract
  • Description
  • Claims
  • Application Information

AI Technical Summary

Benefits of technology

[0014]The present invention is directed to computer-assisted methods and systems for improving the efficiency of livestock production by using genetic information to predict the revenue outcome of possible marketing methods. Methods of the invention also encompasses obtaining a genetic sample from each animal in a herd of livestock, determining the genotype of each animal, grouping animals with like genotypes, and optionally, further sub-grouping animals based on like phenotypes. In particular, the present invention uses pairs of single nucleotide polymorphisms (SNPs) in the promoter region of the leptin ob gene and one SNP in exon 2 of the leptin gene that are strongly associated with several economically important traits in cattle.
[0018]In one embodiment of the present invention, the homozygosity or heterozygosity of each animal is determined with respect to alleles of one or more genes, most advantageously the leptin (ob) gene, encoding a trait-specific polypeptide or a control function, or other identifying nucleic acid sequences. Animals determined to be homozygous for a genetic marker associated with a particular trait, are grouped with other like-homozygous animals and are segregated from dissimilar animals. Each group may then be fed according to a regimen and for a period of time designed to optimize the desired traits in the animal while efficiently managing the resources of the livestock producer.
[0019]An advantageous aspect of the present invention is directed to a computer system and computer-assisted method for predicting quality traits for livestock possessing specific genetic predispositions. In this method, an animal is genotyped, advantageously based on SNPs of the ob gene and in particular the UASMS2 and EXON2-FB SNPs, and most advantageously of the UASMS2-EXON2-FB pair of SNPS. The animal may then be segregated with like-genotype animals, and bred or fed according to regimens specific to optimize the traits or characteristics. In another embodiment, a farmer can maximize feeding regimen efficiencies based on genetic predispositions. In a further embodiment, a meat packer or other commercial purchaser can base his purchase of livestock on the results of genotyping.
[0020]The present invention further provides computer-assisted methods for genotyping animals, collecting and storing the data resulting from genotyping, classifying livestock based on the genetic data, and establishing feed and slaughter schedules for livestock possessing like genetic traits based upon the predictive models determining those marketing methods that provide the maximum revenue for each identified genotype. The methods of the present invention optimize the efficiencies of raising livestock because the producer or packer can predict optimum slaughter schedules for each animal, based on the animal's genetically determined predisposition to desired end-product characteristics.

Problems solved by technology

The feedlot operator's costs include operations costs for the lot, such as labor, health costs, transport, animal death, capital, maintenance, and the like, plus the cost of feeding the animals.
Thus, the price reductions for carcasses falling outside the desirable range fall directly to the feedlot operator's bottom line, resulting in reduced profits.
Because the residence time and the feed schedule are based on visual inspections, there is no totally reliable way to accurately predict which animals will result in higher grades of meat.
It is common that the post-slaughter inventory of a specific, desired grade of meat does not meet with a packer's pre-slaughter demand.
This results in an uncertain inventory, and often means that the packer must purchase additional animals to fill a desired inventory.
Incorrect marketing choices can lead to substantial losses in income.
Although there is an increasing need for producers to know the quality of their cattle prior to slaughter, they currently have little objective information on which to make these judgments.

Method used


Image

  • Systems and methods for predicting a livestock marketing method
  • Systems and methods for predicting a livestock marketing method
  • Systems and methods for predicting a livestock marketing method

Examples


example 1

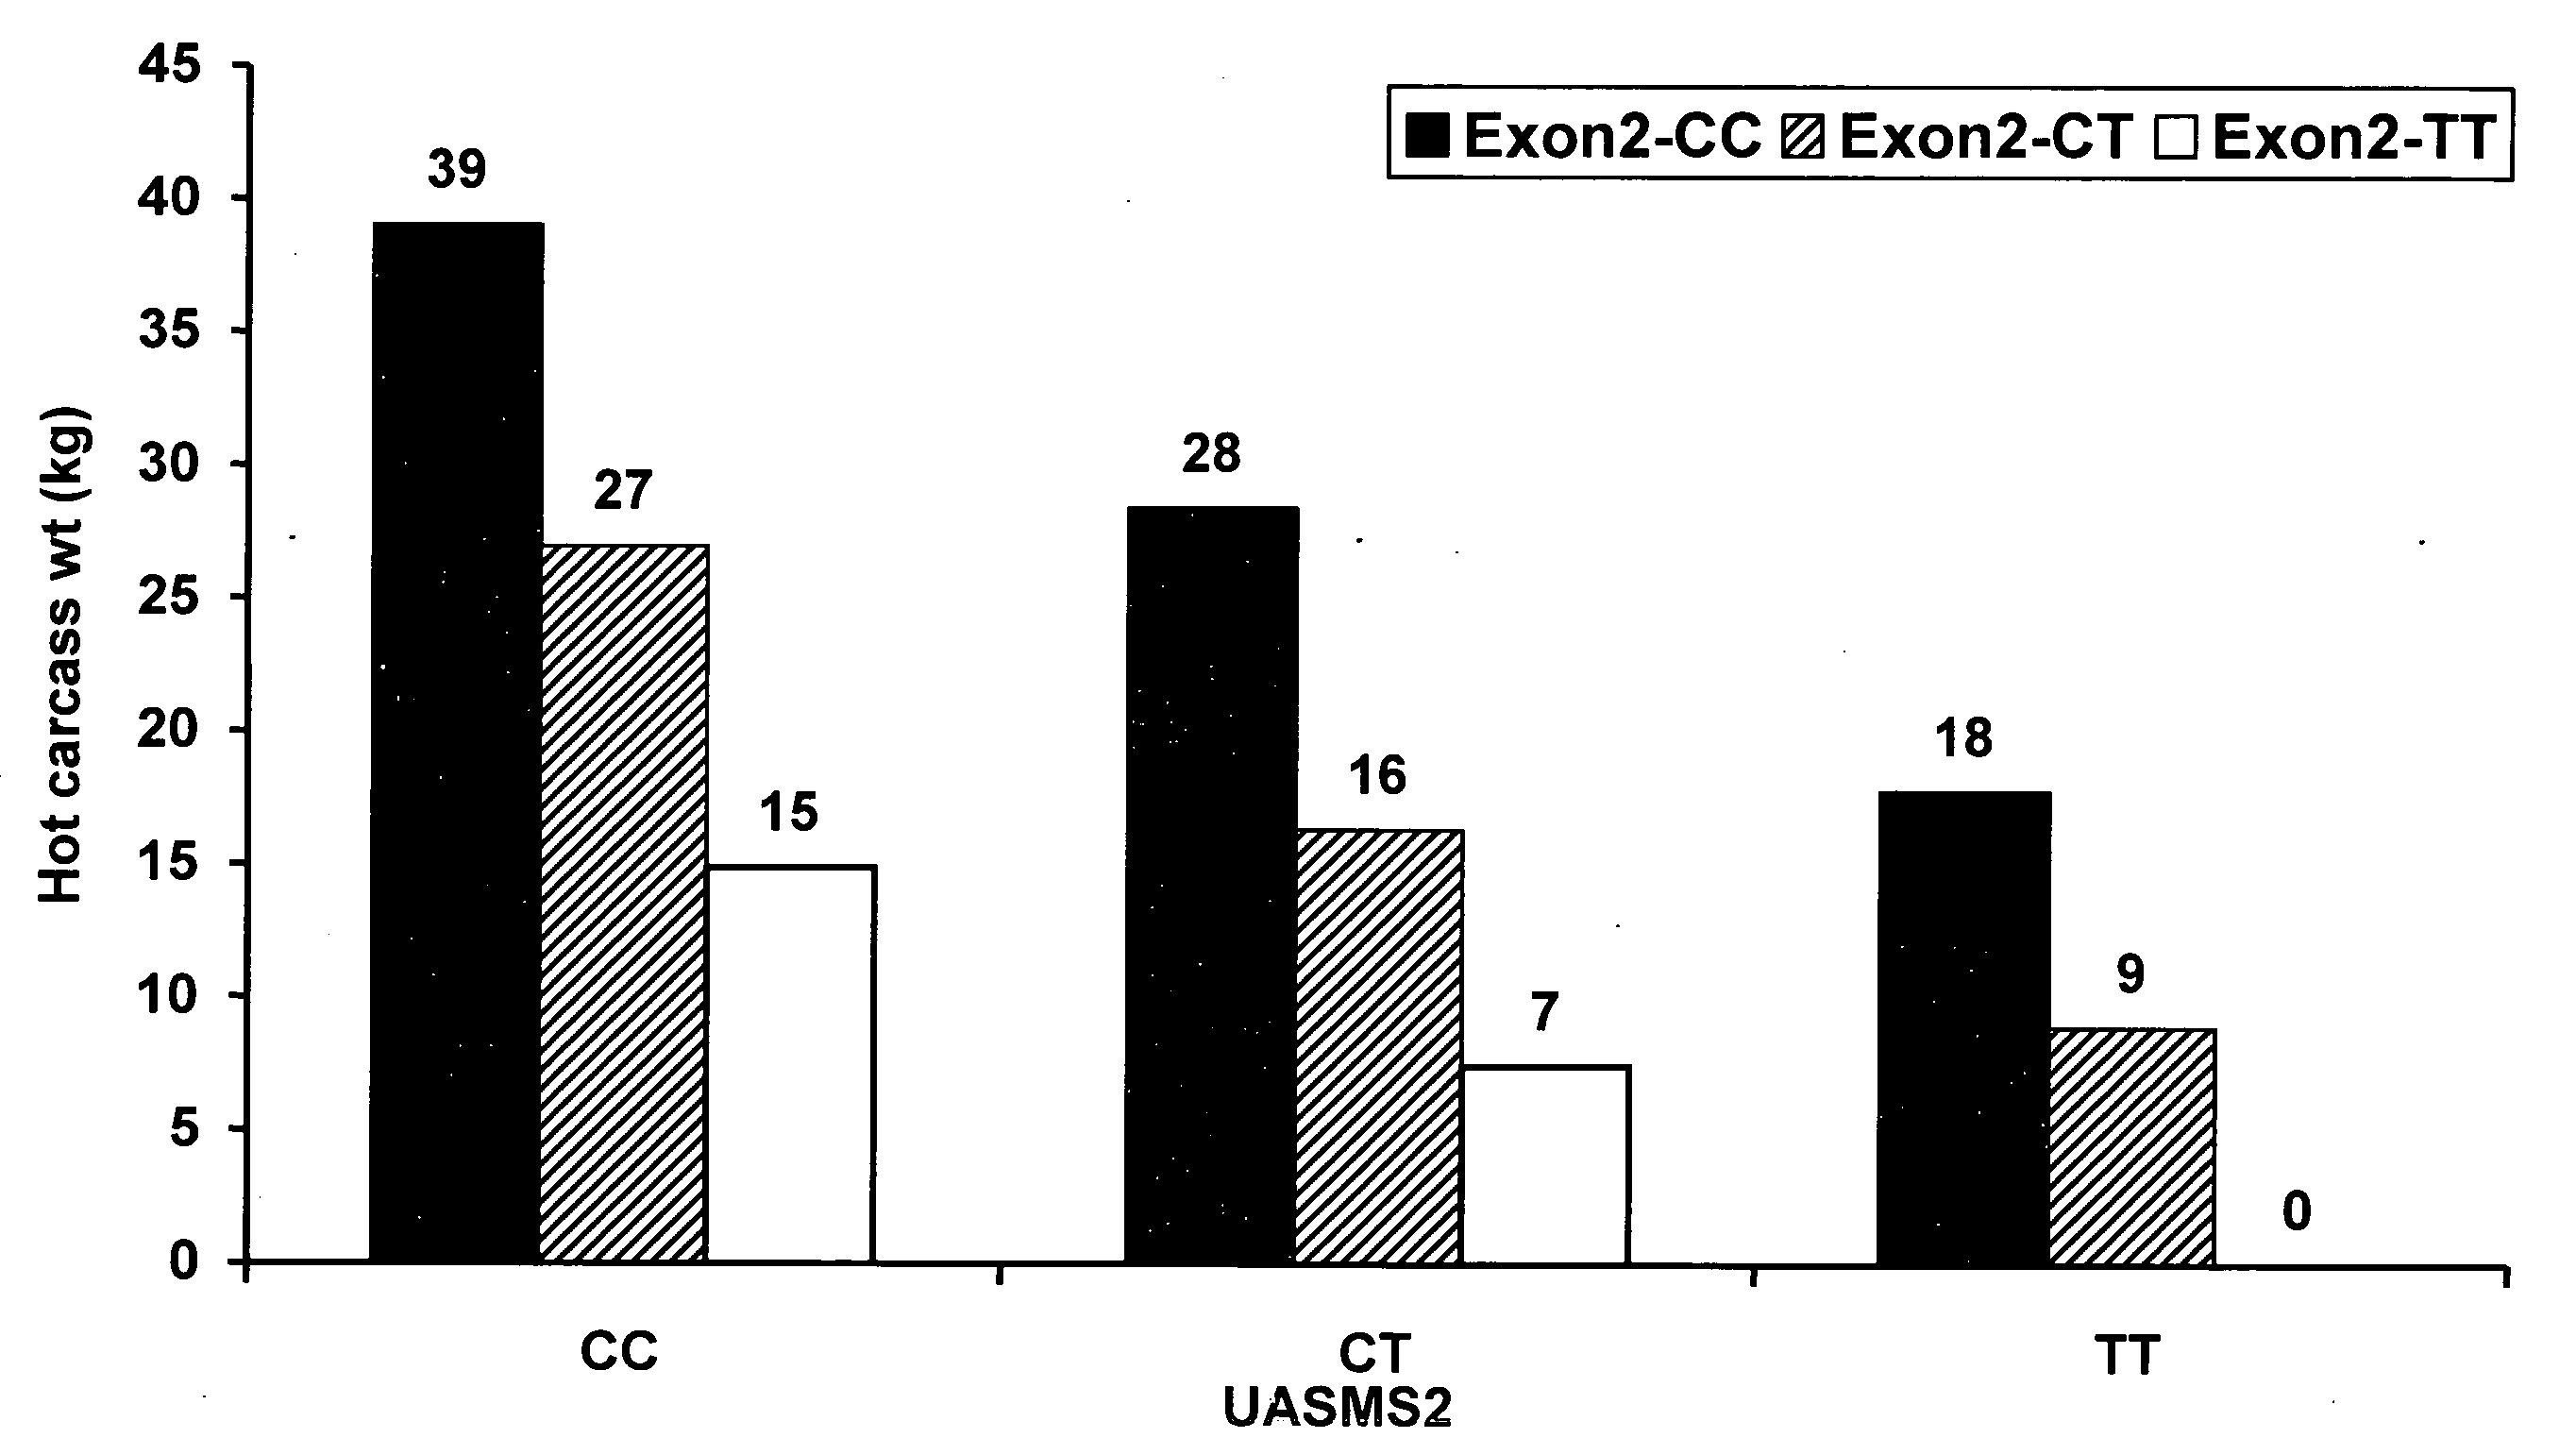
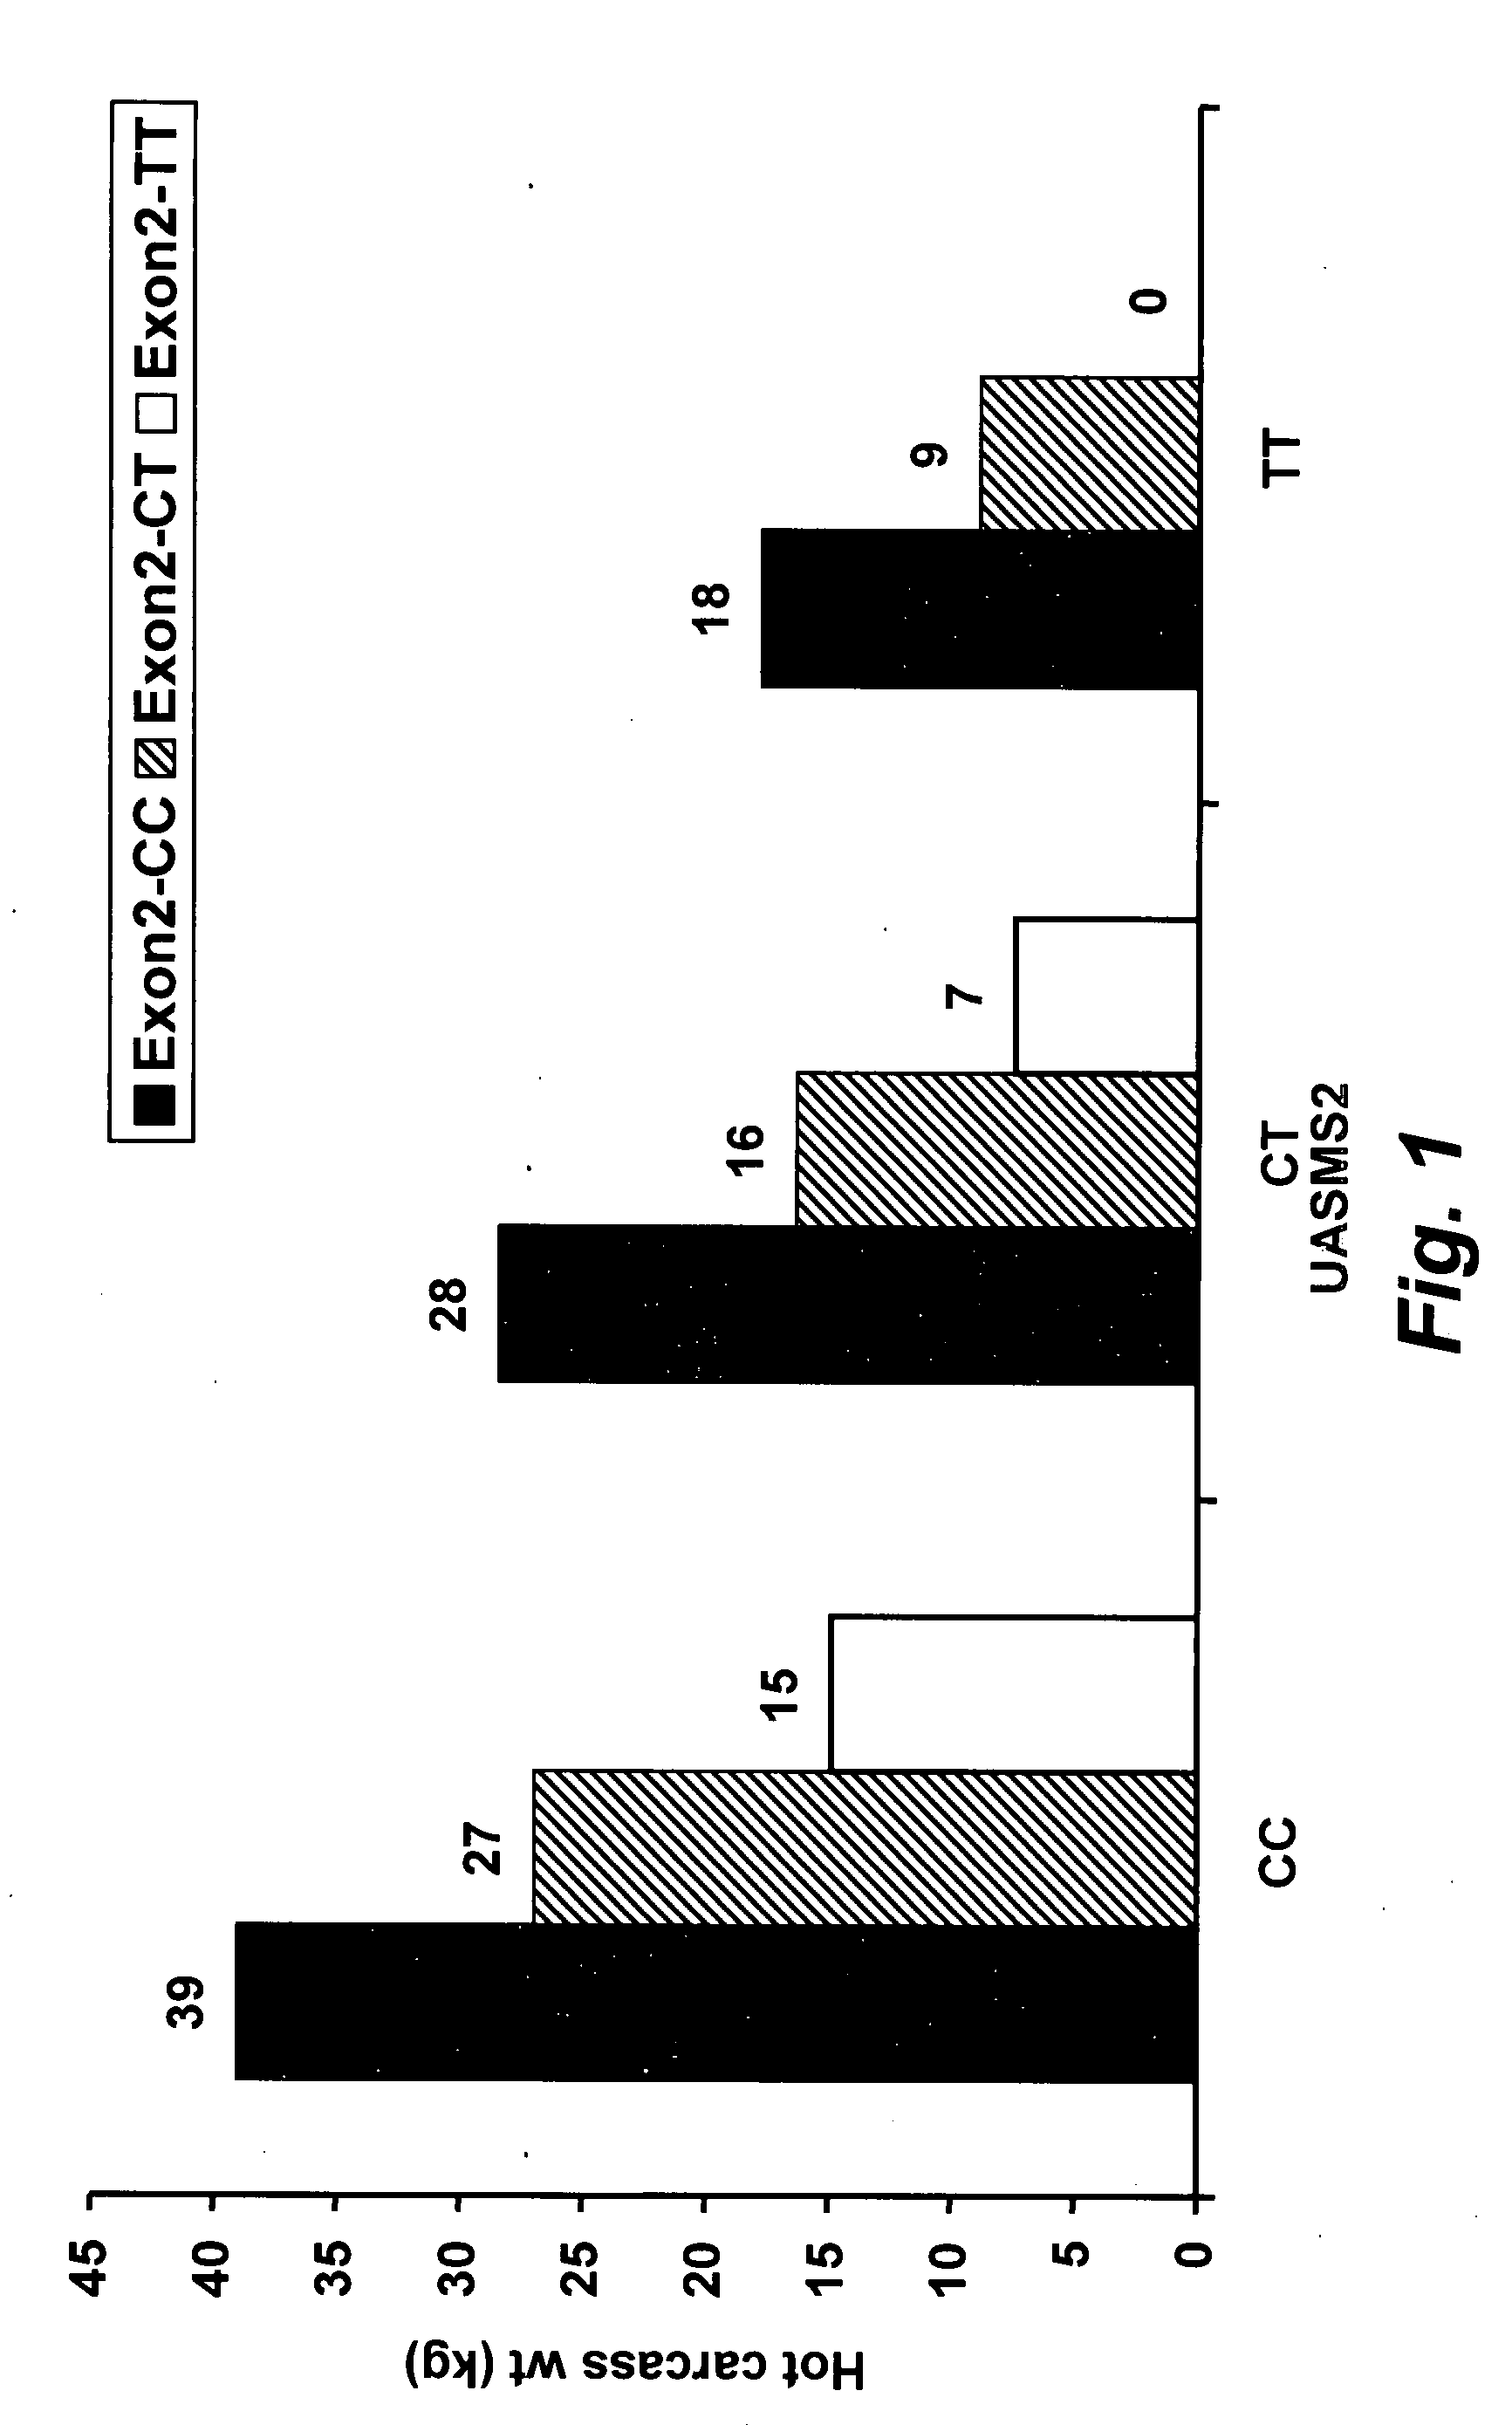
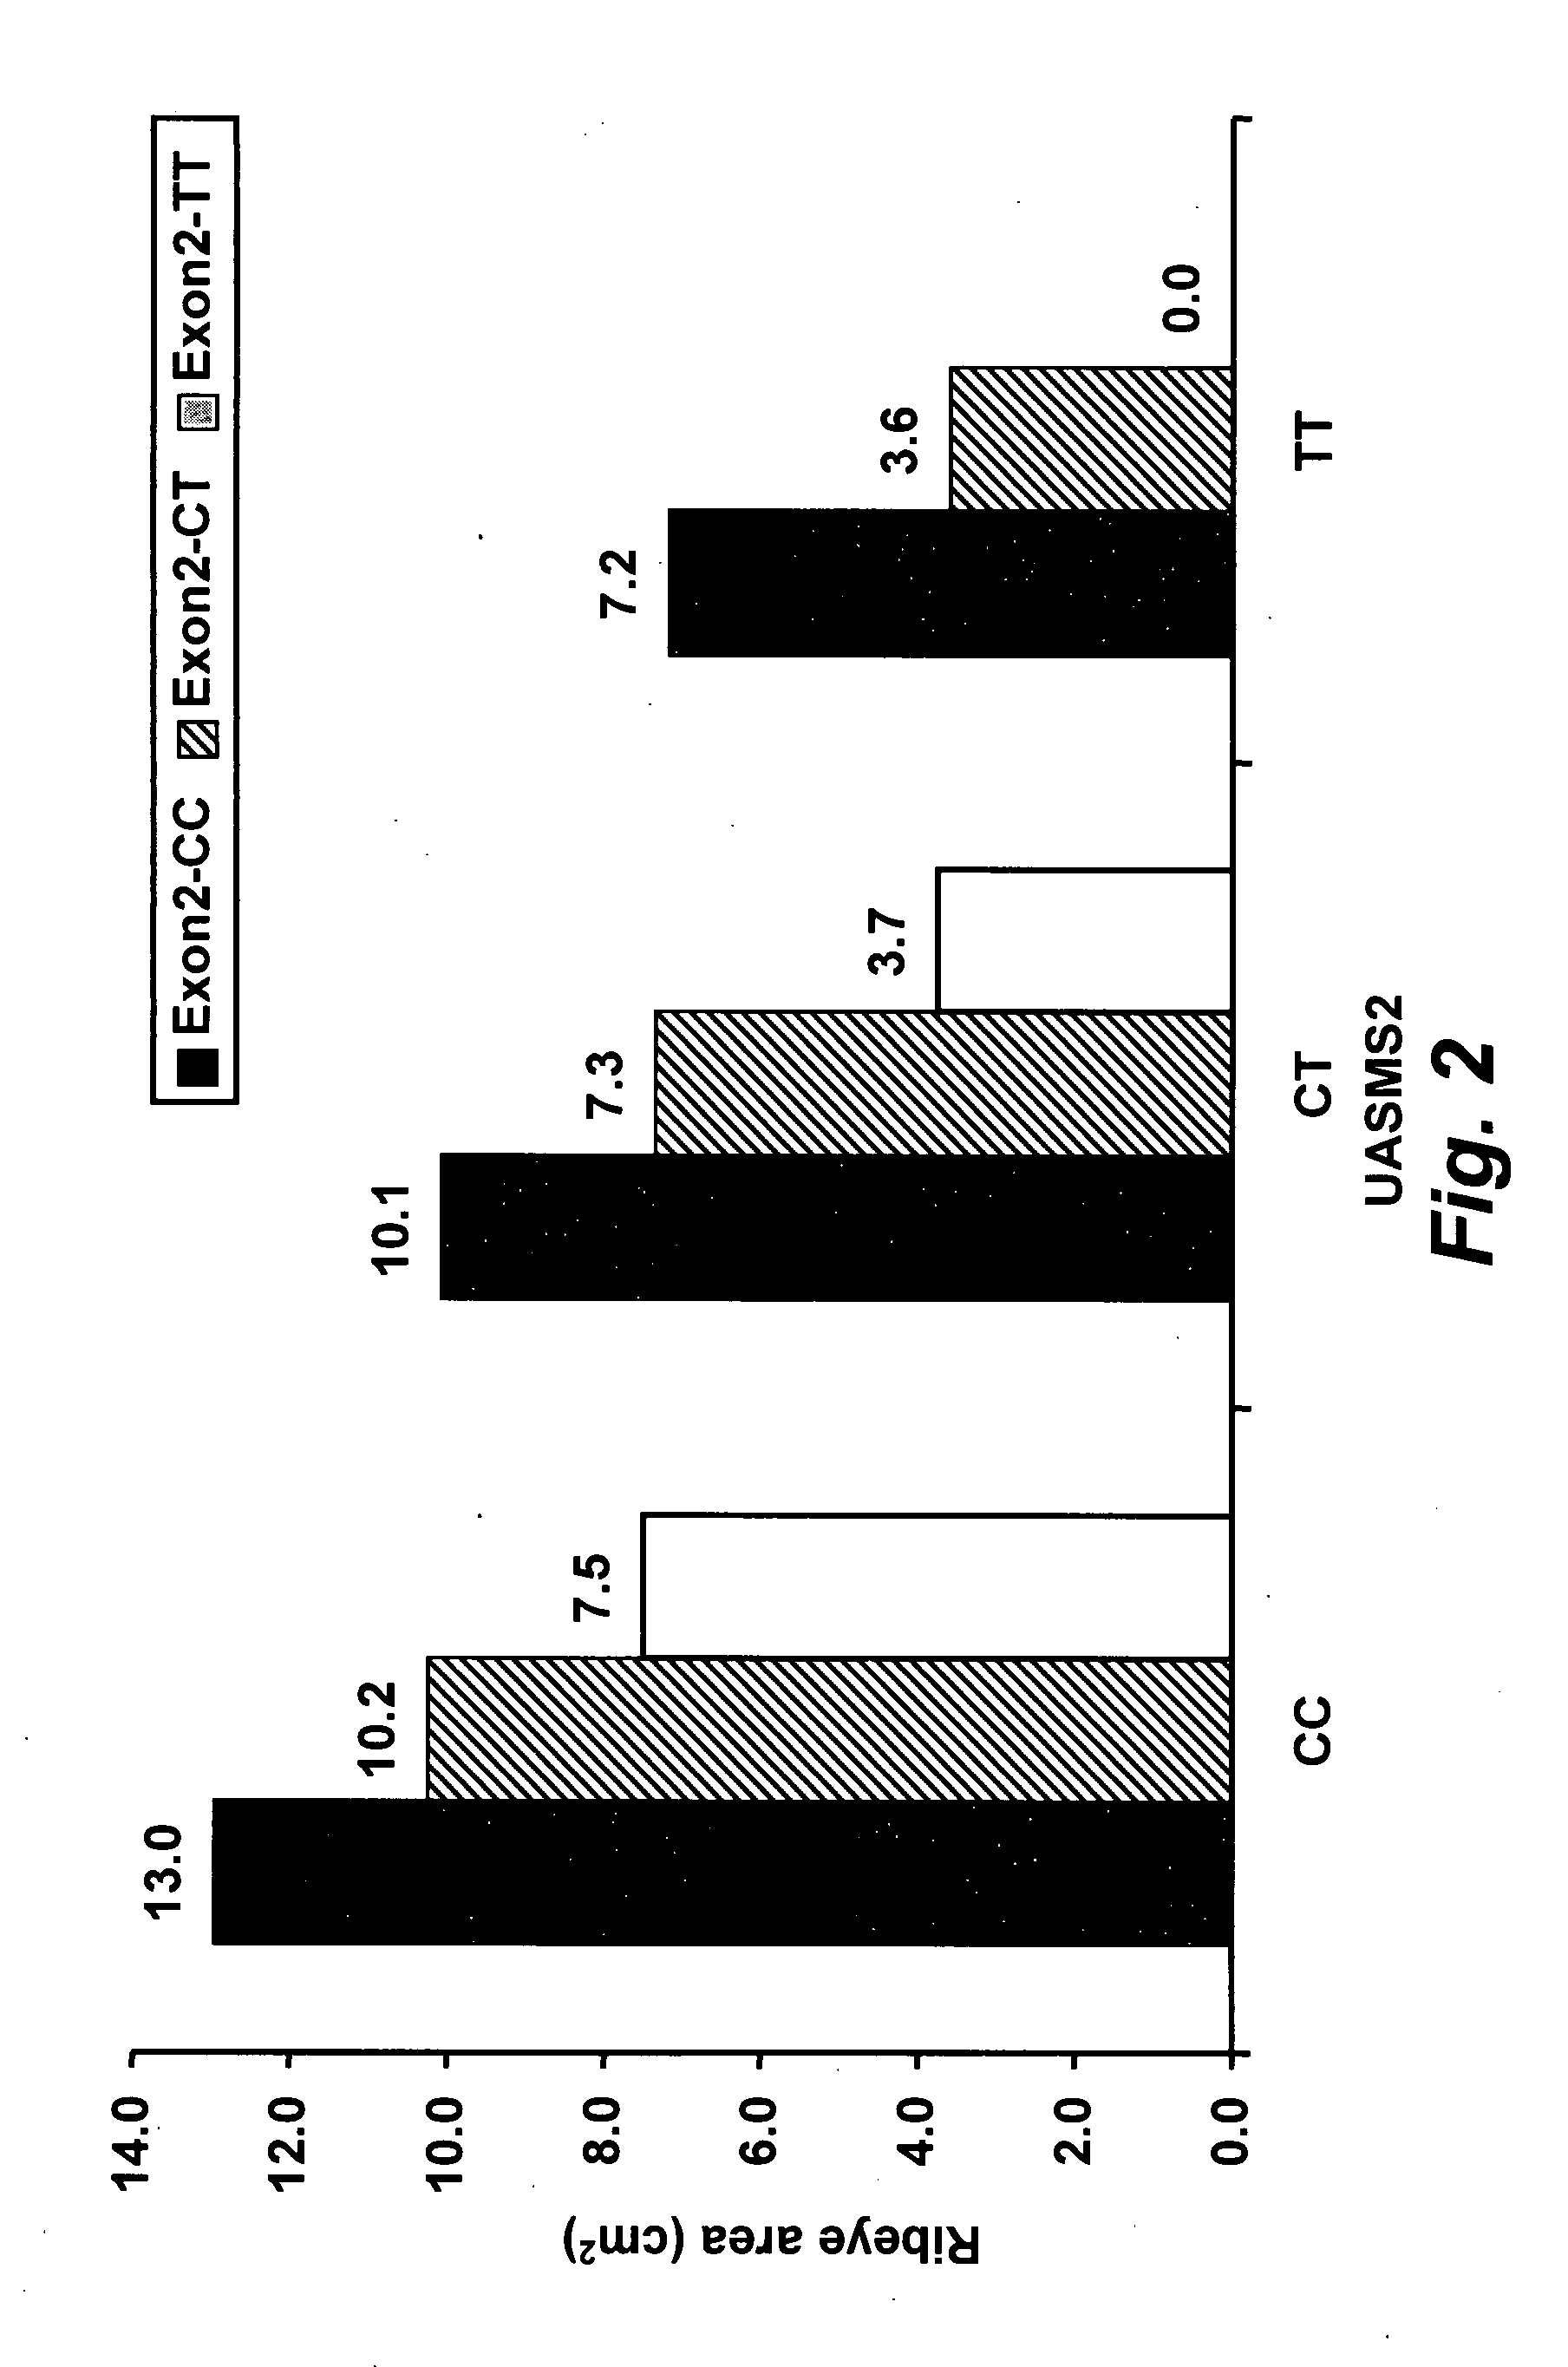
[0169]The correlations between a particular genotype for the ob gene locus with respect to the markers UASMS2 and EXON2-FB for one group of cattle are illustrated in FIGS. 1-6. For example, the greatest hot carcass weight is found for animals having the genotype UASMS2 CC; EXON2-FB CC (FIG. 1), whereas a reduction in marbling score is seen in UASMS2 TT; EXON2-FB TT animals compared to UASMS2 CC; EXON2-FB CC cattle (FIG. 6).

[0170]The experimental data set contained individual-animal information for another group with 2,172 head of cattle. Since complete information was not available on all animals, the results were finally based on 1,668 head of cattle from this group. Although initial genetic information was provided for the genetic markers UASMS1, UASMS2, EXON2-FB, GHR, and DGAT, it was determined that a combination of the UASMS2 (referred to hereafter by the acronym U) and EXON2-FB (referred to hereafter by the acronym E) markers provided the most useful information. Data sets, th...

example 2

Price Data Used in Marketing Simulation Experiments

[0174]To avoid potential time-varying effects that may have occurred in the market, it was assumed that all 1,668 test animals were sold and marketed on the same date under the same market prices. Weekly live and dressed weight prices, reported as the five-market weighted average by the USDA-AMS, were averaged for the year 2004 for use in this analysis. Weekly grid premiums and discounts were obtained from the USDA-AMS National Carlot Meat Report for the year 2004. The average premiums and discounts reported from various packers to the USDA-AMS over this time period were also used. The prices used in the analysis are shown in Table 4.

TABLE 4Price Data Used in Simulation Analysis (Based on USDA / AMSdata for 2004)PriceMarketing Method($ / cwt)GridBase Pricea$118.00Quality GradeAdjustmentPrime$8.29Choice$0.00Select−$8.72Standard−$18.25Yield GradeAdjustment 1.0-2.0$2.93 2.0-2.5$1.67 2.5-3.0$1.24 3.0-4.0−$0.08 3.5-4.0−$0.08 4.0-5.0−$13.70  ...

example 3

Simple Marketing Simulations

[0175](a) The revenue that would be obtained if all 1,668 test cattle were marketed on a live weight basis was calculated. Live weight revenue for each animal was calculated as live weight of the animal at slaughter multiplied by the live weight price shown in Table 2. To determine which genotype would generate the highest revenue on a live weight basis, the mean revenue per head for each genotype, on a live weight basis, was calculated.

[0176](b) The revenue that would be obtained if all 1,668 test head were marketed on a dressed weight basis was determined. Dressed weight revenue for each animal was calculated as the dressed weight of the animal at slaughter multiplied by the live weight price shown in Table 2. Dressed weight revenues were broken down by genotype to determine which genotype generated the highest revenue on a dressed weight basis.

[0177](c) The revenue obtained from marketing all 1,668 test head on a grid was determined by utilizing each a...


PUM

PropertyMeasurementUnit
melting point temperaturesaaaaaaaaaa
temperaturesaaaaaaaaaa
physical characteristicaaaaaaaaaa

Abstract

The present invention is directed to methods and systems for improving the efficiency of livestock production using genetic information obtained from the animal. The methods of the invention comprise obtaining a genetic sample from an animal or embryo, determining the genotype of the animal or embryo with respect to specific quality traits, grouping animals with like genotypes, and optionally, further sub-grouping animals based on like phenotypes. The invention is further directed to a method of predicting the carcass quality of an animal by correlating the rate of change in carcass traits with the genotype of the animal.

Description

INCORPORATION BY REFERENCE[0001]All documents cited or referenced herein (“herein cited documents”), and all documents cited or referenced in herein cited documents, together with any manufacturer's instructions, descriptions, product specifications, and product sheets for any products mentioned herein or in any document incorporated by reference herein, are hereby incorporated herein by reference, and may be employed in the practice of the invention.FIELD OF THE INVENTION[0002]The present invention relates to methods of predicting a marketing method for livestock that maximizes revenue based upon leptin ob gene single nucleotide polymorphisms and the association of these markers with certain economically important carcass traits such as circulating leptin levels, feed intake, growth rate, body weight, carcass merit and carcass composition. The invention further relates to a pair of SNPs, one located in the promoter of leptin gene promoter and the other within the leptin-encoding re...

Claims


Application Information

Patent Timeline
Patent Type & Authority Applications(United States)
IPC IPC(8): G06F19/00
CPCC12Q1/6888C12Q2600/124G06Q99/00G06Q10/06375G06Q50/02G06Q10/063
Inventor LUSK, JAYSON LEE
Owner MERIAL LTD
Why Eureka
Try Eureka