Method and system for monitoring a predicted product quality distribution
Inactive Publication Date: 2009-11-05
GLOBALFOUNDRIES INC
4 Cites 20 Cited by
AI-Extracted Technical Summary
Problems solved by technology
The latter aspect is especially important since, in modern semiconductor facilities, equipment is required which is extremely cost-intensive and represents the dominant part of the total production costs.
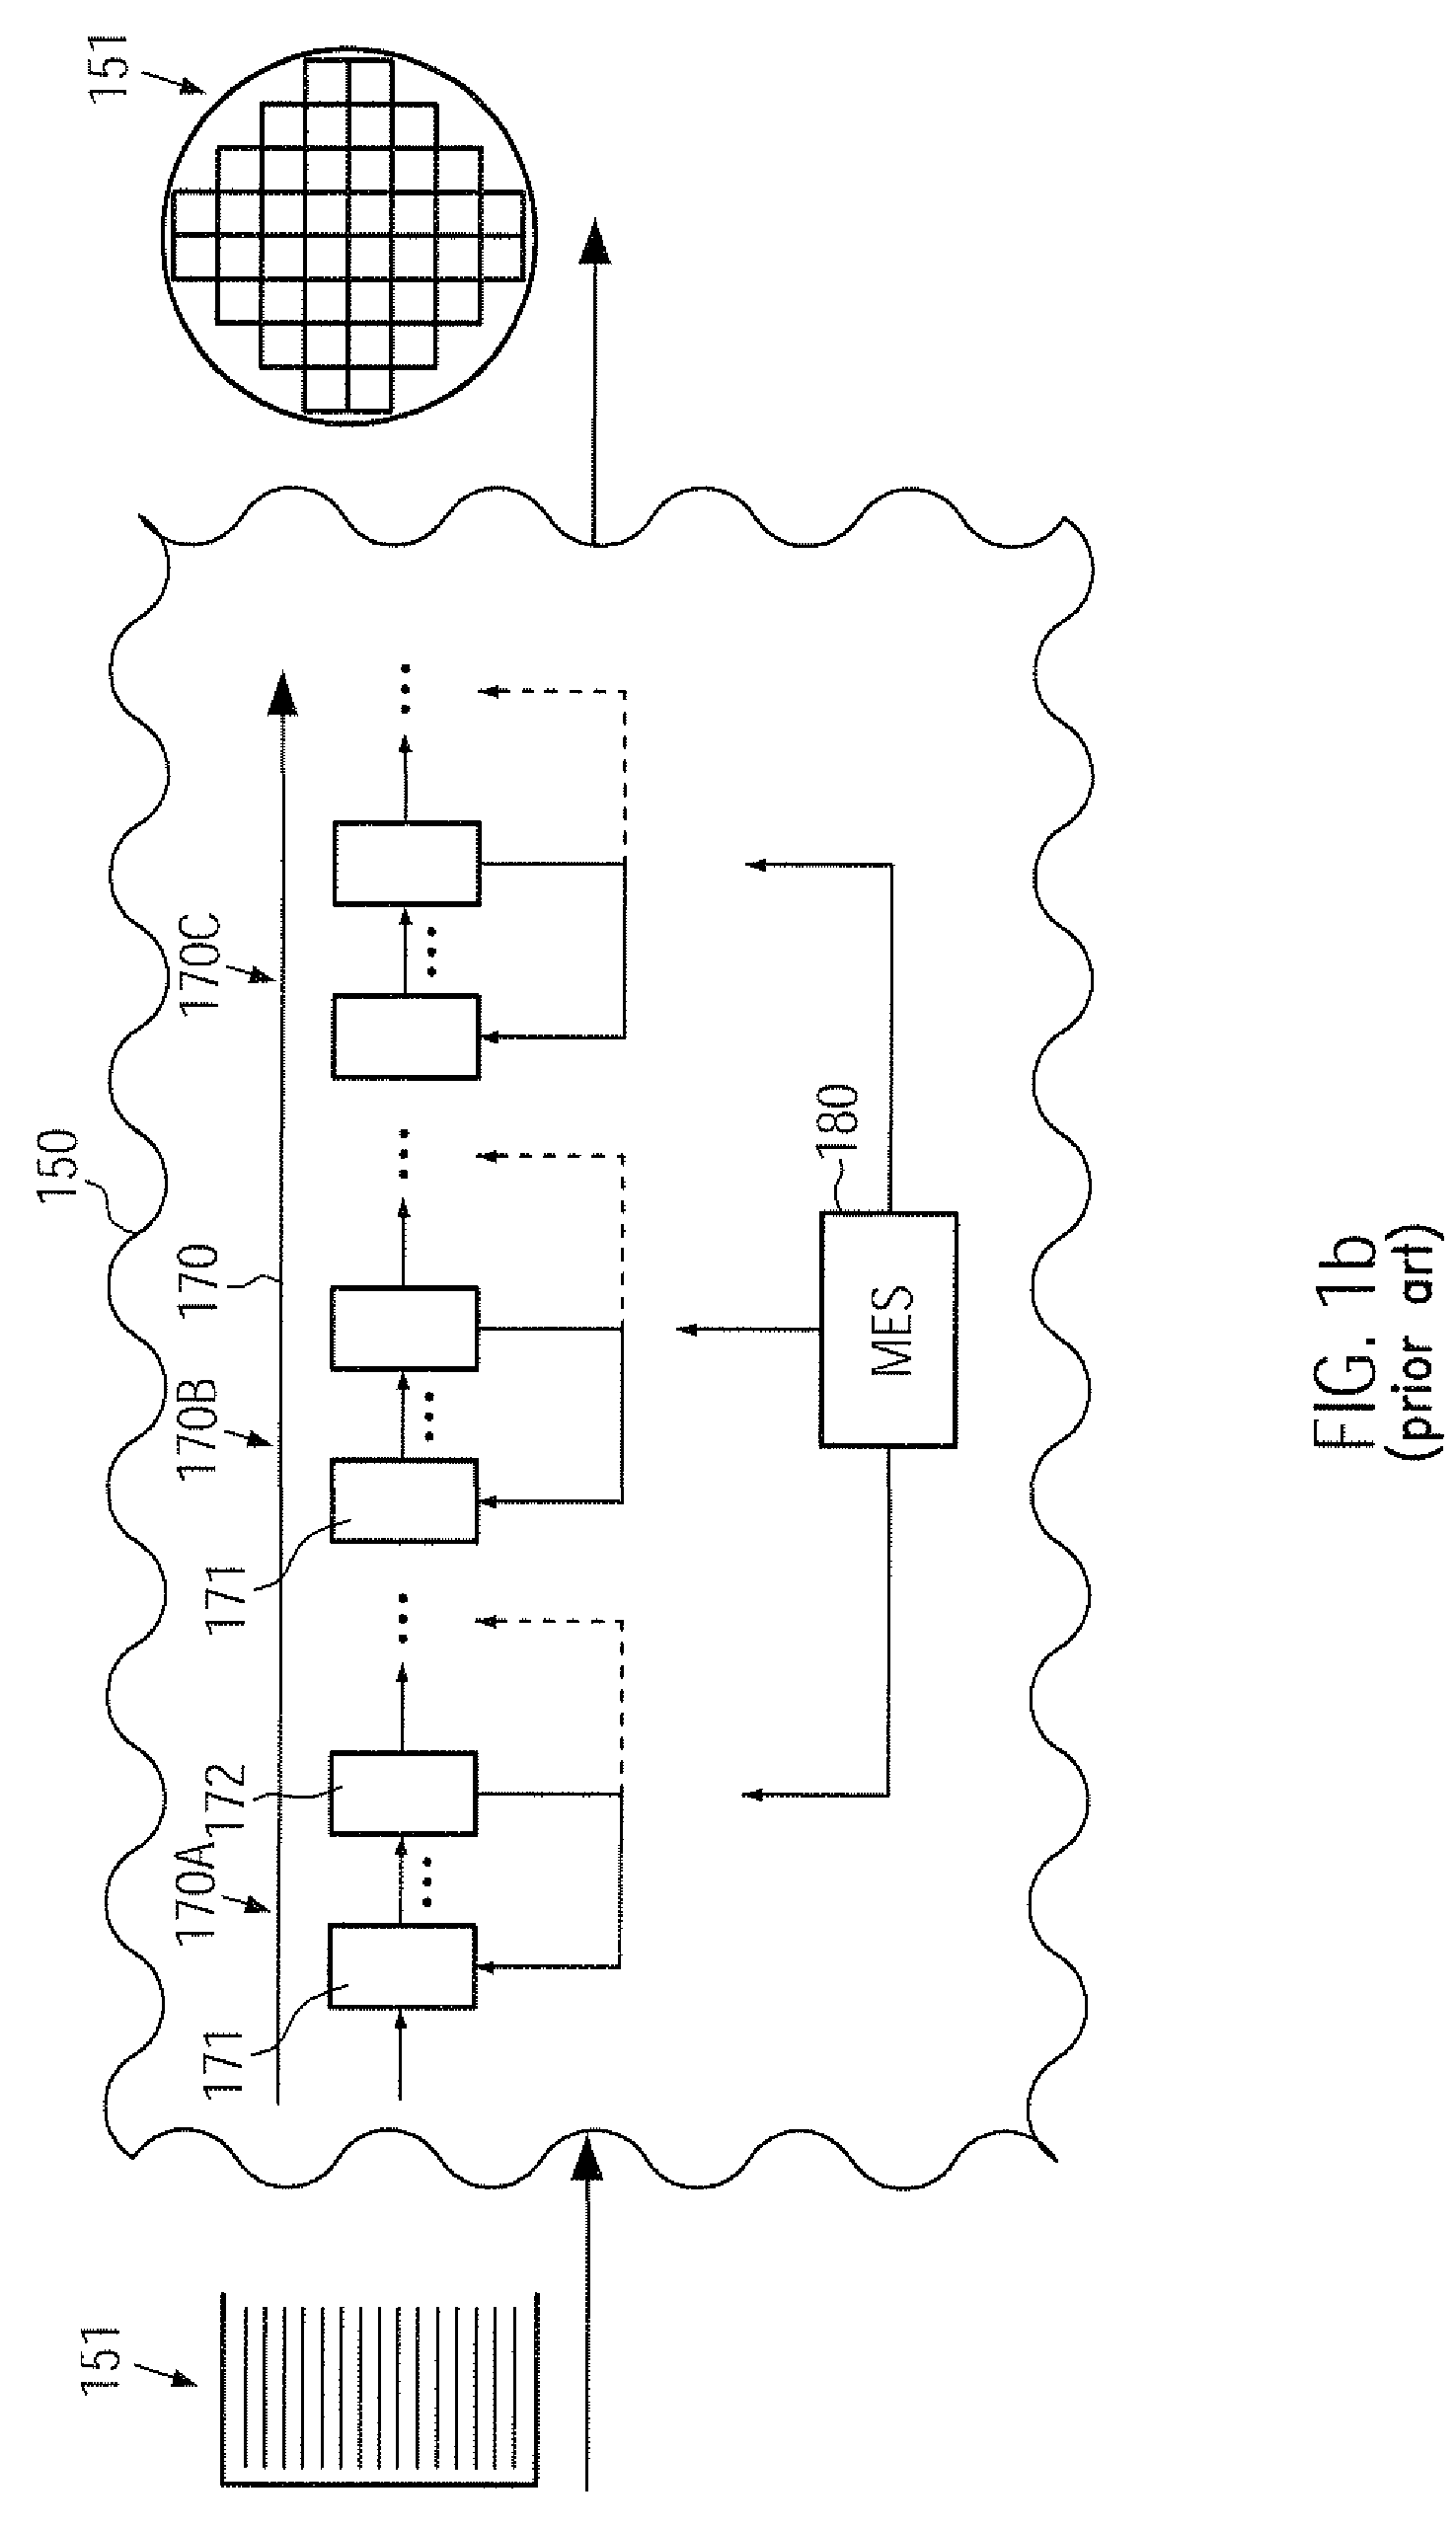
However, the sequence of process recipes performed in process and metrology tools or in functionally combined equipment groups, as well as the recipes themselves, may have to be frequently altered due to fast product changes and highly variable processes involved.
As a consequence, the tool performance in terms of throughput and yield are very critical manufacturing parameters as they significantly affect the overall production costs of the individual devices.
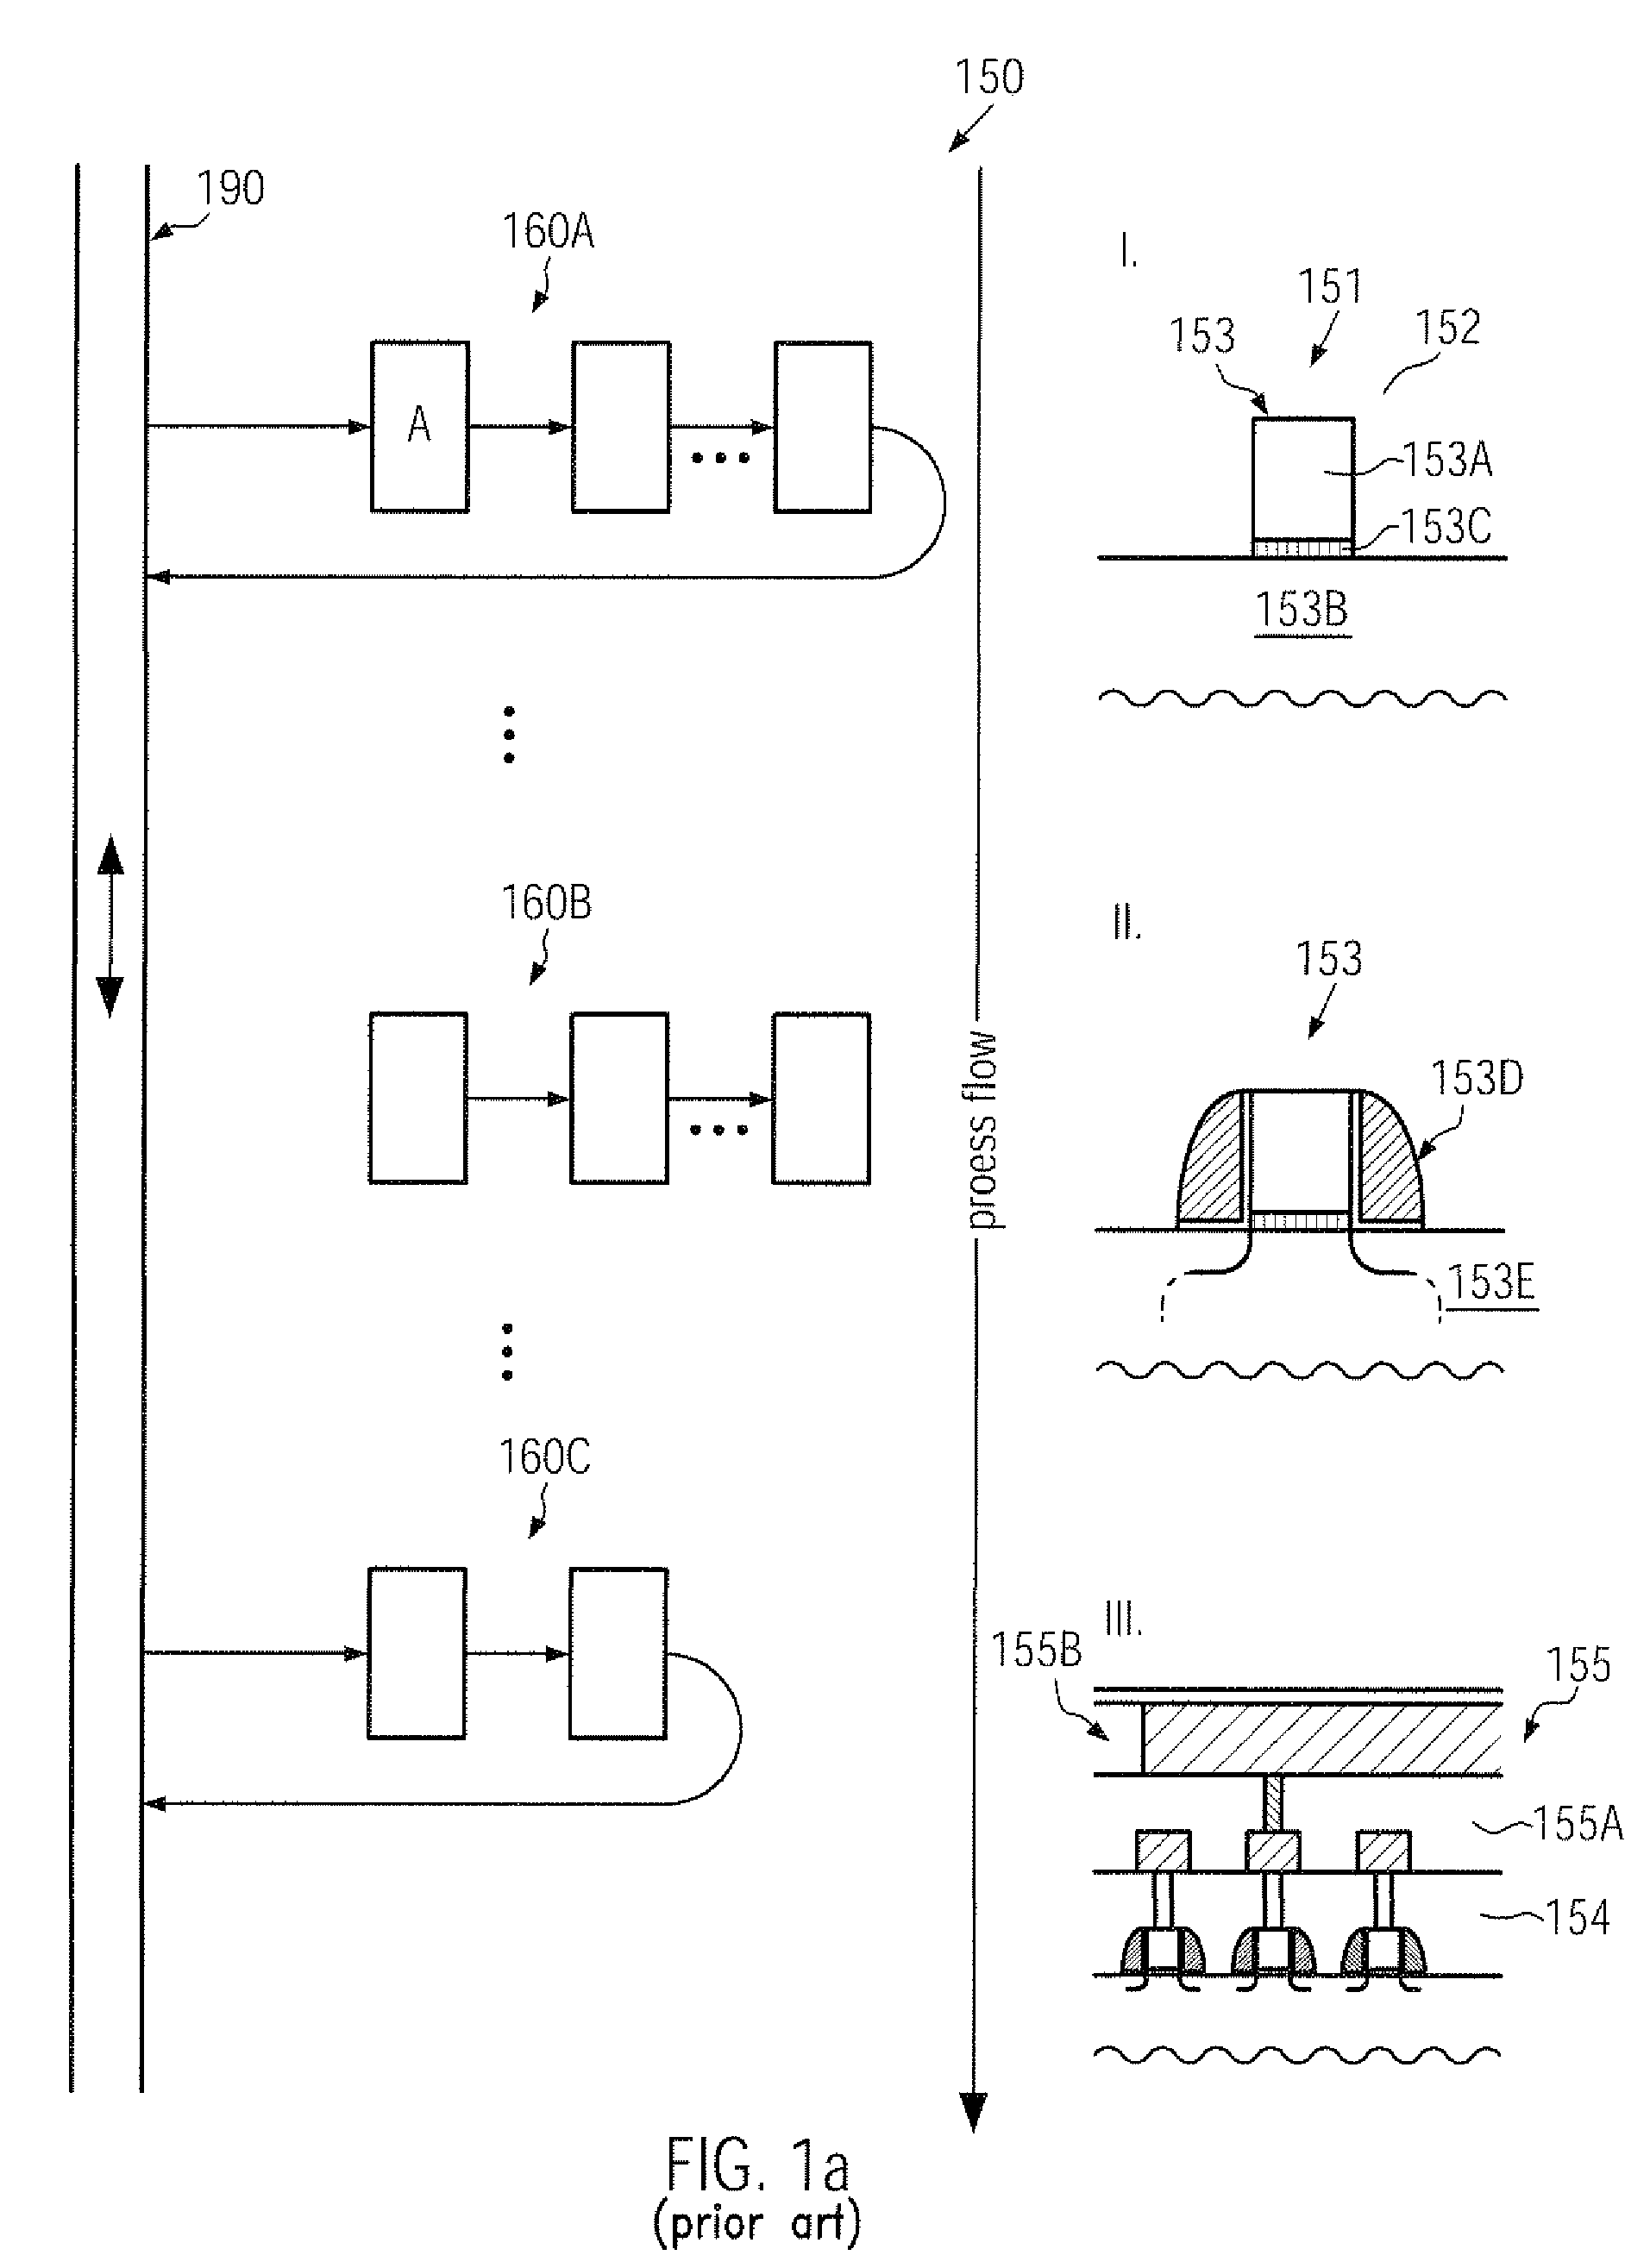
For instance, for transistors in the deep sub-micron range, control of short channel effects may require extremely thin insulation layers which may have a thickness of 1-2 nm for silicon dioxide-based materials, which in turn may result in increased leakage currents through the gate dielectric material.
Hence, further device scaling may require the incorporation of high-k dielectric materials and/or appropriate adaptation of the overall dopant profiles in the channel region of the transistor 153 to obtain an acceptable threshold voltage and maintain channel controllability, which, however, may result in a reduction of the channel conductivity.
For example, it is very difficult to assess the influence...
View moreMethod used
[0035]Generally, the present disclosure provides a system and methods for monitoring the dynamic behavior of a complex manufacturing environment on the basis of predicted quality distributions, which may be assigned to at least a plurality of product substrates to be processed or being processed in the manufacturing environment. For this purpose, electrical measurement data obtained from some sample substrates after completing at least a significant portion of the manufacturing processes under consideration may be used to generate an updated predicted yield distribution, which may therefore include the information of the plurality of manufacturing processes in a highly “condensed” manner, while nevertheless providing a high degree of intelligibility of the information inherent in the electrical measurement data, thereby providing the potential for an efficient automatic monitoring of the overall behavior and thus of the mutual interaction of the various complex parts of the manufacturing environment under consideration. The predicted quality distribution may be understood as a representative metric for determining the expected yield at a specific die location across the substrates, which may also be referred to as a “graded” die forecast with respect to yield and thus quality of the semiconductor product under consideration. In some illustrative aspects, the yield distribution may refer to a single predefined quality standard or specification, that is, the resulting semiconductor product may have to respect a predefined quality standard so that the quality distribution may thus reflect a metric for the probability or the number of products having the specified quality standard may be obtained in the respective die location, when a plurality of substrates are considered. For instance, a complex central processing unit (CPU) may comprise a plurality of speed critical signal paths, possibly in combination with fast internal memory areas, such as cache memories, which may also have a significant influence on the overall performance of the CPU. Thus, the finally obtained storage capacity of the cache memory may represent one quality criterion and the frequency with which the CPU core may be reliably operated may also present a further quality criterion, wherein, in combination, the plurality of respective quality criteria may determine a specific quality grade of the CPU. Thus, quality distribution may relate to CPUs of a specific quality standard, while other quality standards, for instance lower-ranked semiconductor devices, may not be taken into consideration when establishing a respective predicted quality distribution. In other cases, complex analog circuitry may also be assessed on the basis of respective quality criteria and also storage devices may be divided into several quality categories, depending on the respective criteria, which may depend on company-internal decisions, customer demands and the like. It should be appreciated, however, that, in other illustrative embodiments, the predicted quality distribution may also accommodate two or more quality grades of the semiconductor device under consideration.
[0036]By assigning a predicted quality distribution to at least a plurality of product groups, which are currently being processed in the manufacturing environment, an assessment of the environment may be obtained with a degree of granularity, depending on product groups associated with a respective predicted quality distribution. For example, a corresponding predicted quality distribution may be assigned to each group of product substrates or generally to any group of product substrates to be processed in the manufacturing environment, at least for a desired time period, in order to provide enhanced statistical significance in identifying any disturbances of the manufacturing environment. That is, typically, a plurality of measurement data may be created when stepping the product groups through the plurality of manufacturing processes, as previously explained, wherein typically selected sample substrates may be subjected to measurement to obtain a compromise between overall throughput and controllability of the individual process steps. Typically, respective measurement samples may be selected from each product group so that the assignment of a respective predicted quality distribution to each group of product substrates may provide the potential for “refining” the predicted quality distribution on the basis of the available production data. Hence, in some illustrative aspects disclosed herein, the initial predicted quality distribution, which may be established, for instance, on the basis of averaged quality data of substrates after forming the final quality test measurements, may be updated by using the corresponding measurement data, wherein the updated version of the predicted quality distribution may now reflect the current status of a part of the manufacturing environment including the respective factory targets, control strategies, status of the production tools and the like. For example, when a group of products may arrive at a critical process module, such as a sequence of manufacturing processes for patterning a gate electrode, measurement data of the finally patterned gate length may be used for updating the predicted quality distribution assigned to the group of products prior to performing the critical gate patterning process, wherein, for instance, a known correlation or any appropriate model or any other mechanism may be used for determining an updated yield metric for each die grade. For instance, if measurement reveals that central die regions may be within the process targets with respect to the gate length, while a plurality of die regions at the substrate edge of the substrates may have an increased gate length, the corresponding yield metrics, such as percentages and the like, may be adopted so as to reduce the expectation for semiconductor products for these specific die grades due to the increased gate length created by the manufacturing sequence. Consequently, the updated quality distribution may now be regarded as the new “target” quality distribution for the specific group of substrates, which may then be further updated on the basis of further production data, thereby increasingly incorporating further production relevant information. It should be appreciated that, for instance, a significant deviation of measurement data of the process result of specific manufacturing processes may immediately be identified by the inline control strategies and monitoring algorithms, wherein, however, a moderately subtle change may remain undetected by the local internal control mechanisms. As an example, target values for the various critical process steps may have been established and may be used for the complex internal control strategies, such as APC (advanced process control) mechanisms, which may therefore attempt to maintain the process output at the specified target value. However, the respective target value may actually be offset by a certain amount from a “true” target value, which may, however, not be known in advance, or which may have shifted due to modifications of, for instance, the overall transistor architecture, layout specifics and the like. Consequently, although the local control mechanisms may be highly efficient in maintaining the correspond...
View moreBenefits of technology
[0020]Generally, the present disclosure relates to systems and techniques for monitoring the overall behavior of a complex manufacturing environment with respect to the finally produced quality of semiconductor products while significantly reducing the response time with respect to the occurrence of any disturbances that may have occurred during the processing of the semiconductor devices. To this end, a quality distribution may be assigned to at least a significant portion of product groups to be processed or being processed in the manufacturing environment, wherein the dynamic behavior of the quality distribution may be monitored so as to detect a disturbance within the manufacturing environment. The monitoring of the dynamic development of the quality distribution may comprise at least one measurement step producing electrical test data at a very advanced manufacturing stage of the semiconductor products, which may be obtained with reduced delay compared to electrical wafer sort data, which may typically be gathered after a significant time period after performing critical manufacturing steps that determine the quality of the semiconductor products. In some illustrative aspects disclosed herein, the predicted quality distribution obtained on the basis of the electrical test measurement data may be compared with the current predicted quality distribution, wherein a pronounced change may thus indicate the occurrence of a disturbance in the manufacturing environment. That is, the predicted quality distribution, which may be updated on the basis of intermediate measurement data, may therefore contain inherent information with respect to the mutual interaction of the various paths of the complex manufacturing environment, for instance with respect to local control strategies, process targets for the various process modules and the like, while the electrical measurement data may provide a moderately robust estimation of actual quality distribution so that a significant mismatch bet...
View moreAbstract
In a complex manufacturing environment for producing semiconductor devices, a predicted quality distribution in the form of a graded die forecast may be monitored with respect to changes in order to more efficiently identify factory disturbances. To this end, a predicted distribution obtained on the basis of electrical measurement data may be compared with a predicted yield distribution based on other production data. That is, an efficient automatic monitoring of the manufacturing environment may be accomplished with reduced probability of missing respective disturbance situations, since the large number of electrical parameters may be condensed into the predicted quality distribution.
Application Domain
Registering/indicating during manufacturing processComputation using non-denominational number representation +3
Technology Topic
Image
Examples
- Experimental program(1)
Example
[0032]While the subject matter disclosed herein is susceptible to various modifications and alternative forms, specific embodiments thereof have been shown by way of example in the drawings and are herein described in detail. It should be understood, however, that the description herein of specific embodiments is not intended to limit the invention to the particular forms disclosed, but on the contrary, the intention is to cover all modifications, equivalents, and alternatives falling within the spirit and scope of the invention as defined by the appended claims.
DETAILED DESCRIPTION
[0033]Various illustrative embodiments of the invention are described below. In the interest of clarity, not all features of an actual implementation are described in this specification. It will of course be appreciated that in the development of any such actual embodiment, numerous implementation-specific decisions must be made to achieve the developers' specific goals, such as compliance with system-related and business-related constraints, which will vary from one implementation to another. Moreover, it will be appreciated that such a development effort might be complex and time-consuming, but would nevertheless be a routine undertaking for those of ordinary skill in the art having the benefit of this disclosure.
[0034]The present subject matter will now be described with reference to the attached figures. Various structures, systems and devices are schematically depicted in the drawings for purposes of explanation only and so as to not obscure the present disclosure with details that are well known to those skilled in the art. Nevertheless, the attached drawings are included to describe and explain illustrative examples of the present disclosure. The words and phrases used herein should be understood and interpreted to have a meaning consistent with the understanding of those words and phrases by those skilled in the relevant art. No special definition of a term or phrase, i.e., a definition that is different from the ordinary and customary meaning as understood by those skilled in the art, is intended to be implied by consistent usage of the term or phrase herein. To the extent that a term or phrase is intended to have a special meaning, i.e., a meaning other than that understood by skilled artisans, such a special definition will be expressly set forth in the specification in a definitional manner that directly and unequivocally provides the special definition for the term or phrase.
[0035]Generally, the present disclosure provides a system and methods for monitoring the dynamic behavior of a complex manufacturing environment on the basis of predicted quality distributions, which may be assigned to at least a plurality of product substrates to be processed or being processed in the manufacturing environment. For this purpose, electrical measurement data obtained from some sample substrates after completing at least a significant portion of the manufacturing processes under consideration may be used to generate an updated predicted yield distribution, which may therefore include the information of the plurality of manufacturing processes in a highly “condensed” manner, while nevertheless providing a high degree of intelligibility of the information inherent in the electrical measurement data, thereby providing the potential for an efficient automatic monitoring of the overall behavior and thus of the mutual interaction of the various complex parts of the manufacturing environment under consideration. The predicted quality distribution may be understood as a representative metric for determining the expected yield at a specific die location across the substrates, which may also be referred to as a “graded” die forecast with respect to yield and thus quality of the semiconductor product under consideration. In some illustrative aspects, the yield distribution may refer to a single predefined quality standard or specification, that is, the resulting semiconductor product may have to respect a predefined quality standard so that the quality distribution may thus reflect a metric for the probability or the number of products having the specified quality standard may be obtained in the respective die location, when a plurality of substrates are considered. For instance, a complex central processing unit (CPU) may comprise a plurality of speed critical signal paths, possibly in combination with fast internal memory areas, such as cache memories, which may also have a significant influence on the overall performance of the CPU. Thus, the finally obtained storage capacity of the cache memory may represent one quality criterion and the frequency with which the CPU core may be reliably operated may also present a further quality criterion, wherein, in combination, the plurality of respective quality criteria may determine a specific quality grade of the CPU. Thus, quality distribution may relate to CPUs of a specific quality standard, while other quality standards, for instance lower-ranked semiconductor devices, may not be taken into consideration when establishing a respective predicted quality distribution. In other cases, complex analog circuitry may also be assessed on the basis of respective quality criteria and also storage devices may be divided into several quality categories, depending on the respective criteria, which may depend on company-internal decisions, customer demands and the like. It should be appreciated, however, that, in other illustrative embodiments, the predicted quality distribution may also accommodate two or more quality grades of the semiconductor device under consideration.
[0036]By assigning a predicted quality distribution to at least a plurality of product groups, which are currently being processed in the manufacturing environment, an assessment of the environment may be obtained with a degree of granularity, depending on product groups associated with a respective predicted quality distribution. For example, a corresponding predicted quality distribution may be assigned to each group of product substrates or generally to any group of product substrates to be processed in the manufacturing environment, at least for a desired time period, in order to provide enhanced statistical significance in identifying any disturbances of the manufacturing environment. That is, typically, a plurality of measurement data may be created when stepping the product groups through the plurality of manufacturing processes, as previously explained, wherein typically selected sample substrates may be subjected to measurement to obtain a compromise between overall throughput and controllability of the individual process steps. Typically, respective measurement samples may be selected from each product group so that the assignment of a respective predicted quality distribution to each group of product substrates may provide the potential for “refining” the predicted quality distribution on the basis of the available production data. Hence, in some illustrative aspects disclosed herein, the initial predicted quality distribution, which may be established, for instance, on the basis of averaged quality data of substrates after forming the final quality test measurements, may be updated by using the corresponding measurement data, wherein the updated version of the predicted quality distribution may now reflect the current status of a part of the manufacturing environment including the respective factory targets, control strategies, status of the production tools and the like. For example, when a group of products may arrive at a critical process module, such as a sequence of manufacturing processes for patterning a gate electrode, measurement data of the finally patterned gate length may be used for updating the predicted quality distribution assigned to the group of products prior to performing the critical gate patterning process, wherein, for instance, a known correlation or any appropriate model or any other mechanism may be used for determining an updated yield metric for each die grade. For instance, if measurement reveals that central die regions may be within the process targets with respect to the gate length, while a plurality of die regions at the substrate edge of the substrates may have an increased gate length, the corresponding yield metrics, such as percentages and the like, may be adopted so as to reduce the expectation for semiconductor products for these specific die grades due to the increased gate length created by the manufacturing sequence. Consequently, the updated quality distribution may now be regarded as the new “target” quality distribution for the specific group of substrates, which may then be further updated on the basis of further production data, thereby increasingly incorporating further production relevant information. It should be appreciated that, for instance, a significant deviation of measurement data of the process result of specific manufacturing processes may immediately be identified by the inline control strategies and monitoring algorithms, wherein, however, a moderately subtle change may remain undetected by the local internal control mechanisms. As an example, target values for the various critical process steps may have been established and may be used for the complex internal control strategies, such as APC (advanced process control) mechanisms, which may therefore attempt to maintain the process output at the specified target value. However, the respective target value may actually be offset by a certain amount from a “true” target value, which may, however, not be known in advance, or which may have shifted due to modifications of, for instance, the overall transistor architecture, layout specifics and the like. Consequently, although the local control mechanisms may be highly efficient in maintaining the corresponding manufacturing processes within respective process windows in order to obtain a distribution of process results centered around the predefined target value, the final electrical performance of the semiconductor device under consideration may not necessarily be correlated to the corresponding target value as may be expected. A corresponding “discrepancy” between actually used target values and respective “true” target values may be considered as a disturbance of the manufacturing environment, since this disturbance may result in a reduced overall yield for a specified quality grade. Similarly, responding to customer demands may also be difficult when a corresponding disturbance may remain undetected over extended time periods since, for instance, a respective customer demand may be expected to be met by the products currently in process, while the final products may have a significantly different quality distribution.
[0037]Consequently, the usage of sample wafer electrical test (SWET) data may be advantageous since these measurement data are typically obtained at a very late stage of the manufacturing process, for instance after completing one or more metallization levels, or may even provide similar electrical data as are obtained during the wafer sort process, in which each semiconductor device may undergo a respective electrical test procedure on the basis of which the quality grade of the respective semiconductor device may be evaluated prior to actually dicing the substrates and performing further process steps, such as packaging and the like. The respective electrical measurement data may, however, contain a plurality of individual parameters, such as sheet resistance values for various configurations, such as resistors, doped regions, strained semiconductor materials and the like, oscillator frequencies, drive currents of transistor devices, threshold voltage values, or any other current and voltage responses of corresponding test structures associated with each die region. Since the monitoring of a large number of electrical parameters, which implicitly may contain the information about the dynamic behavior of the manufacturing environment with respect to disturbances, may be difficult since corresponding “signals” indicating a prominent disturbance may be overlooked, while other signals may indicate a disturbance but may actually not be relevant for the final product quality. Consequently, according to the principles disclosed herein, the valuable electrical measurement data may be “reduced” by applying a model and determining a predicted quality distribution, which may then be compared to the previous predicted quality distribution so that a basic match of these distributions may indicate an appropriate overall behavior of the manufacturing environment, while a significant change may indicate a disturbance of the manufacturing environment. Consequently, by using an appropriate model, the received electrical measurement data may be automatically processed and analyzed, thereby providing an automatic monitoring system with respect to disturbances of the manufacturing environment, wherein, due to the electrical measurement data, a contemporary response to any disturbances may be accomplished while at the same time significantly reducing the probability of missing a respective factory disturbance, as may be the case in conventional strategies in which a plurality of electrical parameters are individually monitored.
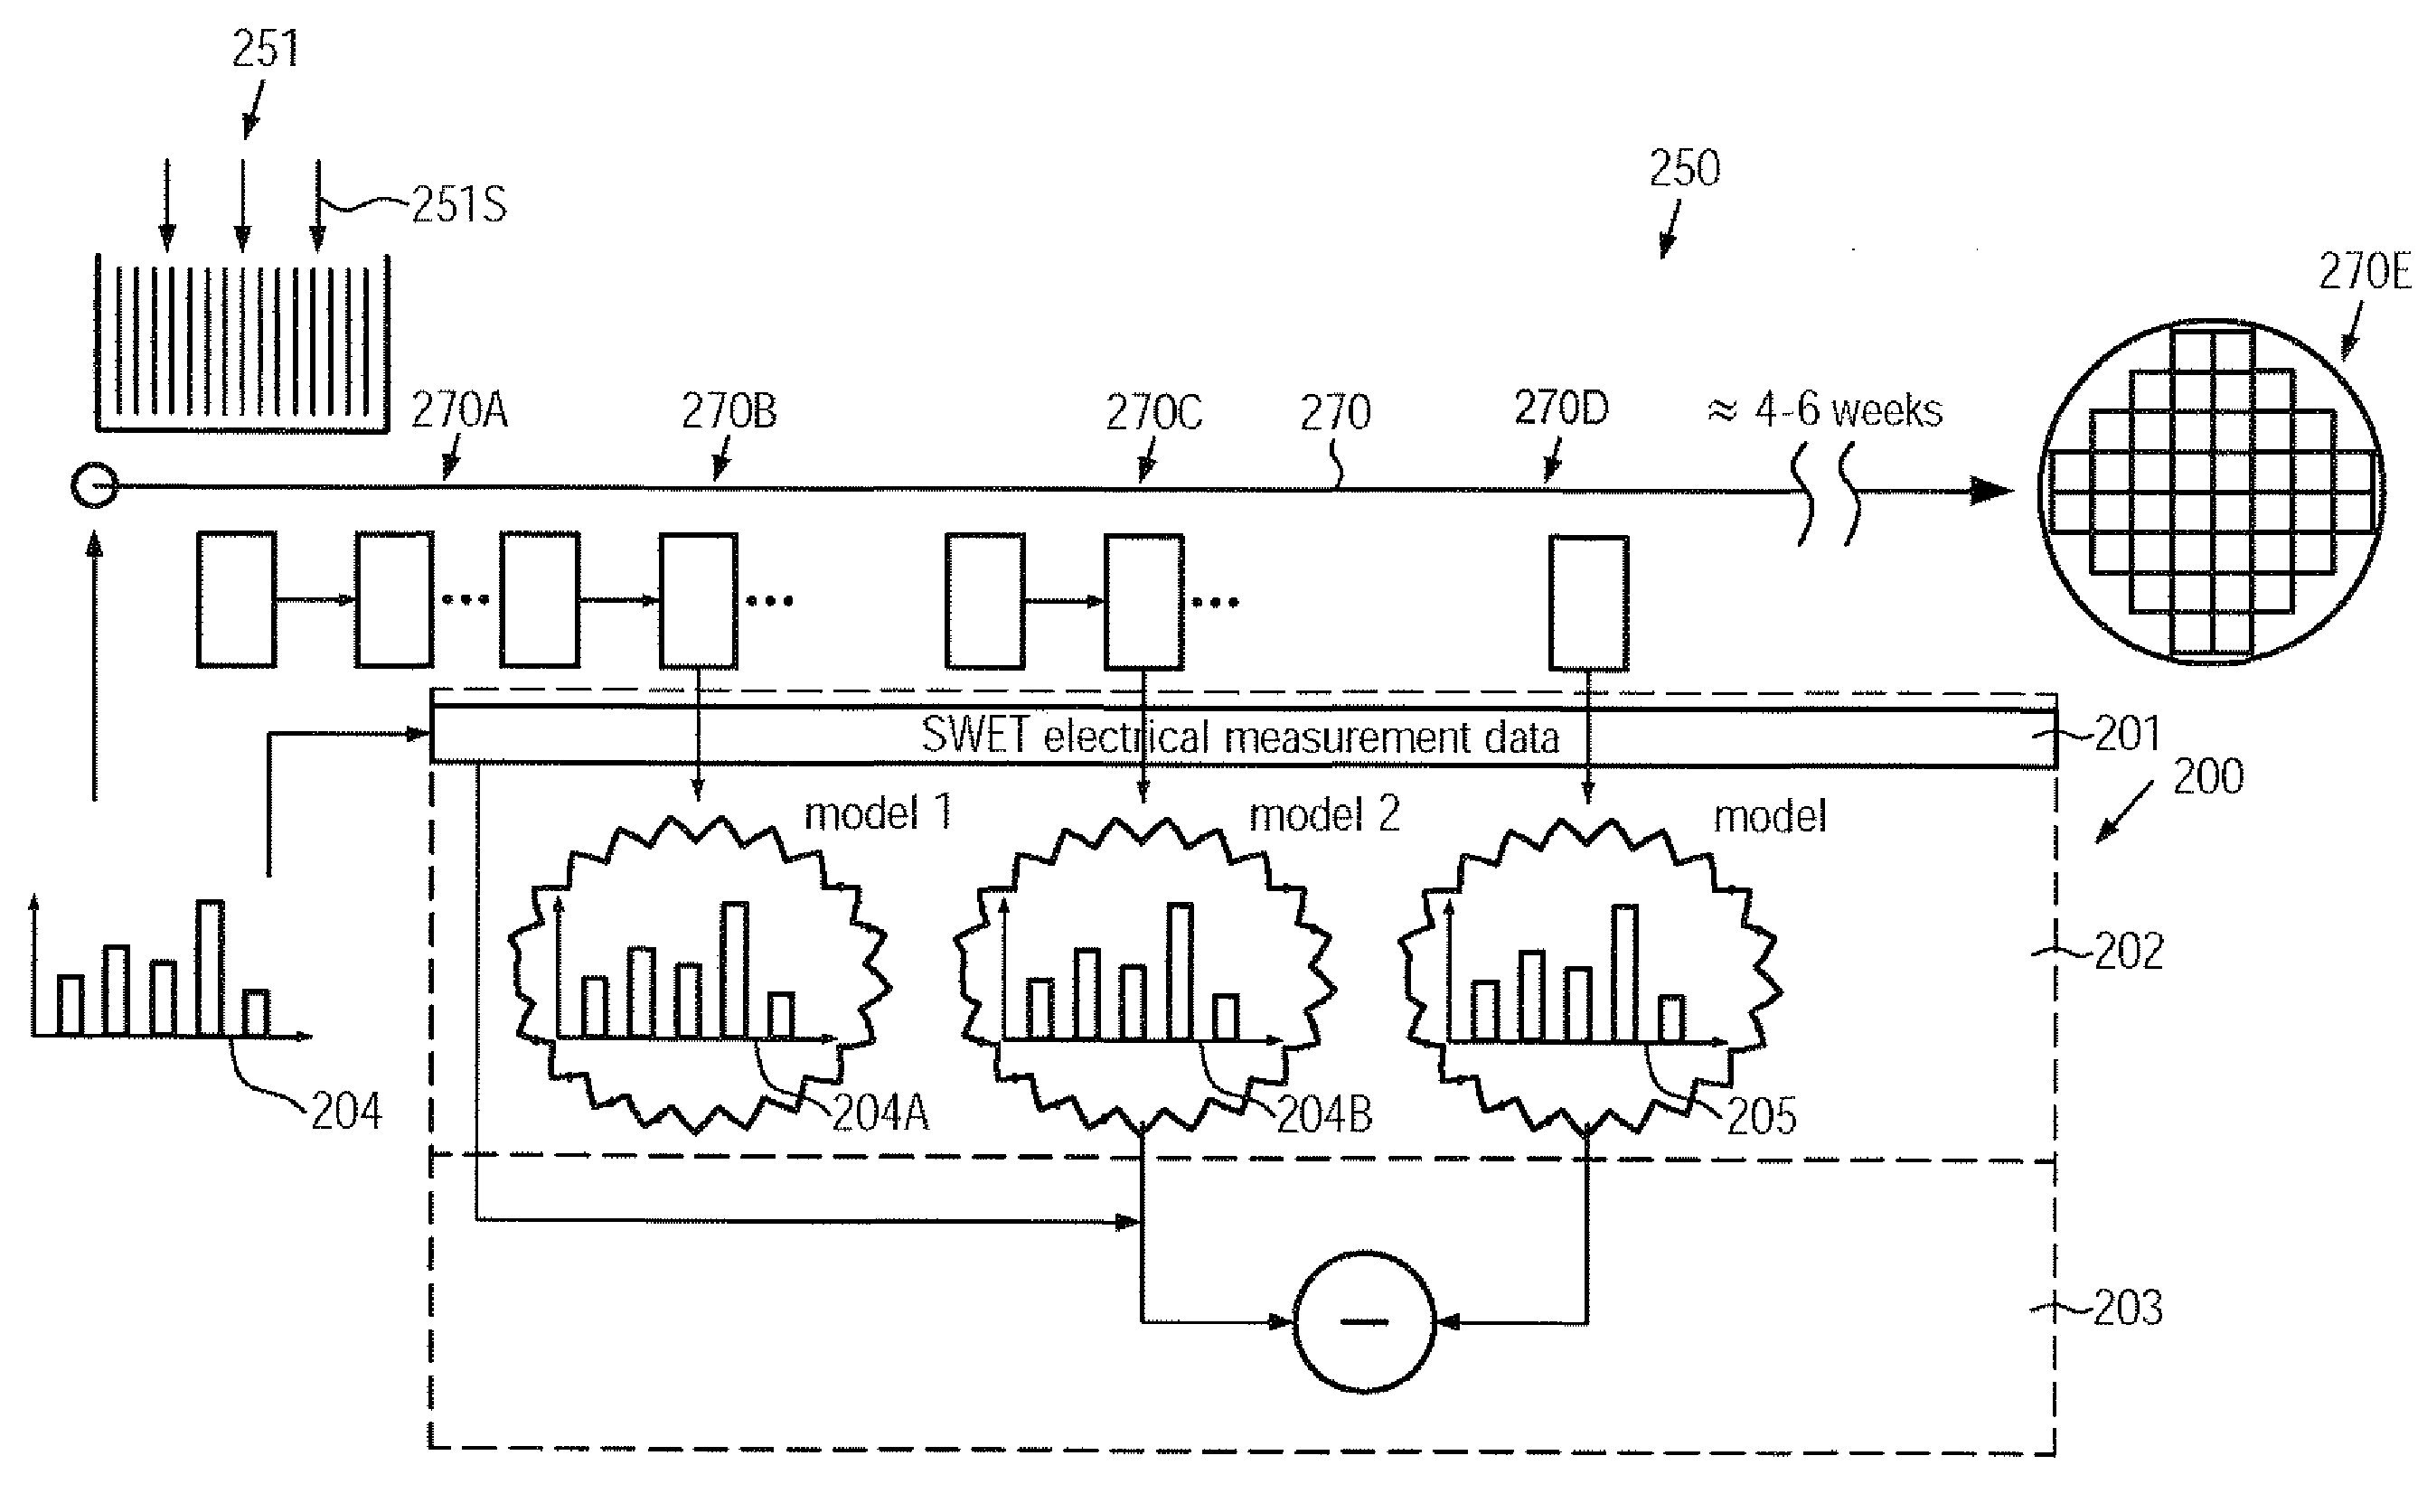
[0038]FIG. 2a schematically illustrates a manufacturing environment 250, which may comprise a plurality of manufacturing processes 270A, 270B, 270C, 270D including actual production processes and metrology processes. As previously explained with reference to the environment 150, the manufacturing processes, depending on the overall configuration of the facility under consideration, may be divided into functional entities or process modules, each of which may perform at least one production process, possibly in combination with “assisted” processes, such as cleaning and the like, wherein at least some of the corresponding functional groups may be associated with a respective metrology process, as previously explained. It should be appreciated, however, that the principles disclosed herein should not be considered as being restricted to any functional grouping of the manufacturing processes 270A, 270B, 270C, 270D. In the embodiment shown, the process 270D may represent a metrology process for generating electrical measurement data, which may include any desired electrical parameters, as previously explained. In one illustrative embodiment, the process 270D may represent a wafer electrical test process for performing test procedures as may also be performed on each of the semiconductor devices under consideration at a later manufacturing stage, however only for selected sample substrates. In other cases, the electrical measurement data 270D may comprise an intermediate electrical measurement data, which may be obtained during a respective manufacturing flow 270. Furthermore, the manufacturing environment 250 may comprise a manufacturing process and related process tools 270E for performing a final electrical test for each individual substrate and each individual semiconductor device formed thereon. It should be appreciated that the process 270E may, in some illustrative embodiments, not be a part of the manufacturing flow 270 and may even be performed in a different manufacturing environment, depending on the overall company-specific strategy. Furthermore, the manufacturing environment 250 may comprise a data processing system 200 that is configured to monitor the dynamic behavior of the environment 250 with respect to the occurrence of disturbances, as explained above. For this purpose, the system 200 may comprise an interface 201 that is configured to receive at least the electrical measurement data from the module 270D, which may be accomplished on the basis of any appropriate data link so as to directly connect to the module 270D or the interface 201 may be connected to a supervising control system of the environment 250, as previously explained. Moreover, the interface 201 may receive data representing a predicted quality distribution 204, which may represent the variation between a die and an expected metric for indicating the probability or the number of semiconductor devices obtained from the specific die position with respect to a predefined quality specification.
[0039]In some illustrative embodiments, the predicted quality distribution 204 may be provided by a supervising control system, which may be configured to control the overall supply of products, the selection and adaptation of process recipes for the respective process tools and the like, as previously explained. Furthermore, the system 200 may comprise a yield prediction unit 202 that is operatively connected to the interface 201 so as to receive therefrom the electrical measurement data in any appropriate format. The yield prediction unit 202 may be configured to operate on the electrical measurement data, also indicated as SWET data, on the basis of a model, which is implemented in the unit 202 and establishes a mechanism in which a new or updated quality distribution 205 may be created. That is, the unit 202 may comprise a mechanism for mapping the electrical measurement data SWET on a respective distribution 205, which may be accomplished by defining a respective transformation, which in turn may be determined on the basis of historic measurement data obtained from the module 270E and historical electrical measurement data obtained from previously processed substrates. For this purpose, for instance, any appropriate regression technique may be used, for instance least squares regression and the like. During a corresponding process for determining an appropriate model, well-established data processing techniques may be used in which appropriate coefficients for a respective transformation may be determined, which maps the independent variables, that is, the electrical measurement data SWET, to the dependent variables, i.e., the various yield metrics for the individual die grades. Due to the high degree of reliability of the electrical measurement data, the corresponding quality distribution 205 may be considered as a moderately robust representation of the quality distribution of a group of products, although only selected samples may have been used for obtaining the electrical measurement data.
[0040]Furthermore, the system 200 may comprise an evaluation unit 203, which may be connected to the unit 202 and the interface 201 so as to receive data corresponding to the quality distribution 205 established by the unit 202 and at least one quality distribution 204 that is based on any production relevant information except for the electrical measurement data SWET. The evaluation unit 203 may be configured to compare the predicted quality distributions 204 and 205 to identify a pronounced difference of these two distributions. For example, a predefined criterion may be implemented in the unit 203 for estimating the degree of difference between the distributions 204, 205, for instance in the form of a threshold, wherein exceeding the threshold may indicate a disturbance in the environment 250. For instance, respective threshold values may be defined and implemented in the unit 203 with respect to a desired statistical criterion in order to automatically detect a significant change, which may then be subjected to further data analysis, if required. For instance, the summed square error of both distributions 204, 205 may be used as an efficient statistical criterion for monitoring the dynamic behavior of the environment 250. For instance, a specified threshold may be defined which, when exceeded, may indicate a disturbance or at least a status of the environment 250, which may require further investigation.
[0041]During a production phase of the environment 250, a group of substrates 251, which may typically also be referred to as a lot, may be entered into the environment 250, wherein it should be appreciated that typically respective schedules may be associated with the group 251 in accordance with the overall policy for managing the environment 250. Also, other groups of products (not shown) may already be in production so that a substantially continuous stream of products may enter the environment 250 and may also leave the environment 250, thereby defining the overall throughput. As previously explained, in some illustrative embodiments, at least some of the groups 251 to be processed or being processed in the environment 250 may be associated with a predicted quality distribution, such as an initial distribution 204, which may be established on the basis of any default values, such as a mean quality distribution obtained from measurement data of the station 270E, as previously discussed. For this purpose, in some illustrative embodiments, a respective distribution for a specific number of die locations, i.e., die grades, may be established for one or more quality levels. For example, a respective graded quality distribution may be used in which fully operational semiconductor devices with the highest quality level may be taken into consideration for at least a plurality of die locations or all die locations across a substrate. During the processing of the group 251, in one or more of the process sequences or modules 270A, 270B, 270C, selected sample substrates 251S may be subjected to measurement procedures, thereby creating respective production-related measurement data, as previously explained. Thus, in some illustrative embodiments, the initial or default predicted quality distribution 204 may be updated on the basis of the corresponding production-related measurement data in order to obtain an updated quality distribution 204A. In the embodiment shown in FIG. 2a, it may be assumed that the process module 270B may create corresponding production-related measurement data, which may then be mapped into the distribution 204, which may be accomplished by the appropriate model, as previously discussed. The updated quality distribution 204A may be established at any appropriate component of the environment 250, for instance in a supervising control system having access to the production-related measurement data, in the module 270B itself and the like. In some illustrative embodiments, the production-related measurement data may be transmitted to the unit 202 via the interface 201 and the unit 202 may have implemented therein or may be configured to retrieve an appropriate model from a corresponding database (not shown) in order to obtain the updated quality distribution 204A. Similarly, during the further processing of the group 251, further production-related measurement data may be created, as is, for instance, shown with respect to the module 270C, thereby creating a further updated version 204B, thereby increasing the “incorporated” production-relevant information about the environment 250 into the most recent predicted distribution 204B. Also, in this case, the distribution 204B may be created by any appropriate component, for instance in the unit 202, as is also explained with reference to the distribution 204A. Similarly, further updated versions of the distribution 204 may be established, wherein each version may be based on the previous updated distribution. Thus, the most recent distribution 204B and the distribution 205 may be supplied to the evaluation unit 203 and may be compared, as previously explained, in order to monitor the dynamic behavior of the environment 250 with respect to disturbances, as previously explained.
[0042]FIG. 2b schematically illustrates a situation for substantially matching distributions 204B and 205, indicated as Case 1, wherein, for instance, a summed square error for the distribution 204B representing the state immediately prior to the process module 270D, i.e., the “SWET” station, and the distribution 205 may be moderately small, thereby indicating a high degree of consistency between both predicted quality distributions. On the other hand, in Case 2, both distributions 204B, 205 may have a significant deviation, as indicated by the moderately high error value, thereby indicating a disturbance. Consequently, the unit 203 may automatically detect disturbance situations by evaluating the distributions 204B, 205.
[0043]FIG. 2c schematically illustrates a diagram in which the dynamic behavior of the manufacturing environment 250 may be represented by the corresponding deviations between respective predicted distributions 204B and 205, as previously explained. In FIG. 2c, the horizontal axis represents the point in time of obtaining corresponding SWET measurement data for groups of products after passing the plurality of manufacturing processes 270A, 270B, 270c. The vertical axis represents the deviation associated with the corresponding groups of products. As illustrated, most of the deviations, for instance measured in the form of the summed square errors of the distributions 204B, 205, may be within a range between 0 and 0.2, while other values may indicate a more pronounced deviation. For example, a threshold may be defined so as to identify corresponding deviation values, which may represent possible factory disturbances, while, in other cases, additional data analysis techniques may be used for identifying significant changes in the dynamic behavior of the environment 250.
[0044]FIG. 2d schematically illustrates a diagram which may provide a more detailed view of a respective portion of the diagram of FIG. 2c in order to identify a pronounced change of the dynamic behavior. Also, in this case, the horizontal axis represents the point in time of obtaining the SWET data, while the vertical axis represents the degree of deviation of the corresponding distributions 204B, 205. In this case, a data processing mechanism may be implemented in the unit 202 to monitor an averaged time variation of the respective deviation values. For example, curve A may represent the time progression of the average deviations for each point in time so as to identify a pronounced change of the behavior of the environment 250. For example, as is illustrated, A1 may represent a portion of curve A at which a pronounced increase of the average deviation may occur, thereby more clearly indicating a disturbance of the environment 250.
[0045]FIG. 2e schematically illustrates a diagram representing a further example of a data manipulation mechanism, which may be used for monitoring the dynamic behavior of the environment 250. In the mechanism shown, a cumulative prediction error may be monitored for each or at least a plurality of different die grades, for instance with respect to the groups of products 251 that have been most recently processed in the environment 250. In the example shown, the final 86 groups are taken into consideration, thereby providing an efficient technique for monitoring the overall behavior of the environment 250. For instance, in FIG. 2e, the cumulative error for four die grades, indicated as bin 71, bin 73, bin 80, bin 82, are illustrated and are represented by curves A, B, C, D, respectively. As is evident from FIG. 2e, curve A may exhibit a pronounced increase after adding the respective prediction error of approximately 70 groups thereby indicating an “under prediction” of the respective die grade. Similarly, curve B, representing the die grade 73, may exhibit a significant change in its behavior, also at approximately 70, thereby indicating a certain degree of “over prediction” for this die grade. On the other hand, curves C and D may exhibit a substantially “steady” behavior thereby indicating a substantially stable prediction behavior of the corresponding die grades. Hence, also in this case, a corresponding disturbance may be detected in a highly efficient manner.
[0046]FIG. 2f schematically illustrates a further mechanism for analyzing “suspicious” candidates with respect to disturbances. For example, as shown, a respective candidate, indicated as E, of the distribution as shown in FIG. 2d may be selected for further analysis, which may be accomplished by explicitly referring to the corresponding distributions 204B, 205, wherein, for further analysis, the corresponding electrical measurement data may be retrieved, at least for the distribution 205, which has been established on the basis of the electrical measurement data. For the distribution 204B, the respective models' electrical data may be used. Upon further analysis, the measurement data for obtaining the distribution 204B may be retrieved, for instance by requesting the data from a supervising control system, when the corresponding distribution 204B may not have been established in the unit 202, as previously described. Consequently, by appropriately going back from the predicted distribution, a desired degree of “resolution” may be obtained in view of analyzing the “disturbance” situation represented by the candidate E. Consequently, a highly efficient and automatic monitoring system may be established, wherein any disturbances may be efficiently identified while, if required, appropriate analysis techniques may be used for providing enhanced robustness in actually indicating a disturbance, as, for instance, described above with reference to FIGS. 2d-2f.
[0047]FIG. 2g schematically illustrates a portion of the system 200, according to illustrative embodiments, in which a model monitor 206 may be provided in combination with a model update unit 207. The model monitor 206 may receive the respective predicted distributions 205 from the unit 202 and may also receive actual quality distributions obtained on the basis of measurement data obtained from the station 207D. That is, the station 207E may produce electrical test data for each of the substrates produced in the environment 250, however, with a significant delay of, for instance, several weeks, so that the corresponding final quality distribution 208 may be established, which may also include the various different degrees of quality, such as different speed grades, storage capacity and the like. That is, the overall final distribution 208 may comprise, in addition to the quality level or levels used in the predicted quality distributions 204, 205, any intermediate quality level, thereby also containing the corresponding defective devices. Thus, from the distribution 208, the respective quality level may be extracted to obtain a final quality distribution 209, which may correspond to the distributions 204, 205. The respective data for the final quality distributions 209 may also be supplied to the model monitor 206, which may compare the distributions 205 with the distribution 209, in order to monitor the quality of the prediction of the models used for establishing the distribution 205. In some illustrative embodiments, the unit 207 may appropriately update the corresponding model upon detecting a significant deviation between the distributions 205 and 209. For this purpose, an appropriate adaptation of the corresponding transformation to the previously established transformation for a model may be modified on the basis of the degree of deviation, for which any appropriate data processing mechanism may be used.
[0048]FIG. 2h schematically illustrates a typical output of the model monitor 206. In FIG. 2h, the horizontal axis may represent the various die grades or die locations while the vertical axis represents a statistical metric of the deviation between the distributions 205 and 209, for instance in the form of a summed square error. As is illustrated, the corresponding deviation may be sufficiently small, thereby indicating a good match between the predicted distribution 205 and the actually measured distribution 209. Consequently, the model used for establishing the distribution 205 may reliably and in a robust manner reflect the “true” quality distribution, thereby also enabling a reliable and robust detection of factory disturbances.
[0049]As a result, the present disclosure provides an efficient system and technique for monitoring the dynamic behavior of a complex manufacturing environment with respect to the occurrence of disturbances by monitoring a change in the predicted quality distribution, thereby providing enhanced performance with respect to speed and accuracy in identifying factory disturbances compared to conventional strategies. By using a graded die forecast, it may no longer be necessary to track multiple electrical measurement parameters, which may lead to false alarms or missed signals, as previously explained. Furthermore, the occurrence of a factory disturbance may be automatically indicated with low delay with respect to critical manufacturing processes, thereby reducing the potential for inappropriate processing of substrates, which may result in increased overall yield while additionally providing enhanced flexibility in responding to external and internal demands.
[0050]The particular embodiments disclosed above are illustrative only, as the invention may be modified and practiced in different but equivalent manners apparent to those skilled in the art having the benefit of the teachings herein. For example, the process steps set forth above may be performed in a different order. Furthermore, no limitations are intended to the details of construction or design herein shown, other than as described in the claims below. It is therefore evident that the particular embodiments disclosed above may be altered or modified and all such variations are considered within the scope and spirit of the invention. Accordingly, the protection sought herein is as set forth in the claims below.
Login to view more PUM


Description & Claims & Application Information
We can also present the details of the Description, Claims and Application information to help users get a comprehensive understanding of the technical details of the patent, such as background art, summary of invention, brief description of drawings, description of embodiments, and other original content. On the other hand, users can also determine the specific scope of protection of the technology through the list of claims; as well as understand the changes in the life cycle of the technology with the presentation of the patent timeline. Login to view more.
Login to view more Similar technology patents
Aggregation handling
ActiveUS10318446B2Reduce response timeEfficiently solveProgram controlReal-time computingMethod access
Owner:IBM CORP
Liquid crystal panel, liquid crystal display device and method for improving liquid crystal rotation obstacle
ActiveUS20180217419A1Reduce response timeImprovement of switchNon-linear opticsBody regionLiquid-crystal display
Owner:WUHAN CHINA STAR OPTOELECTRONICS TECH CO LTD
Read-ahead on signed connections with unsigning, inline, transparent proxies
Owner:SONICWALL US HLDG INC
Electric field effect read/write head, method of manufacturing the same, and electric field effect storage apparatus having the same
InactiveUS20090002554A1Reduce response timeStatic indicating devicesDifferential synchronisation source lockingElectric fieldFrame rate
Owner:SAMSUNG ELECTRONICS CO LTD
Optical touch panel device and recording medium
InactiveUS20150097813A1Control power consumptionReduce response timeInput/output processes for data processingOptical pathTouch panel
Owner:SHARP KK
Classification and recommendation of technical efficacy words
- Reduce response time
- Reduce delay
Incremental erasing of flash memory to improve system performance
InactiveUS20060053247A1Reduce response timeRead-only memoriesMemory systemsMemory controllerFlash memory controller
Owner:TEXAS INSTR INC
LCD overdrive table triangular interpolation
Owner:GENESIS MICROCHIP
Systems and methods for reporter-based filtering of electronic communications and messages
ActiveUS20100011071A1Reduce response timeMathematical modelsMultiple digital computer combinationsElectronic communicationComputer security
Owner:YAHOO ASSETS LLC
Electronic Thermometer with Selectable Modes
ActiveUS20080112461A1Reduce response timeIncrease precisionRadiation pyrometryThermometers using electric/magnetic elementsOperation modePrediction algorithms
Owner:CARDINAL HEALTH IRELAND UNLTD
Dynamically selecting either frame rate conversion (FRC) or pixel overdrive in an LCD panel based display
ActiveUS20050162367A1Reduce response timeHigh qualityTelevision system detailsColor signal processing circuitsLiquid-crystal displayFrame rate
Owner:GENESIS MICROCHIP
Methods and apparatus for resource management in a multi-carrier telecommunications system
ActiveUS20100285809A1Reduce handover latencyReduce delayTransmission path divisionAssess restrictionCarrier signalResource management
Owner:TELEFON AB LM ERICSSON (PUBL)
System and method for takeover of partner resources in conjunction with coredump
Owner:NETWORK APPLIANCE INC
Method and apparatus for hybrid automatic repeat request
InactiveUS20090313518A1Improve correction ratioReduce delayError prevention/detection by using return channelTransmission systemsData transmissionTime delays
Owner:ALCATEL LUCENT SAS
Vending distribution system
InactiveUS20080058985A1Reduce delayReduce handlingAcutation objectsApparatus for meter-controlled dispensingDistribution systemEngineering
Owner:ALCOV NICHOLAS