Method for classifying and counting bacteria in body fluids

a technology of hematology analyzer and hematology sample, which is applied in the field of classifying and counting white blood cells, erythroblasts, bacteria in body fluids by means of an automated hematology analyzer, can solve the problem that most hematology analyzers are not capable of distinguishing signals generated by bacteria from other components of a sample of body fluid

Inactive Publication Date: 2010-01-28
ABBOTT LAB INC
View PDF13 Cites 19 Cited by
  • Summary
  • Abstract
  • Description
  • Claims
  • Application Information

AI Technical Summary

Benefits of technology

[0009]It has been discovered that the signatures of erythroblasts from certain automated hematology analyzers, such as, for example, the CELL-DYN® 4000 automated hematology analyzer and the CELL-DYN® Sapphire™ automated hematology analyzer, are readily distinguishable from the signatures of bacteria, i.e., bacterial cells scatter light and fluoresce differently than do red blood cells, white blood cells, erythroblast nuclei, and platelets. The CELL-DYN® Sapphire™ automated hematology analyzer, as well as the CELL-DYN® 4000 automated hematology analyzer, both of which are commercially available from Abbott Laboratories, are equipped with an optical bench that can measure multi-angle light scatter and fluorescence, as described in U.S. Pat. Nos. 5,631,165 and 5,939,326, both of which are incorpo...

Problems solved by technology

Most hematology analyzers are not capable of distinguishing signals generated by bacteria from other compo...

Method used


Image

  • Method for classifying and counting bacteria in body fluids
  • Method for classifying and counting bacteria in body fluids
  • Method for classifying and counting bacteria in body fluids

Examples


examples

[0083]Comparative Examples A, B, and C illustrate how cytograms resulting from the method described herein characterize white blood cells in an automated hematology analyzer described in U.S. Pat. Nos. 5,631,165; 5,656,499; and 5,939,326. Working Examples 1, 2, 3, 4, and 5 illustrate how cytograms resulting from the method described herein differentiate bacteria from white blood cells and count bacterial cells in an automated hematology analyzer described in U.S. Pat. Nos. 5,631,165; 5,656,499; and 5,939,326.

example 1

[0096]The same method and apparatus that were used in COMPARATIVE EXAMPLE A were used to carry out EXAMPLE 1.

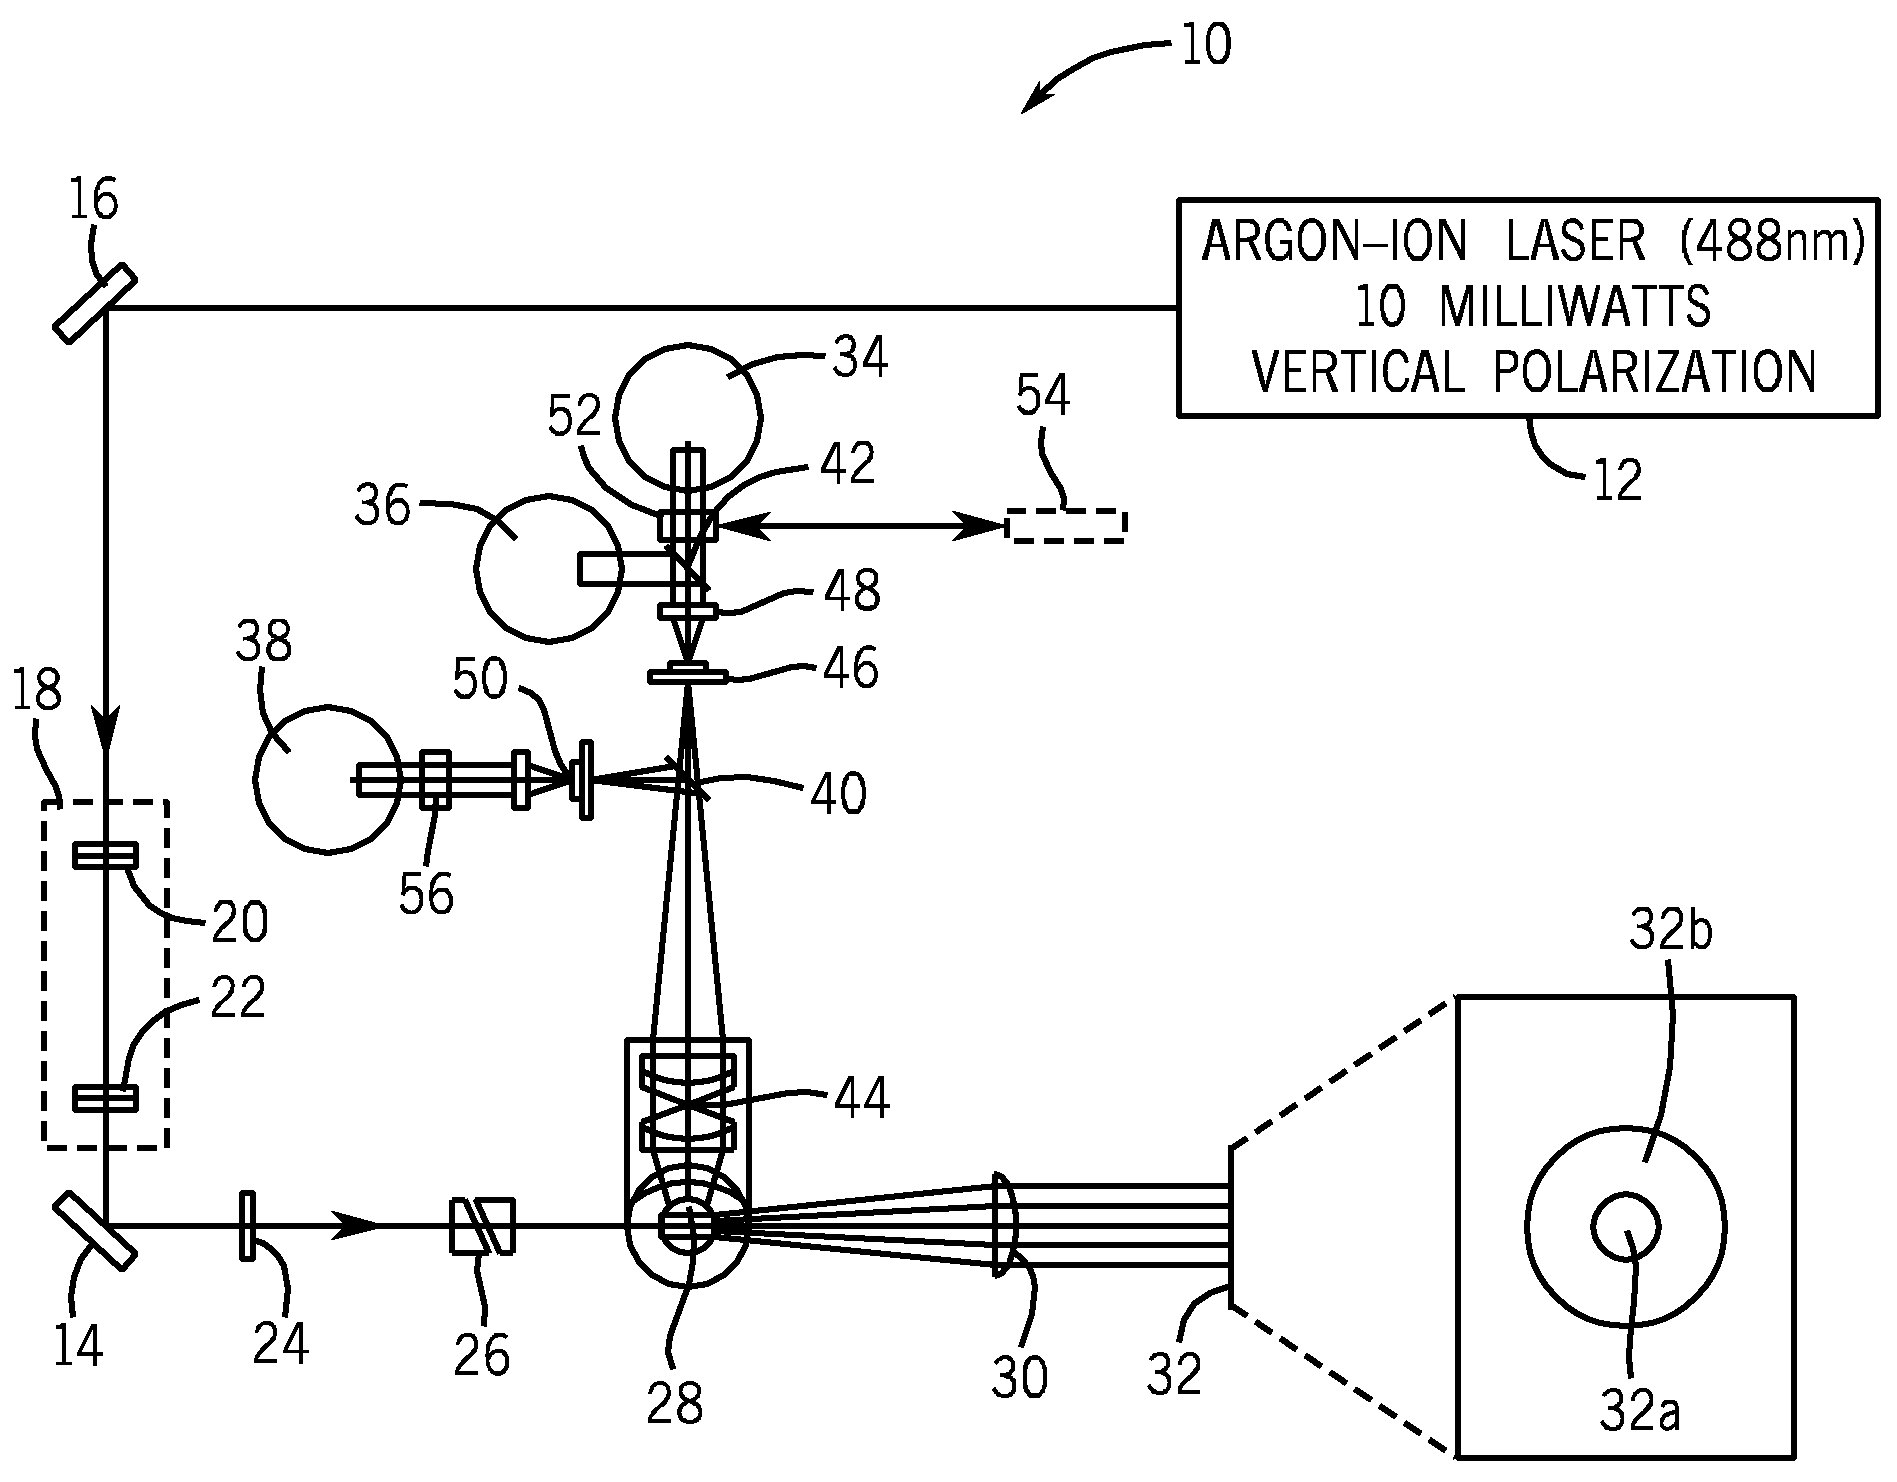
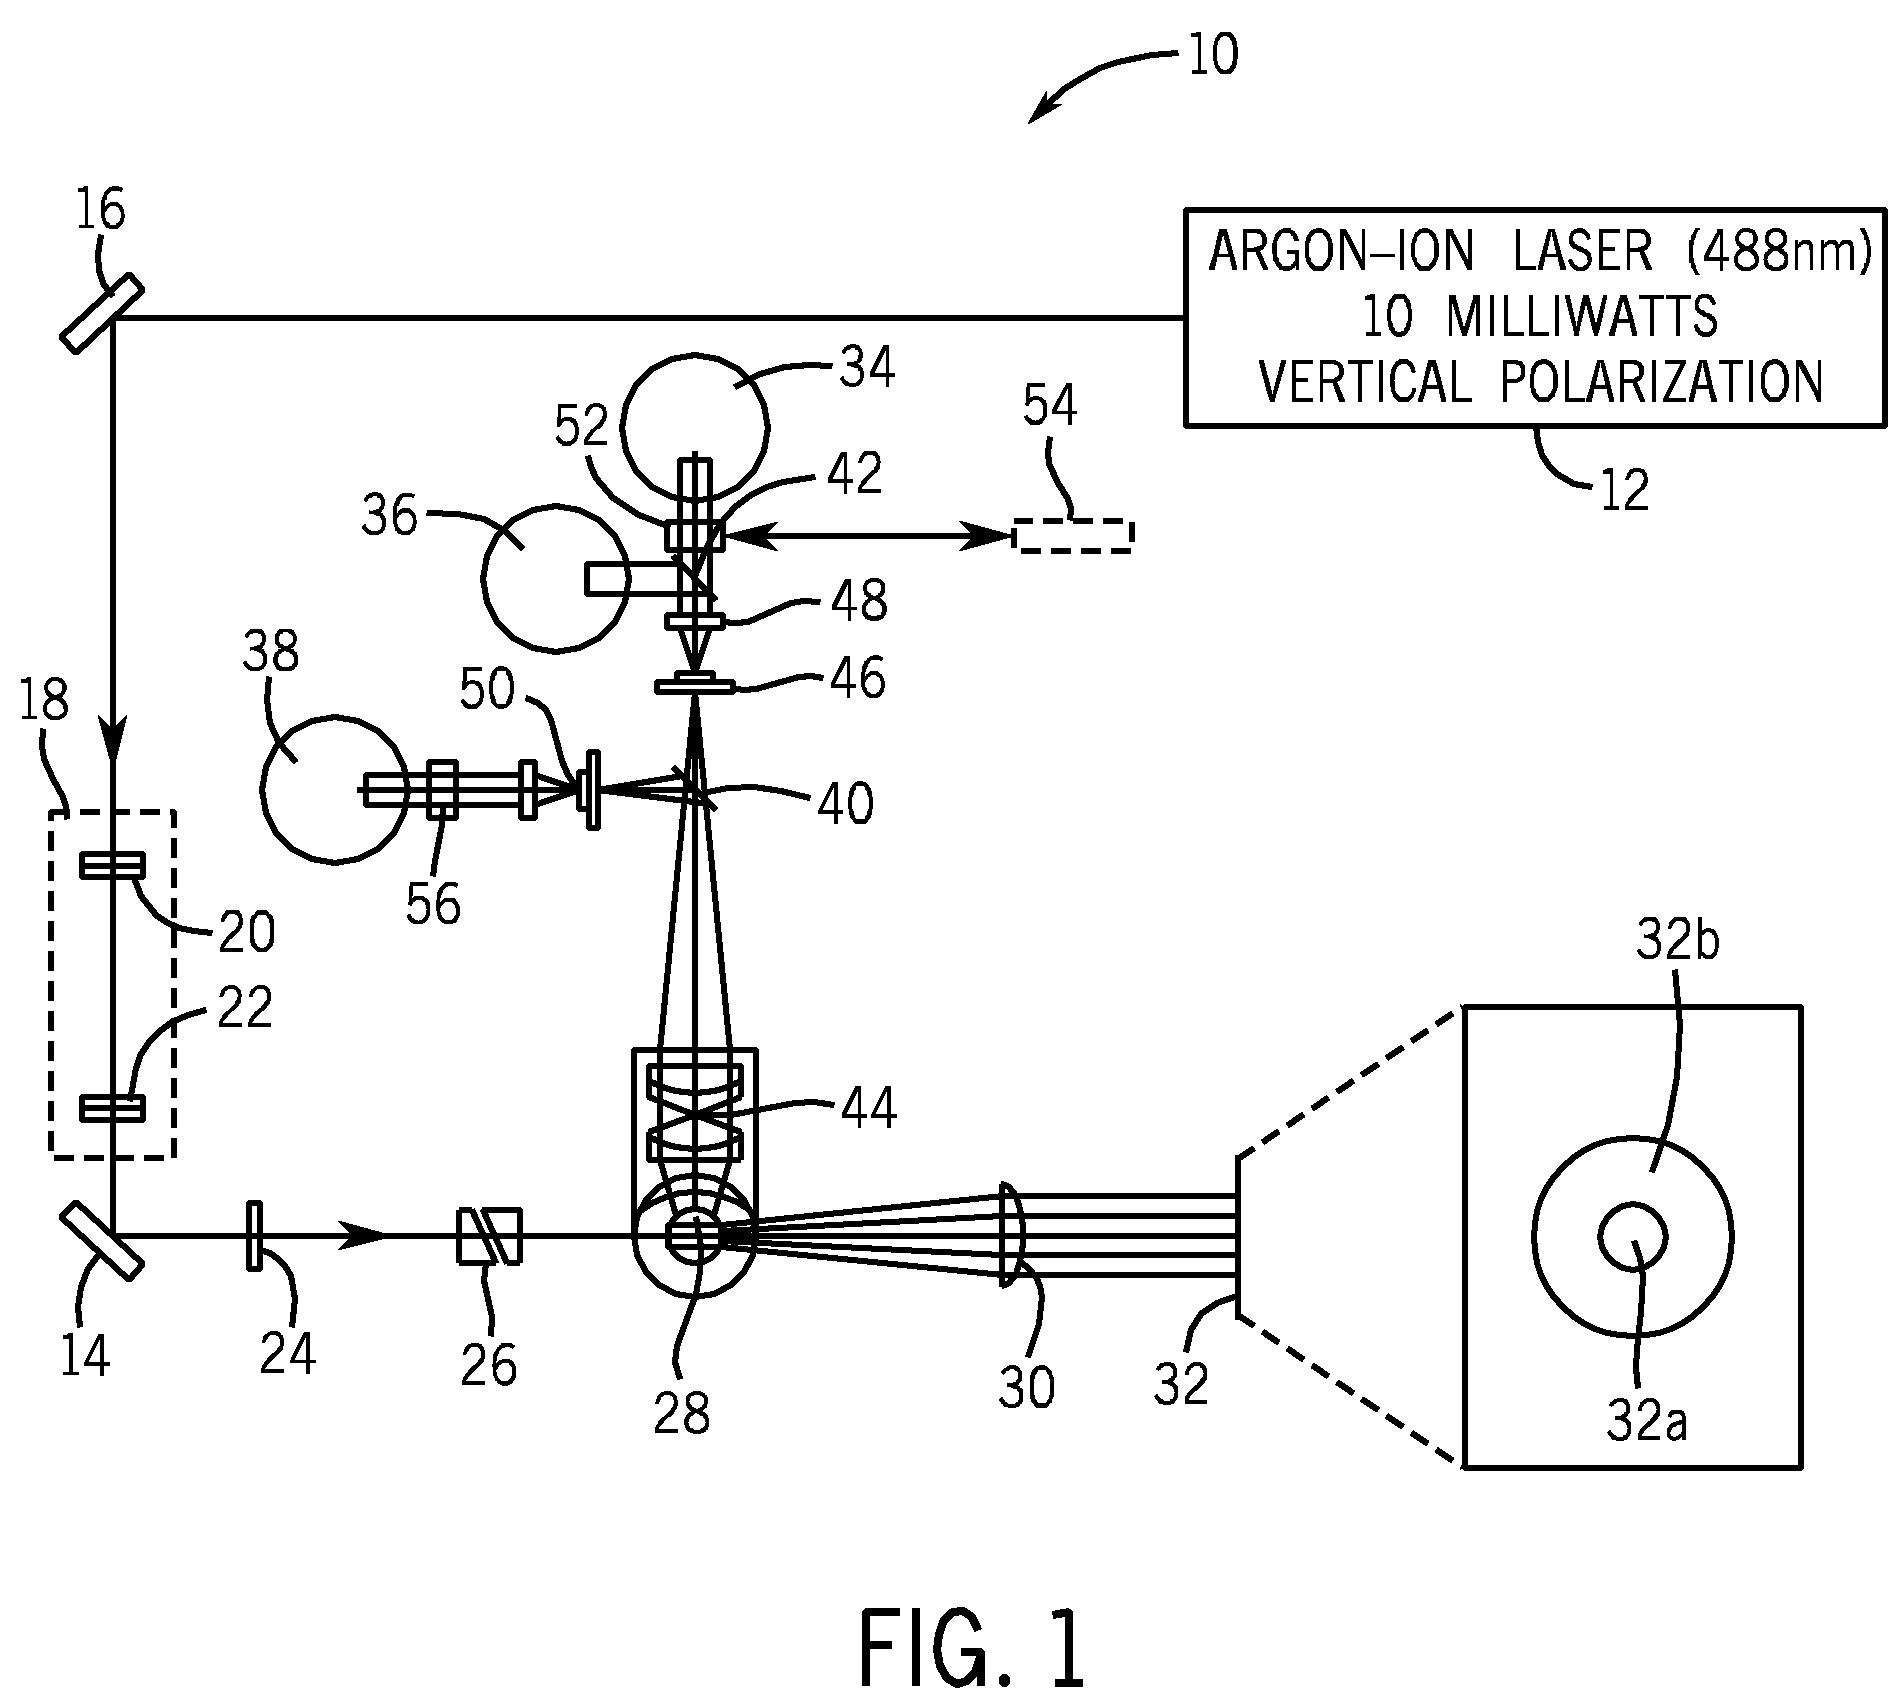
[0097]FIG. 6A is a cytogram of a clinical sample of cerebrospinal fluid (CSF), not suspected of carrying any infection, wherein the X-axis corresponds to IAS signals and the Y-axis corresponds to ALL signals, as measured by the apparatus depicted in FIGS. 1 and 2. FIG. 6B is a cytogram of a clinical sample of the same CSF as in FIG. 6A, except that the X-axis corresponds to FL3 signals and the Y-axis corresponds to ALL signals, as measured by the same apparatus depicted in FIGS. 1 and 2. FIG. 6C is a cytogram of a clinical sample of the same CSF as in FIG. 6A, except that the X-axis corresponds to ALL signals and the Y-axis corresponds to PSS signals, as measured by the apparatus depicted in FIGS. 1 and 2. FIG. 6D is a cytogram of a clinical sample of the same CSF as in FIG. 6A, except that the signals are from the PLT channel, wherein the X-axis corresponds to IAS signals an...

example 2

[0098]The same method and apparatus that were used in COMPARATIVE EXAMPLE A were used to carry out EXAMPLE 2.

[0099]FIG. 7A is a cytogram of a clinical sample of CSF from a 56-year old female patient having a diagnosis of meningococcal sepsis. The X-axis corresponds to IAS signals and the Y-axis corresponds to ALL signals, as measured by the apparatus depicted in FIGS. 1 and 2.

[0100]The sample contains white blood cells at a concentration of 5.06×10³ / μL, red blood cells at a concentration of 0.003×10⁶ / μL, neutrophils (86.8%), lymphocytes (5.4%), and monocytes (5.4%).

[0101]FIG. 7B is a cytogram of a clinical sample from the same CSF as in FIG. 7A, except that the X-axis corresponds to FL3 signals and the Y-axis corresponds to ALL signals, as measured by the apparatus depicted in FIGS. 1 and 2. The points in the circle below ALL channel 25 at far right corner of the cytogram in FIG. 7B correspond to bacterial cells, whose DNA is brightly stained by the reagent system, described in U.S....


PUM


Abstract

A method for distinguishing erythroblasts from bacteria by automated hematology analyzers, such as, for example, the CELL-DYN® 4000 automated hematology analyzer and the CELL-DYN® Sapphire™ automated hematology analyzer. Bacterial cells scatter light and fluoresce differently than do red blood cells, white blood cells, erythroblast nuclei, and platelets. Signals generated by bacteria are distinguishable from those of erythroblasts because the signals generated by erythroblast nuclei are sufficiently unique that erythroblast nuclei can be distinguished from signals generated by bacteria. Signals generated by platelets, lysed red blood cell ghosts, and other cell debris are blocked by the triple-trigger circuitry of the hematology analyzer, because all of the signals generated by noise are below the AND/OR thresholds. Algorithm(s) in the software of the system detect and count signals generated by bacteria by means of the location and the shape of the signals generated by bacteria and calculate the concentration of bacteria per unit of body fluid. In addition, certain body fluids, such as, for example, synovial fluid, can be pretreated with a viscosity reducing agent for a short period of time to reduce the viscosity of the body fluid prior to analyzing a sample of the body fluid by an automated hematology analyzer.

Description

BACKGROUND OF THE INVENTION[0001]1. Field of the Invention[0002]This invention relates to a method for classifying and counting white blood cells, erythroblasts, and bacteria in body fluids by means of an automated hematology analyzer. More particularly, this invention relates to a method for simultaneously differentiating and counting white blood cell populations, erythroblasts, and bacteria in body fluids by means of multi-angle light scatter, fluorescence, and triple triggering circuitry in a three-dimensional space.[0003]2. Discussion of the Art[0004]Examination of various body fluids is critical for the diagnosis of bacterial meningitis, bacterial pneumonia or lung abscess, infection of the peritoneal cavity, and septic arthritis. The conventional method of analyzing body fluids in order to determine the presence of a bacterial infection, which involves dilution of biological samples, counting cells by means of a hemocytometer, preparing cell cultures, Gram staining, and micros...

Claims


Application Information

Patent Timeline
IPC IPC(8): A01N1/02
CPCG01N15/147G01N33/5094G01N2015/0069G01N2015/1486G01N2015/008G01N2015/0084G01N2015/0073
Inventor KIM, YOUNG RANCOWART, WILLIE J.
Owner ABBOTT LAB INC
Why Eureka
Try Eureka