
Absolute PCR Quantification

a pcr and quantification technology, applied in the field of absolute pcr quantification, can solve the problems of low abundance targets, unreliable clinical diagnostics, and all known real-time pcr methods (and instruments) have not yet achieved the sensitivity, fidelity, reproducibility and resolution necessary levels,

Active Publication Date: 2010-06-03
THE RES FOUND OF STATE UNIVOF NEW YORK
View PDF25 Cites 11 Cited by
  • Summary
  • Abstract
  • Description
  • Claims
  • Application Information

AI Technical Summary

Benefits of technology

[0079].The term “detection” as used herein refers to quantitatively or qualitatively identifying an analyte (e.g., DNA, RNA or a protein) within a sample. The term “detection assay” as used herein refers to a kit, test, or procedure performed for the purpose of detecting an analyte nucleic acid within a sample. Detection assay

Problems solved by technology

However, its inherent wide variability of results (Reinhold et al., 2001, J. Clin. Onc. 19:1723) still makes it unreliable in clinical diagnostics.
The major drawback is that all known real-time PCR methods (and instruments) have not yet achieved the levels of sensitivity, fidelity, accuracy, reproducibility and resolution necessary for true absolute quantification of low abundance targets.
Moreover, new reagents, chemistries and instruments continuously introduced into the real-time PCR field make it increasingly difficult to compare results obtained in different laboratories and at different times (Bustin, 2002).
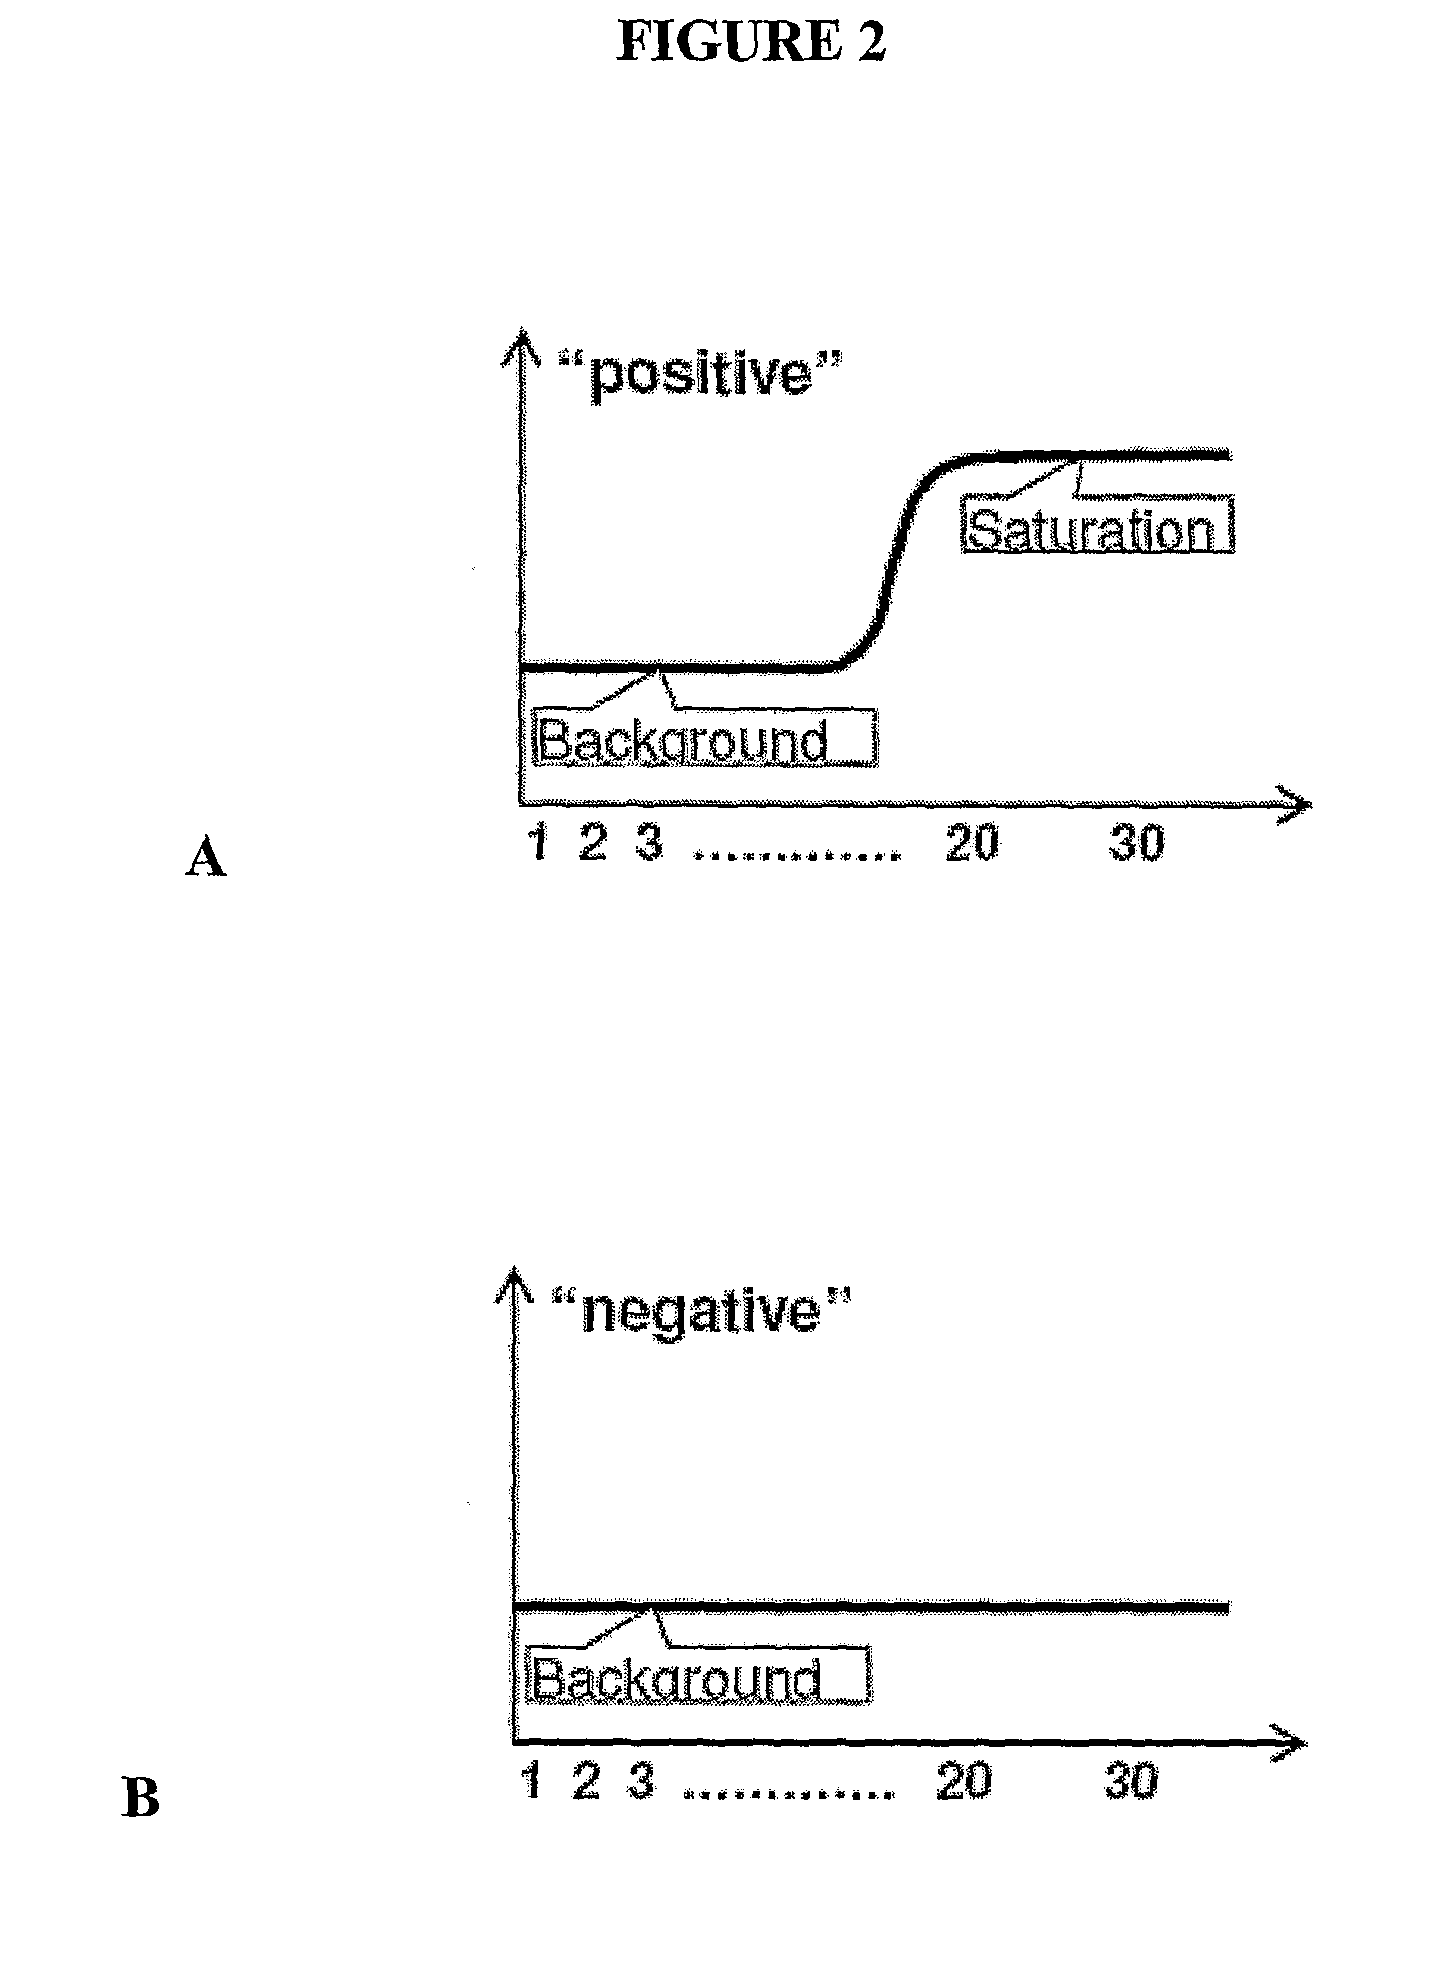
An inherent problem when using a calibration or standard curve is that the reaction saturates very quickly, and background fluorescence in the absence of amplification is typically very high.
This is because the level of noise associated with the background is higher than the useful signal generated by the PCR product on early cycles, which makes the PCR product effectively undetectable at the beginning of the reaction.
Although the objective is to identify a precise initial TCN, absolute quantification of the real-time PCR method has a principle flaw in that it is based on an external calibration.
Such validation is extremely difficult, even for ideal samples, let alone experimental and clinical samples from different laboratories and testing sites, different tissues, animals and patients.
In addition, clinical samples can vary widely in purity, making it very difficult to provide truly identical reaction conditions for both the purified control and the clinical sample.
However, clinical samples often contain contaminants and / or inhibitors that reduce the efficiency of the amplification reaction compared to the pristine samples used as calibrator templates.
In addition, inhibitors appear to have a stronger effect in the earlier cycles (they may degrade, e.g., by exposure to the extreme temperature of PCR, by the later cycles), which then results in underestimation of the copy number for a reaction.
Therefore, a large variety of enzymes, primers, and test samples, and the absence of acceptable validation and normalization procedures leads to poor reproducibility of data in different laboratories and raises serious doubts about how quantitative, reproducible or statistically informative real-time PCR is (e.g., Bustin 2002).
Therefore, the usefulness and reliability of using quantitative real-time PCR as a routine clinical diagnostic is questionable (Bustin 2000, 2002; Klein 2002; Pfaffl and Hageleit, 2001).
However, the statistics of particle distribution predicts that quantification of small numbers of molecules makes Ct data less reproducible due to stochastic effects (Rasmussen, R (2001) Quantification on the LightCycler.
21-34) which, in combination with all the other drawbacks as previously listed, makes quantification of the low abundance target even less reliable.
This by itself lowers the quantification accuracy and makes the method both time and labor consuming.
It has not become a routine quantitative method because, in order to collect statistics sufficient for accurate target quantification, it requires rather complicated sample handling and the detection of hundreds of separate PCR amplification reactions.
However, when calculations are performed on the data as described, mathematical analysis does not bear out the conclusions, i.e., absolute quantification of the sample template was not, in fact, realized.
As such, the lack of automated, reliable, absolute quantification in nucleic acid amplification methods is a huge obstacle for introducing these methods in clinical diagnostics where the problems are multiplied by, for example, variations in samples from different patients, sample collection conditions, and technical loading errors.
This variation makes it practically impossible to relate the results from, for example, different laboratories, methods, patients and tissues in terms of target copy number.
Consequently, it is impossible to establish databases originating from PCR results obtained in various studies and proves to be a critical impediment for utilizing real time PCR as a clinical tool.

Method used


Image

  • Absolute PCR Quantification
  • Absolute PCR Quantification
  • Absolute PCR Quantification

Examples


example 1

Multi-Capillary Arrays (MCAs) or Chips as PCR Vessels

[0153]The detection and absolute quantification of DNA samples will be performed during a real-time PCR amplification of the samples loaded into nano- or picoliter volume capillaries of disposable multi-capillary arrays (FIG. 7), or chips. Capillary electrophoresis will be used in the system that will help to increase the system sensitivity and specificity and to avoid false negative and false positive results.

[0154]The general view and the enlarged fragment of the MCA are shown in FIG. 7. The array can be divided into many PCR zones. The array in FIG. 7 shows 24 zones (approximately 3 mm long and 10 mm wide), although it is contemplated that MCA may comprise a single zone, or may comprise fewer or more than 24 zones. Each zone is a row of parallel nanoliter to picoliter capillaries, known as a sub-array. By way of example but not by way of limitation, a sub-arrays as described here contains 32 capillaries of 10 nl volume each (10...

example 2

PCR on Matrix Coated Substrates

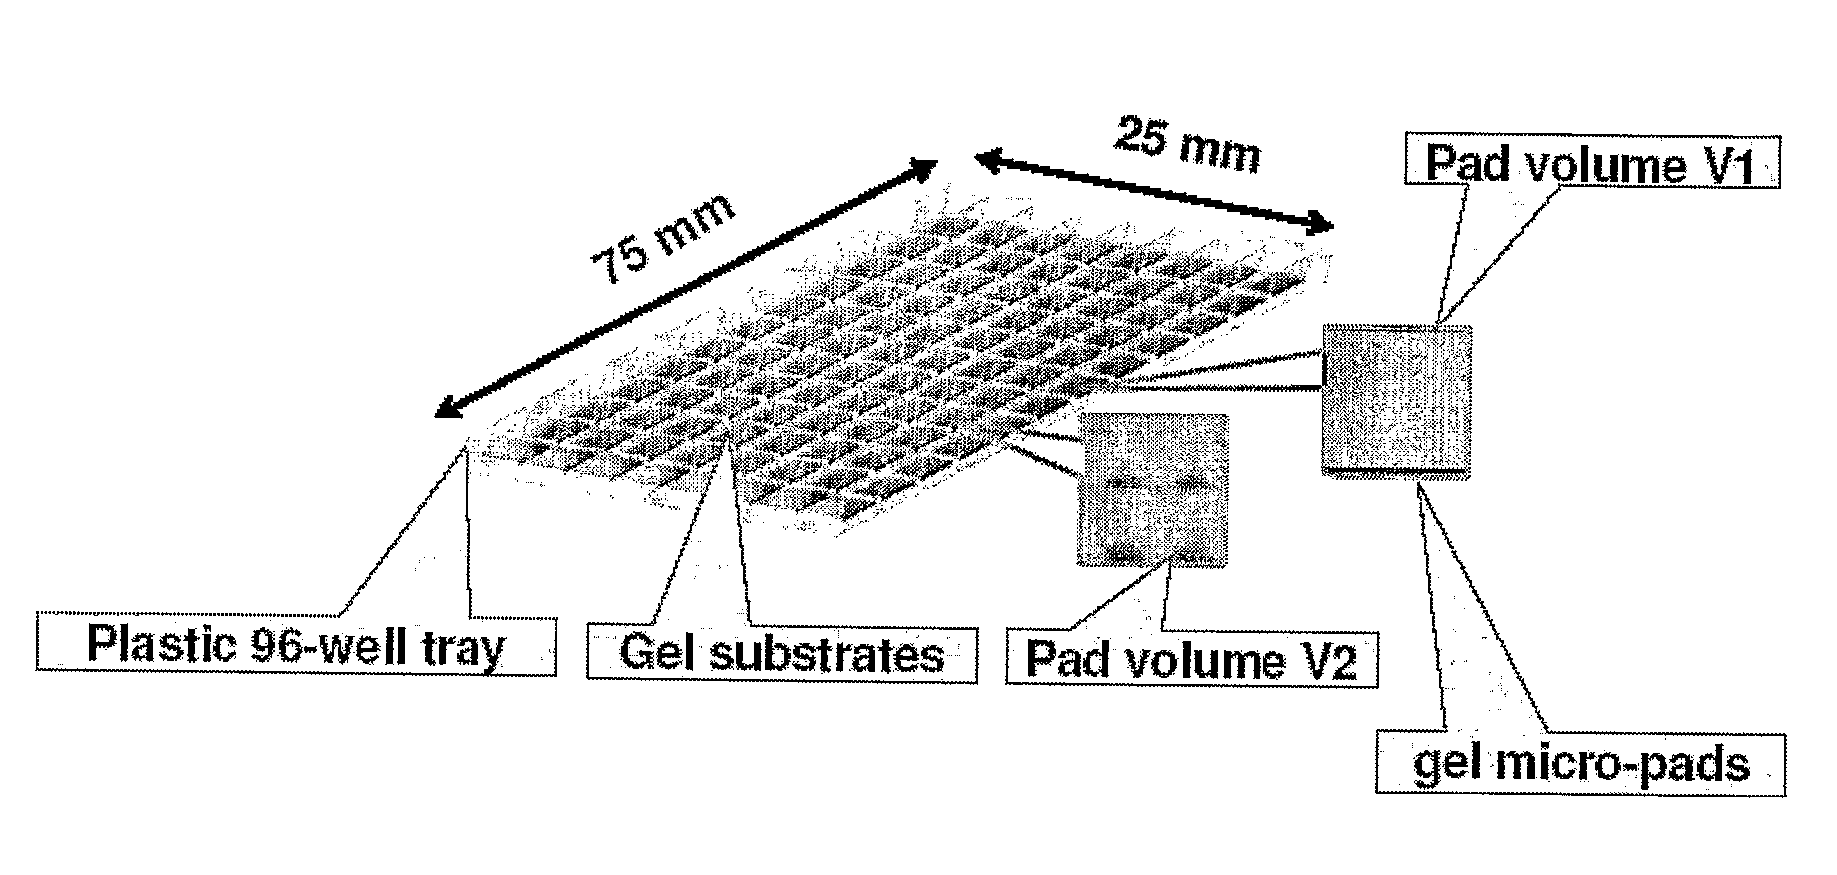
[0156]PCR can be performed in a disposable sample tray with arrays of gel micro-pads as depicted in FIG. 8. For example, serial dilutions of DNA samples in a PCR mix are made, aliquoted to a multi-well plate and covered with mineral oil in order to avoid the sample evaporation. The samples are then loaded from the plate into individual cells of the disposable sample tray with the gel pad arrays. The DNA samples are allowed to infuse into the gel pads. For example, the samples are allowed in infuse into the gel pads at 60° C. for 5-30 minutes. After infusion of the sample DNA into the gel pad, the pad is washed to remove any remaining sample. Mineral oil or another sealing compound is applied to the top of the gel pad to seal the PCR template and generated PCR products in the gel pad (Tillib et al., 2001, Anal. Biochem. 292:155). If a polymer is used to seal the gel pad, the polymer may be allowed to solidify before proceeding with PCR. PCR is carried o...

example 3

PCR in Water / Oil Emulsions

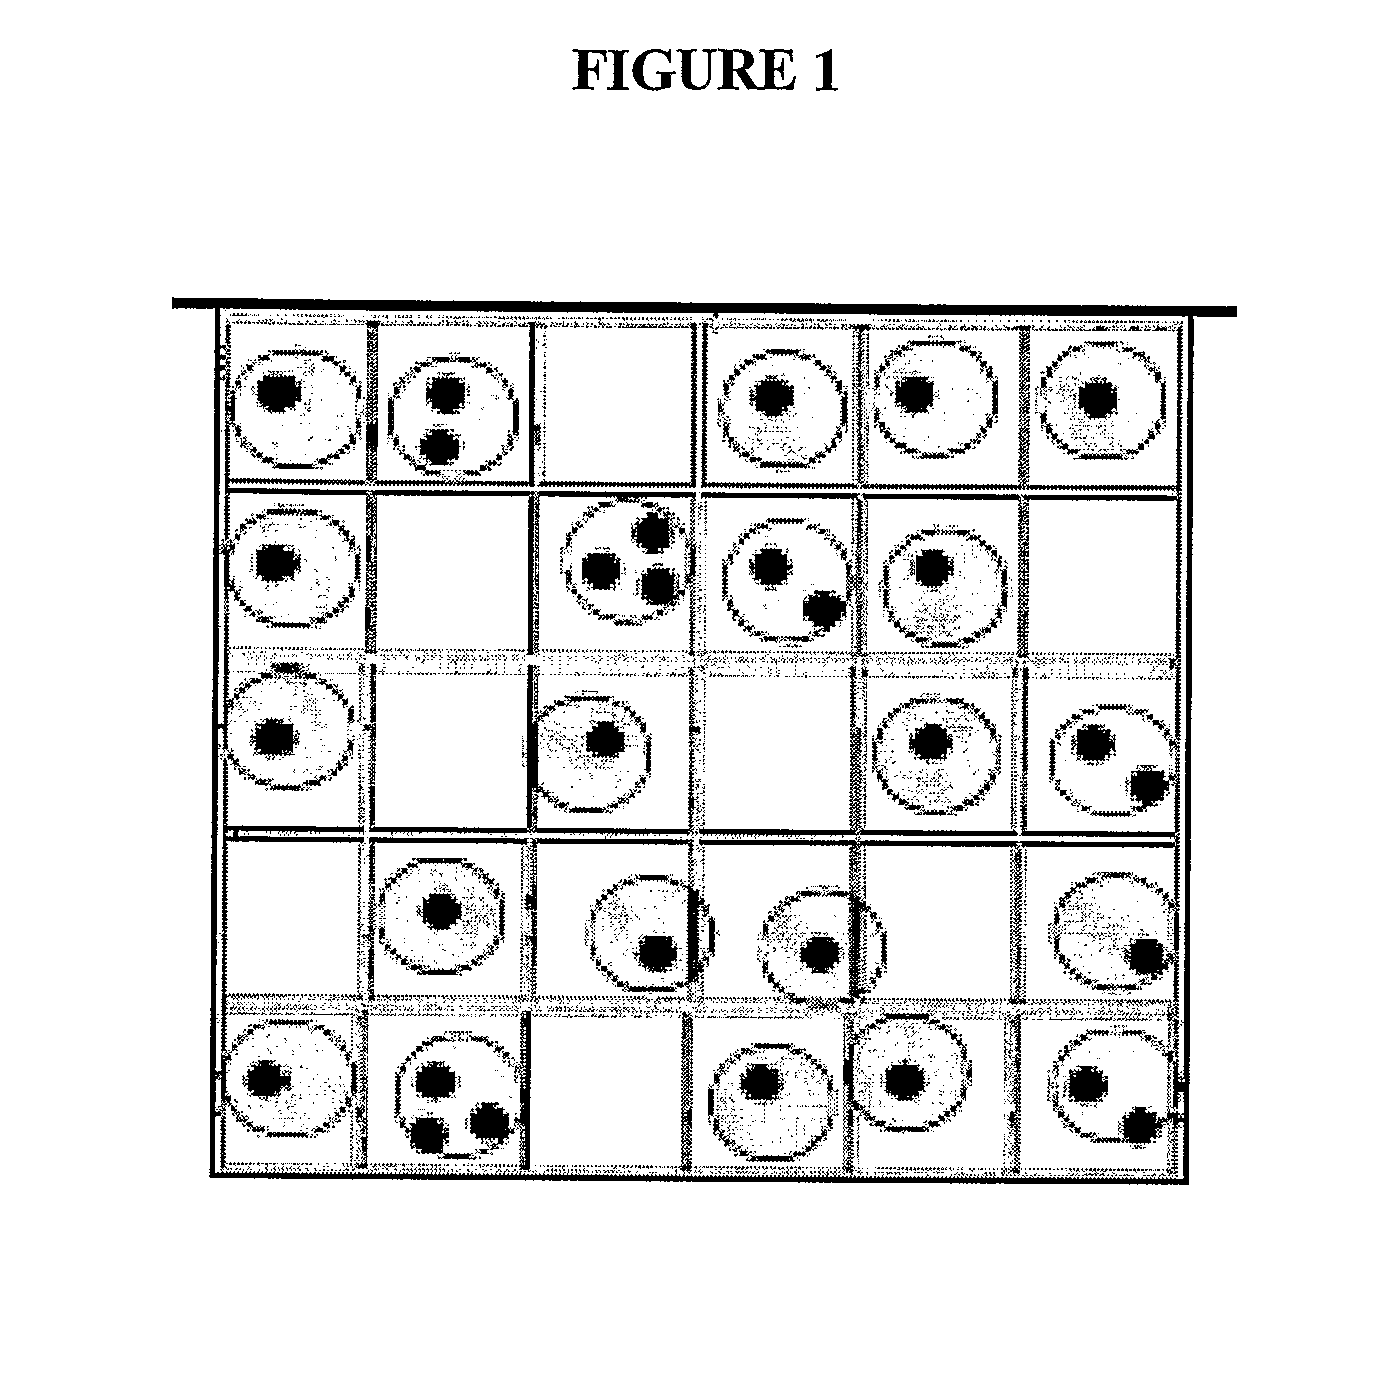
[0158]Serial dilutions of a DNA sample in PCR mix are prepared and placed into a vial and covered with oil. Emulsification of the PCR mix and oil is preformed such that an emulsion is created and the bubbles are capable of withstanding PCR thermal cycling. The emulsified samples are loaded into a capillary tube and end point PCR is carried out in the tube. PCR generated products are detected in the bubbles, P percent of bubbles with no PCR amplification products associated with them is determined and ONTM is calculated as described herein.


PUM

PropertyMeasurementUnit
Capillary waveaaaaaaaaaa
Volumeaaaaaaaaaa
Ratioaaaaaaaaaa

Abstract

The present application provides methods and devices for absolute quantification of polymerase chain reaction target nucleic acids. In particular, the methods and devices of the present application provide for splitting a nucleic acid sample to be analyzed into small, isolated volumes, conducting the method of polymerase chain reaction (PCR) on said volumes, detecting PCR amplification products, analyzing said detected PCR amplification products, performing absolute quantification of the PCR target and presenting said quantification results.

Description

[0001]The present application claims priority to U.S. Provisional Application No. 60 / 725,899, filed Oct. 12, 2005, which is incorporated herein by reference.FIELD OF THE INVENTION[0002]The present application provides methods and devices for absolute quantification of polymerase chain reaction target nucleic acids. In particular, the methods and devices of the present application provide for splitting a nucleic acid sample to be analyzed into small, isolated volumes, conducting the method of polymerase chain reaction (PCR) on said volumes, detecting PCR amplification products, analyzing said detected PCR amplification products, performing absolute quantification of the PCR target and presenting said quantification results.BACKGROUND OF THE INVENTION[0003]Real-time PCR has become the method of choice in various gene-related applications because it is conceptually straightforward, flexible and sensitive while generating quantitative data (Heid et al., 1996, Genome Res. 6:986). Its app...

Claims


Application Information

Patent Timeline
IPC IPC(8): C40B30/04C40B30/00
CPCB01L3/50851C12Q1/686B01L2300/069B01L2300/0816B01L2300/0829B01L2300/0838C12Q1/6851G01N21/6452B01L7/52C12Q2537/157C12Q2527/137C12Q2565/518
Inventor GORFINKEL, VERAGORBOVITSKI, BORIS
Owner THE RES FOUND OF STATE UNIVOF NEW YORK
Learn More