
Method, system, and computer program product for localizing photons and a light source emitting the photons

a technology of light source and localization method, applied in the field of localization method, system and computer program product, can solve the problems of insufficient standard statistical methods for localizing spatial coordinates, adverse effects on confidence in the knowledge of (x,y) position, etc., and achieve high spatial and temporal resolution, high resolution, and high localization uncertainty

Inactive Publication Date: 2010-08-26
BOARD OF RGT NEVADA SYST OF HIGHER EDUCATION ON BEHALF OF THE UNIV OF NEVADA RENO
View PDF2 Cites 14 Cited by
  • Summary
  • Abstract
  • Description
  • Claims
  • Application Information

AI Technical Summary

Benefits of technology

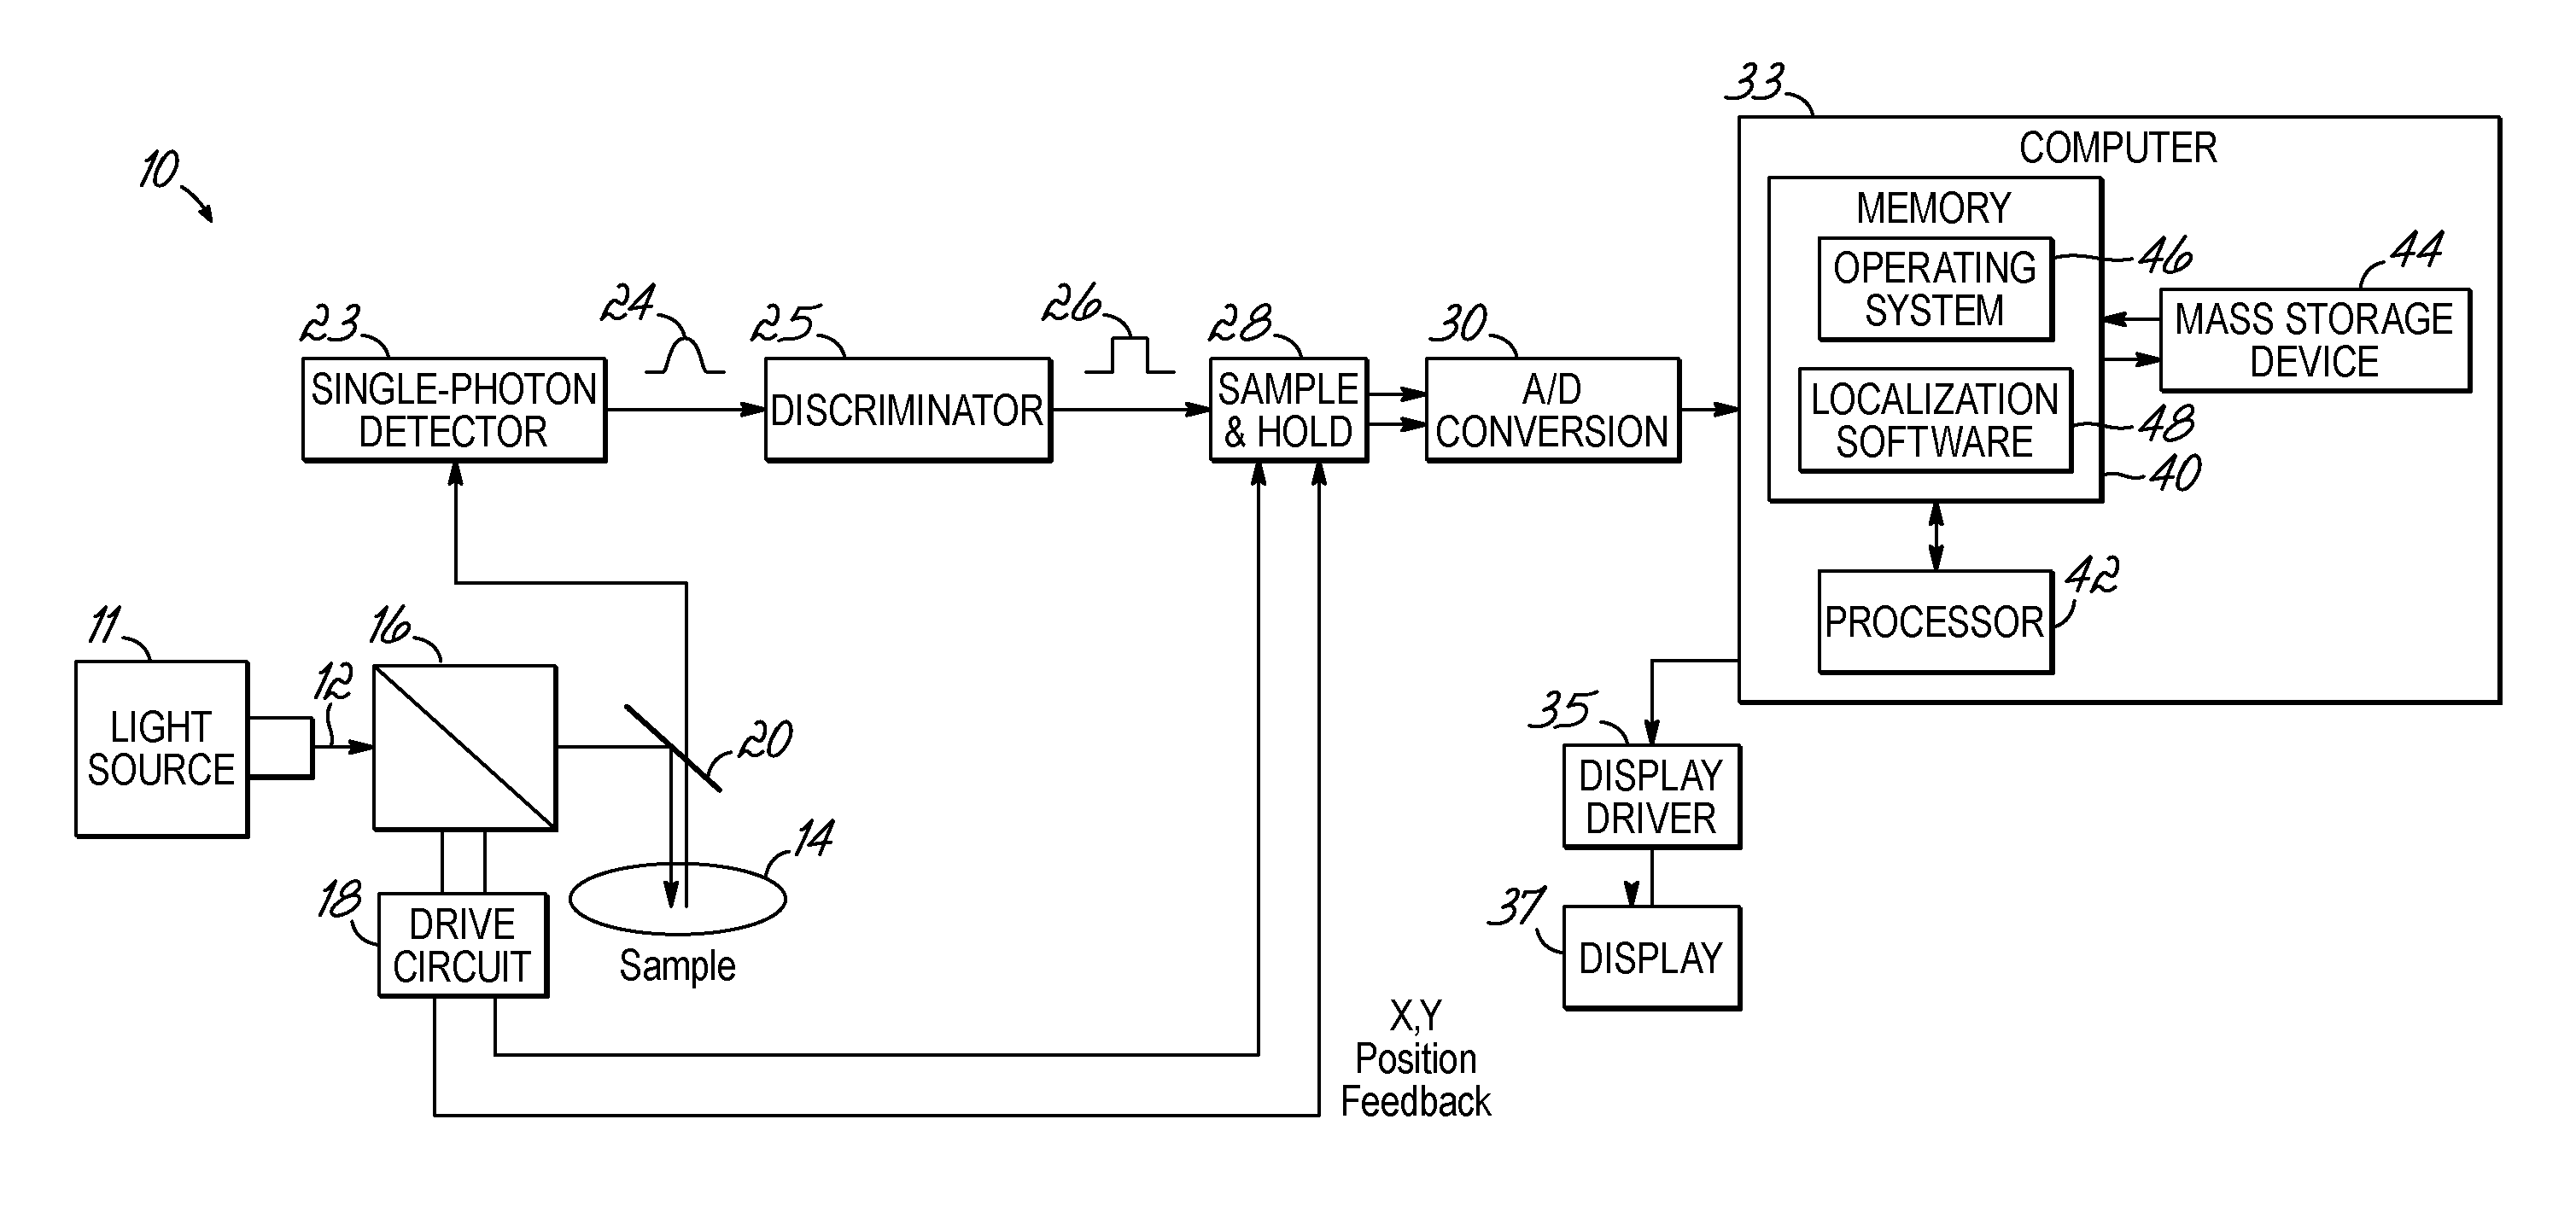
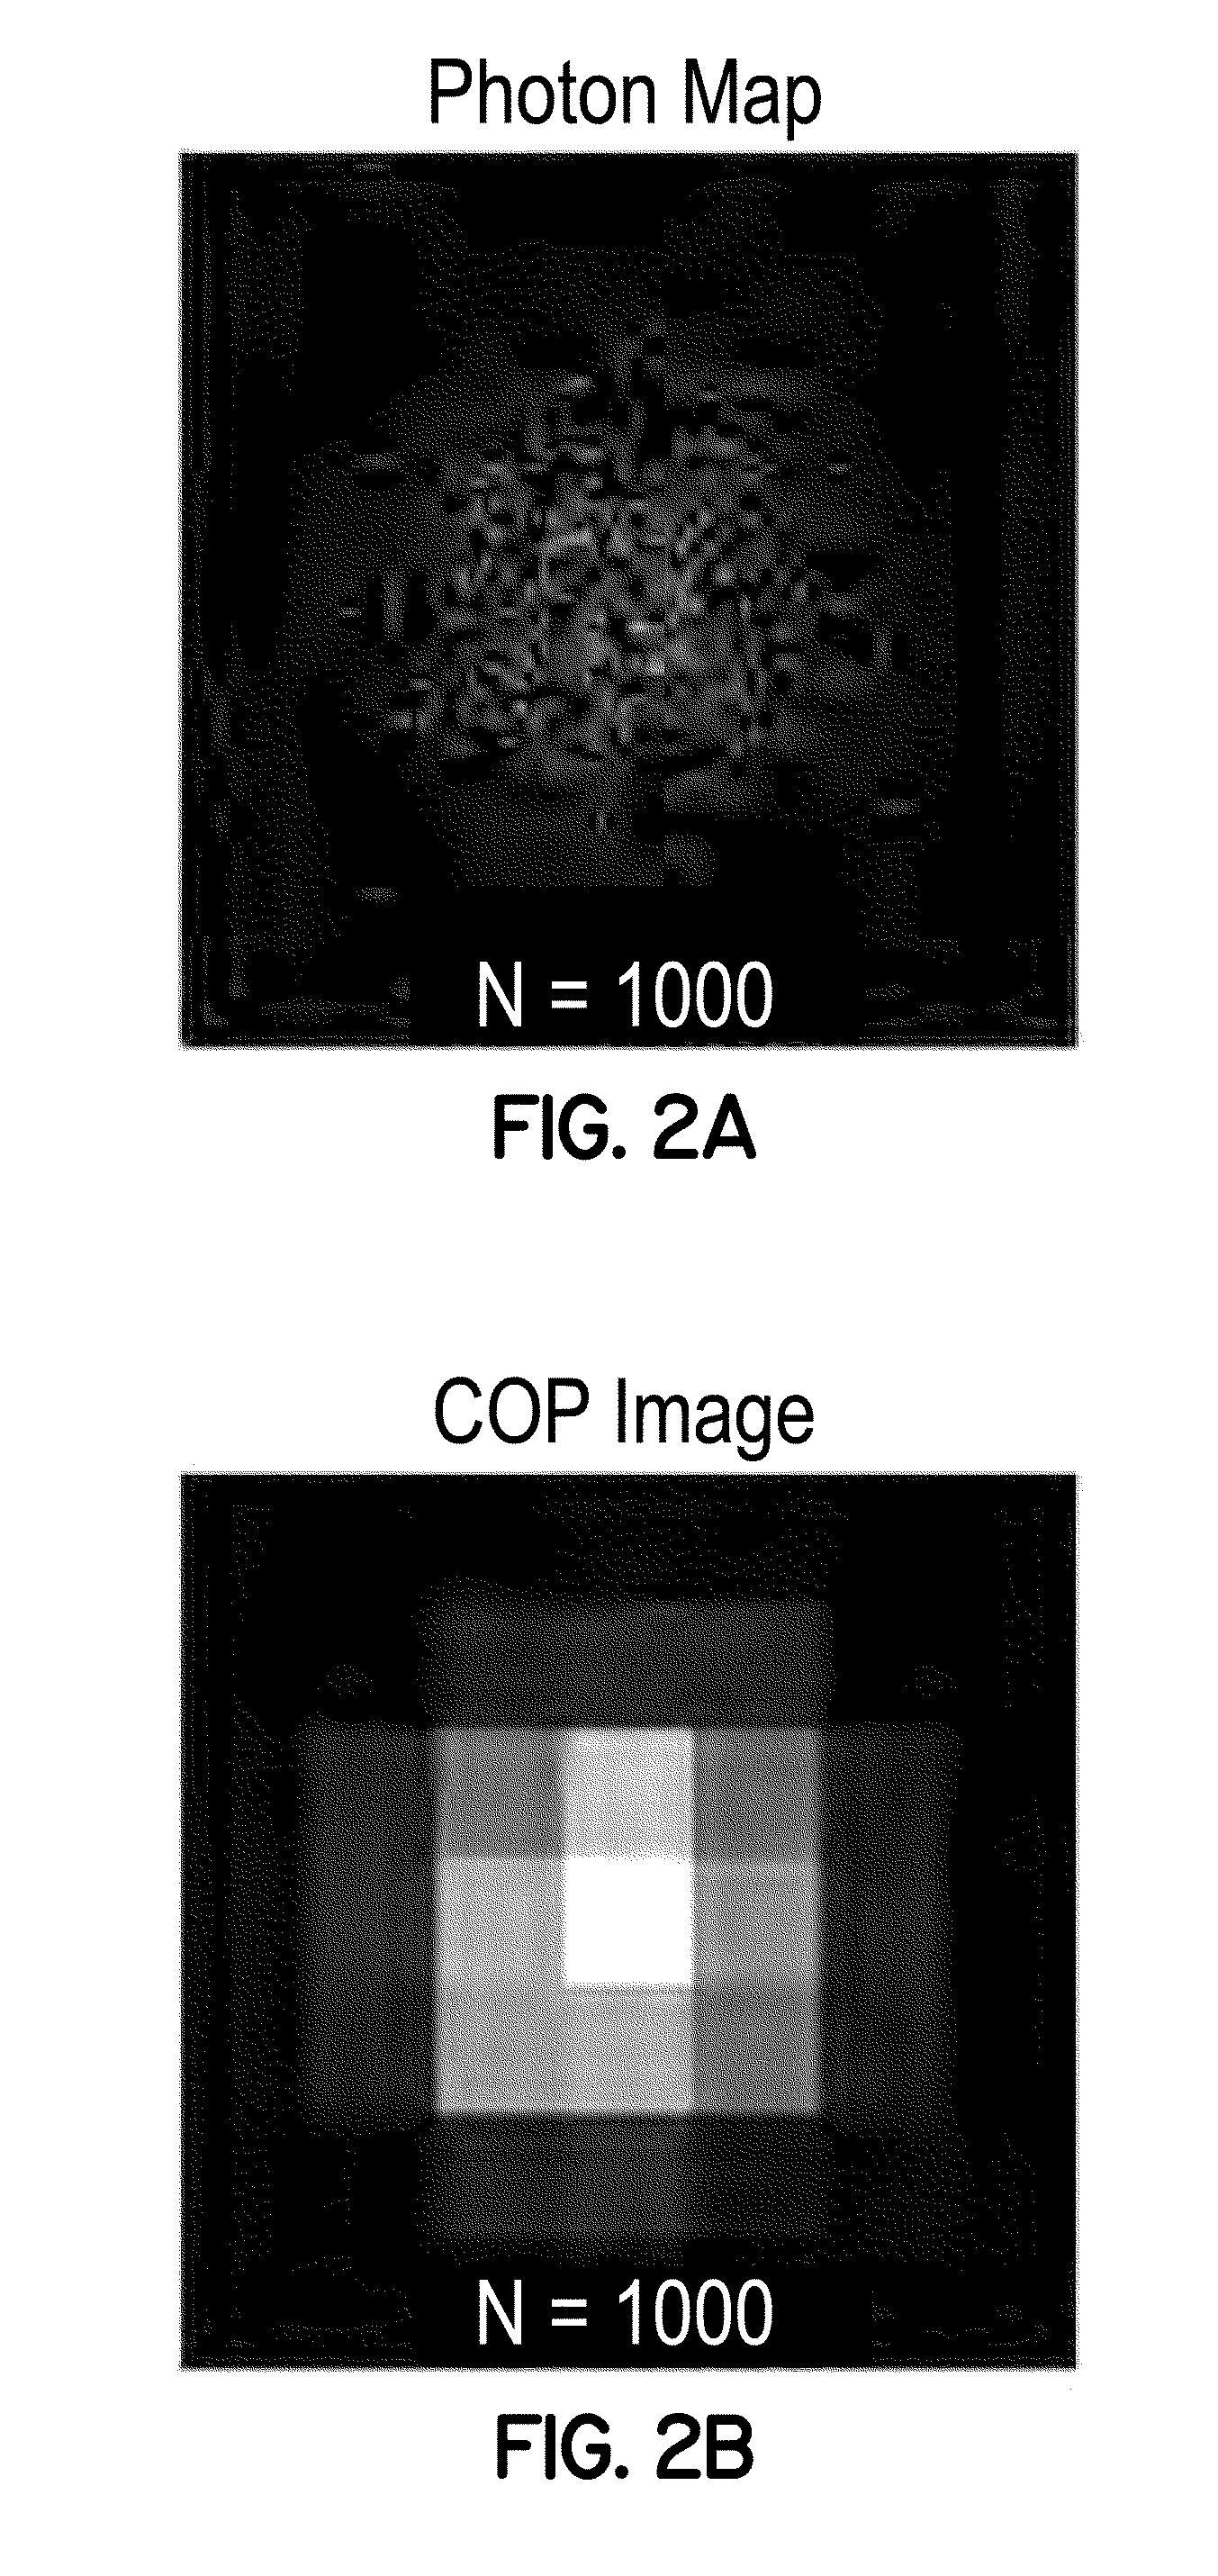
[0011]The embodiments of the invention rely upon a multi-variate distribution, such as a multi-variate normal distribution (MVND), to localize single particles with high spatial and temporal resolution. For example, the multi-variate distribution approach may be used to analyze binary data sets acquired by Photon Event Distribution Sampling (PEDS), which is an image formation technique implemented on scanning microscopes in which the position of origin of each detected photon is acquired with high resolution as a binary data set rather than binning photons in pixels. Multi-variate distribution localization is more precise than statistical (Gaussian) curve fitting to pixel-based images and produces localization uncertainties in excellent agreement with predicted precisions. Precisions on the order of single nanometers may be achieved with a higher number of photons / sample.
[0012]The multi-variate distribution approach, in combination with PEDS, may expand particle tracking to single-photon microscope systems and multi-photon microscope systems and, furthermore, may permit localizations deep within specimens with nanometer precision. PEDS localization in combination with multi-variate distribution is applicable to any three-dimensional super-resolution microscopy techniques that image non-linearly by localizing single fluorophores. PEDS localization in combination with multi-variate distribution may also facilitate the simultaneous and accurate tracking of multiple (e.g., different color) fluorophores or objects emitting photons by a different mechanism.

Problems solved by technology

However, the efficacy of these studies depends on the precision with which the location of a sub-resolution fluorescent label imaged as a diffraction-limited single source of light can be measured.
Confidence in the knowledge of the (x,y) position is adversely affected by several sources of uncertainty, namely those associated with photon noise, background noise, and pixel size.
However, due primarily to the binary nature of the photon position map, standard statistical methods are inadequate to localize the spatial coordinates for the origin of a photon acquired by a scanning microscope.

Method used


Image

  • Method, system, and computer program product for localizing photons and a light source emitting the photons
  • Method, system, and computer program product for localizing photons and a light source emitting the photons
  • Method, system, and computer program product for localizing photons and a light source emitting the photons

Examples


example 1

[0067]Fluorescent beads (Dragon Green 488 / 520 excitation / emission, Bangs Laboratories, Inc., Fishers, Ind.) with a diameter of ninety-two (92) nanometers were selected as a sub-diffraction light source to approximate single fluorophores. These fluorescent beads produced images of diffraction-limited spots defined by the point spread function (PSF) of the optical system. The fluorescent beads were mounted in glycerol on cleaned cover slips. The fluorescent beads adhered to the cover slip and remained immobile throughout image acquisition. With one exception, images were acquired at two (2) frames per sec, using a raster scan pattern, from a region of the specimen roughly 2.2 microns×2.2 microns. During acquisition, the focal plane was maintained constant using a focus control system (C-focus, Mad City Labs, Inc., Madison, Wis.).

[0068]High-resolution light microscopy images are typically formed by binning photons into pixels sized 2.3 times smaller than the maximum resolvable spatial ...

example 2

[0074]This example demonstrates the localization error due to Gaussian fitting. The location of a single fluorescent particle can been determined for the purpose of tracking single molecules by statistically fitting a Gaussian intensity profile to a COP image of the spot. Under ideal conditions, with no background noise (i.e., b=0), the predicted uncertainty of localization for Gaussian fitting depends only on: 1) the width of the spot, which depends on the wavelength of light used and the numerical aperture of the objective lens; 2) the number of photons collected; and 3) the size of the pixels used to form the image. Under ideal conditions, the predicted uncertainty of multi-variate distribution localization is obtained by measuring the width (one standard deviation) of the particle location PDF that results from the multi-variate distribution localization equation.

[0075]With reference to FIG. 3C, the predicted uncertainty of localization, plotted as a function of photon count, fo...

example 3

[0080]This example relates to the precision of localization using a multi-variate distribution localization approach in acquired images.

[0081]Small changes in focus can have considerable effects on the width and shape of the spot and, therefore, on localization results. To test whether a focal plane could be identified consistently during localization experiments, the focal planes of twenty (20) different sub-diffraction (92 nm) beads were determined prior to image acquisition, based on the sharpest image and highest photon count. An image sequence was captured of each bead and, post acquisition, the width of a Gaussian intensity profile fit to a COP image of the bead was measured in 30 sequential frames. The average of the 30 measurements for each of the 20 beads is reported as a mean spot width (open circles) in FIG. 4A. During image acquisition, each bead displayed good radial and bi-axial uniformity as focus was changed, indicating the presence of only minor spherical aberration...


PUM


Abstract

Localization methods and methods for localizing a light source using multivariate statistical analysis. In particular, a multi-variate distribution, such as a multi-variate normal distribution, may be used to localize photons originating from a light source and, in particular, may be used to analyze photon position maps acquired by Photon Event Distribution Sampling (PEDS). The multi-variate distribution assigned to each of the photons in the photon position map may be summed to predict a most probable location for the light source.

Description

CROSS-REFERENCE TO RELATED APPLICATIONS[0001]This application claims the benefit of U.S. Provisional Application No. 61 / 154,258, filed Feb. 20, 2009 (pending), which is hereby incorporated by reference herein in its entirety. This application is also a continuation-in-part of application Ser. No. 11 / 986,371, filed Nov. 21, 2007 (pending), which is a continuation-in-part of application Ser. No. 11 / 597,028, filed Nov. 17, 2006 (pending), which is the National Stage of International Application No. PCT / US05 / 17948, filed May 20, 2005 (expired), which claims the benefit of U.S. Provisional Application No. 60 / 573,459, filed May 20, 2004 (expired), each of which is incorporated herein by reference herein in its entirety. This application is also a continuation-in-part of application Ser. No. 11 / 597,028, filed Nov. 17, 2006 (pending), which is the National Stage of International Application No. PCT / US05 / 17948, filed May 20, 2005 (expired), which claims the benefit of U.S. Provisional Applic...

Claims


Application Information

Patent Timeline
IPC IPC(8): G01N21/64G01J1/58
CPCG01J1/58G01N21/6458G01N15/1434G01N15/1429
Inventor LARKIN, JOSHPUBLICOVER, NELSONSUTKO, JOHN
Owner BOARD OF RGT NEVADA SYST OF HIGHER EDUCATION ON BEHALF OF THE UNIV OF NEVADA RENO
Learn More