Novel temperature-sensitive fluorescent compound and application thereof

a fluorescent compound and temperature-sensitive technology, applied in the field of cell detection, can solve the problems of inability to distinguish individual cells from cameras working in infrared wavelengths, difficult to measure intracellular temperature changes by using conventional methods of temperature measurement, and inability to detect intracellular temperature by infrared thermography methods, etc., to achieve accurate measurement of intracellular temperature, easy application, and high spatial and temporal resolution

Inactive Publication Date: 2016-12-29
SHANGHAI INST OF BIOLOGICAL SCI CHINESE ACAD OF SCI
View PDF0 Cites 7 Cited by
  • Summary
  • Abstract
  • Description
  • Claims
  • Application Information

AI Technical Summary

Benefits of technology

[0216]1. The fluorescent dye compounds of the present invention are capable of staining subcellular structures of a living cell, especially the cell membrane, cytoplasm, or mitochondria, thereby obtaining temperature distribution image of the cell with high spatial and temporal resolution;
[0217]2. The present invention provides a powerful tool for studying cell metabolism, cell inflammatory fever and the like;
[0218]3. The present invention provides a novel cellular thermal imaging method and a powerful tool for observing changes in the cellular temperature when the cell is subjected to various processes and pathological conditions;
[0219]4. It is a creative use of another referential fluorescent compound in distribution calibration of a temperature-sensitive fluorescent compound, wherein said another fluorescent compound possesses the same intracellular concentration distribution as the temperature-sensitive fluorescent compound and does not possess temperature-sensitive properties, thereby more accurately measuring the intracellular temperature;
[0220]5. The method of the present invention can be easily applied in a variety of fluorescence microscopy imaging system, and accurately, easily and rapidly obtain temperature distribution image of a cell with high spatial and temporal resolution, therefore, the method can be simply expanded and applied.
[0221]The invention will be further illustrated with reference to the following specific examples. It is to be understood that these examples are only intended to illustrate the invention, but not to limit the scope of the invention. For the experimental methods in the following examples without particular conditions, they are performed under routine conditions, or as instructed by the manufacturer. All the percentages or fractions refer to weight percentage and weight fraction, unless stated otherwise.

Problems solved by technology

However, due to the heat exchange from extracellular environment, the changes in intracellular temperature generally are relatively local, and exhibite transient characteristics, therefore, it is difficult to measure the changes in intracellular temperature by using conventional methods of temperature measurement.
In addition, the operating wavelength of an infrared camera is generally 14 μm, and according to Rayleigh criterion on optical resolution, the camera working in such infrared wavelength can not distinguish individual cells.
Therefore, the infrared thermography method is not suitable for detecting intracellular temperature.
In recent reports, some scholars have designed a novel thermocouple material for measuring the real-time temperature of individual cells, and the method can obtain temperature curve with high temporal resolution, but this is only a single point measurement, and for obtaining two-dimensional thermography, time resolution is significantly decreased, and such contact-type measurement will likely penetrate and damage the cell membrane.
Therefore, thermal imaging of a cell can not easily be performed by a thermocouple-based temperature measurement.
However, it is necessary to introduce such temperature-sensitive fluorescent nano-materials into cells by injection, resulting in interference and damage to cells; and it can be seen from the reported fluorescence images that distribution of the nanomaterial on the cell is very uneven, and only some small bright spots can be found [1].
In addition to the temperature, the fluorescence intensity of temperature-sensitive fluorescent materials is also relevant to the concentration distribution, therefore, there may be certain problems that the temperature of a cell is simply indicated by the average fluorescence intensity of the whole cell.

Method used


Image

  • Novel temperature-sensitive fluorescent compound and application thereof
  • Novel temperature-sensitive fluorescent compound and application thereof
  • Novel temperature-sensitive fluorescent compound and application thereof

Examples


example 1

Synthesis of Rh101AM and RhBAM

[0223]Rh101 (purchased from Santa Cruz), cesium fluoride, and bromoacetic acid were mixed at a ratio of 1:2:1.2 and dissolved in ten times of dimethylformamide (DMF). The reaction mixture was stirred for 2 hours at room temperature, and then purified with preparative high performance liquid chromatography to obtain Rh101AM (the compound of Formula II).

[0224]Synthesis method for RhBAM is similar to that of Rh101AM:

[0225]RhB (purchased from Santa Cruz), cesium fluoride, and bromoacetic acid were mixed at a ratio of 1:2:1.2 and dissolved in ten times of dimethylformamide (DMF). The reaction mixture was stirred for 2 hours at room temperature, and then purified with preparative high performance liquid chromatography to obtain RhBAM (the compound of Formula III).

example 2

Synthesis of Rh101ME and RhBME

[0226]Rh101 and thionyl chloride were mixed at a ratio of 1:5 and dissolved in 10 times of chloroform, heated to 60° C. and stirred for 10 minutes. And then the mixture was cooled to room temperature and quenched with methanol. Afterwards, the solvent was removed on a rotary evaporator under reduced pressure, and the residue was purified through preparative high performance liquid chromatography thereby obtaining Rh101ME (the compound of Formula IV).

[0227]Synthesis method for RhBME is similar to that of Rh101ME:

[0228]RhB and thionyl chloride were mixed at a ratio of 1:5 and dissolved in 10 times of chloroform, heated to 60° C. and stirred for 10 minutes. And then the mixture was cooled to room temperature and quenched with methanol. Afterwards, the solvent was removed on a rotary evaporator under reduced pressure, and the residue was purified through preparative high performance liquid chromatography thereby obtaining RhBME (the compound of Formula V).

example 3

Measurement of the Temperature Distribution of Cytoplasm Using Rh101AM

[0229]Rh101AM was used to stain live cells and imaged under a fluorescent microscope. The fluorescenc image was calculated using equation (1), thereby obtaining the image of intracellular temperature distribution.

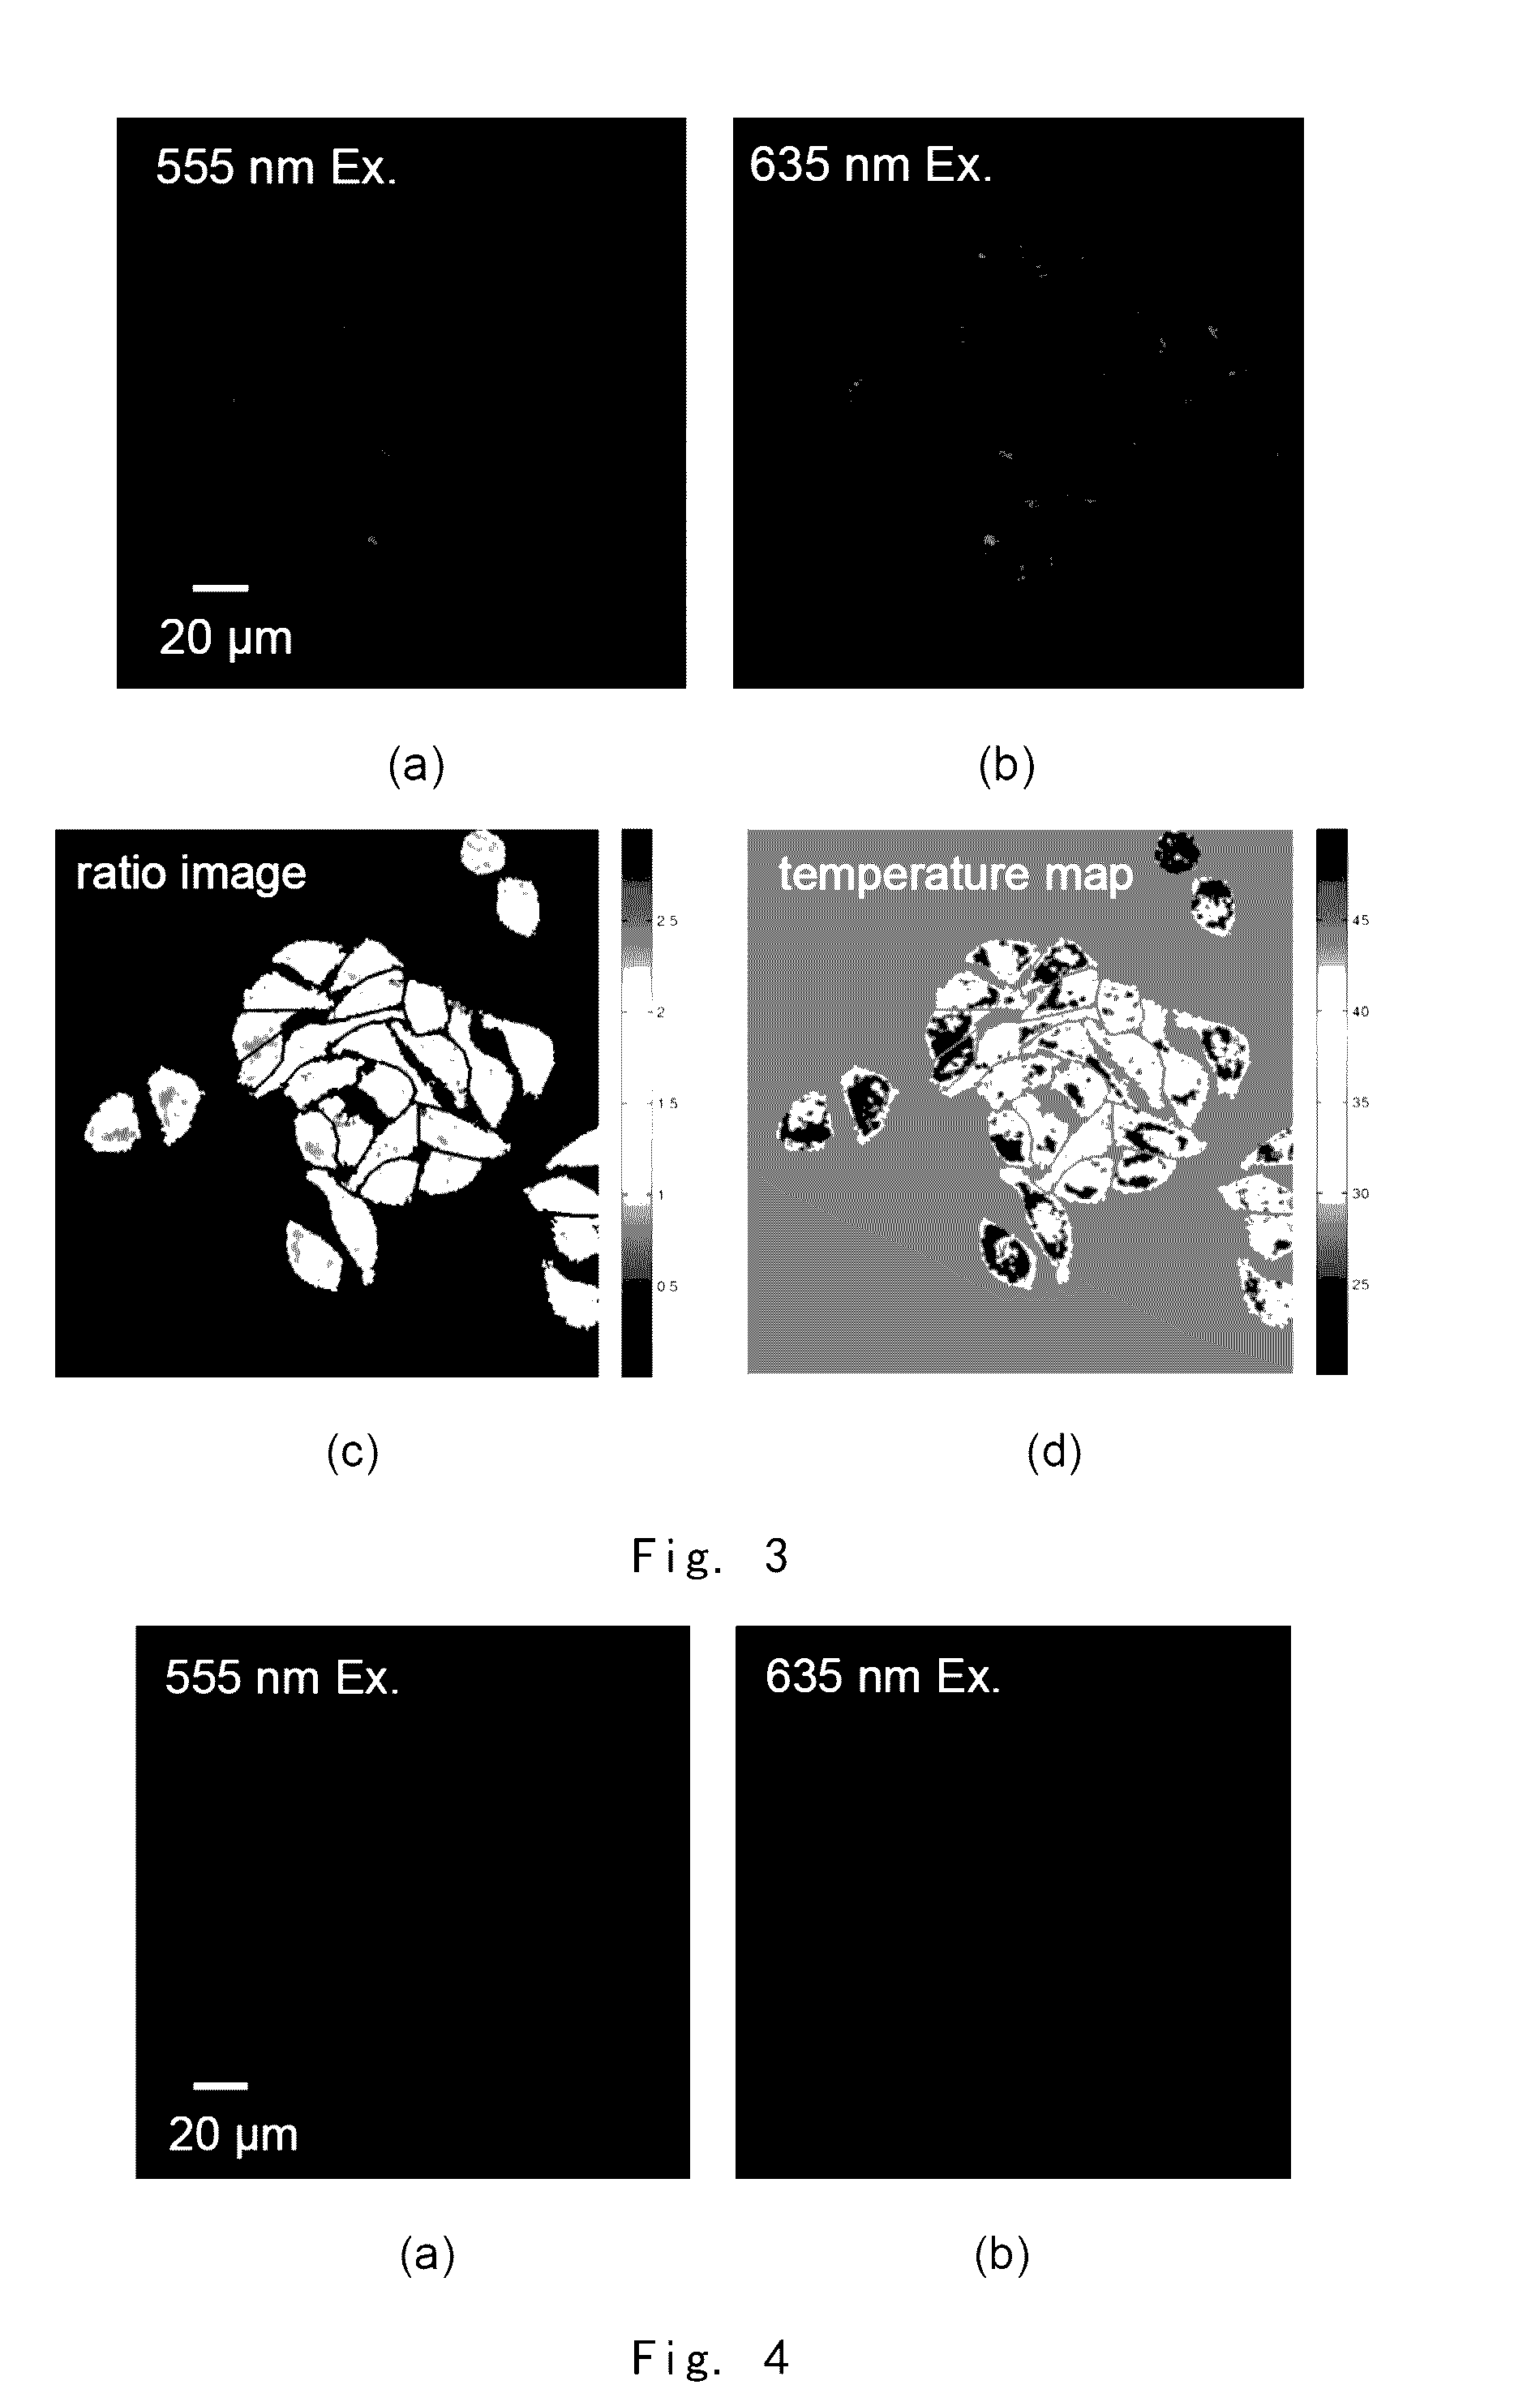
[0230]FIG. 3 shows Stokes luminescence image of HepG2 cells captured by EMCCD (Evolve 512, Photometrice Ltd.) under fluorescence microscope (BX61WI, Olympus Ltd., 40×lens, numerical aperture 0.8, the temperature of culture solution is 27.9□ at imaging), after the cells were stained by using 200 nM Rh101AM for 60 mins in an incubator at 37□. Wherein, 3(a) shows Stokes luminescence image from a monochromator (Optoscan monochromator, Cairn Research Ltd.), excited at a wavelength of 555 nm (bandwidth of 3 nm) and collected at 573˜613 nm; 3(b) shows anti-Stokes luminescence image from a monochromator, excited at a wavelength of 635 nm (bandwidth of 15 nm) and collected at 573˜613 nm; and 3(c) shows a ratio ima...


PUM

PropertyMeasurementUnit
operating wavelengthaaaaaaaaaa
pHaaaaaaaaaa
wavelengthaaaaaaaaaa

Abstract

Provided is a compound represented by formula I, wherein R9 is a C1-C22 hydrocarbyl group, or a C2-C3 ester-substituted C1-C3 alkyl group, R5, R6, R7, and R8 are alkyl groups or H, and R1, R2, R3, and R4 are H or a lower hydrocarbyl group. Or, R9 is a C2-C22 hydrocarbyl group, or a C2-C3 ester-substituted C1-C3 alkyl group, and R5 is connected to R1, R6 is connected to R2, R7 is connected to R3, R8 is connected to R4 to form six-membered rings. The present compound is temperature-sensitive and can enter into cells. An intracellular temperature distribution image having high spatial and temporal resolution can thus be obtained. The present compound can also perform distribution calibration on a temperature-sensitive fluorescent compound. Also provided is a method for measuring temperature distribution within a living cell, and a corresponding detection kit. The method satisfies the requirements of small size measurement and rapid measurement, thereby achieving high resolution in terms of space and time.

Description

TECHNICAL FIELD[0001]The present invention relates to the field of cell-detection. In particular, the present invention relates to novel fluorescent dyes and the use of such novel fluorescent dyes to detect the temperature distribution within living cells.BACKGROUND[0002]For cellular activities, such as metabolism, enzymatic reactions, cell division, gene expression and the like, temperature of the cell will change to some degree. These cellular activities are generally accompanied by the release of chemical energy of ATP, and heat will be generated so that the temperature will rise. In addition, under external stimuli of drugs or signals, the metabolic activity of a cell will rapidly change, leading to vigorous fluctuate of intracellular temperature. However, due to the heat exchange from extracellular environment, the changes in intracellular temperature generally are relatively local, and exhibite transient characteristics, therefore, it is difficult to measure the changes in int...

Claims


Application Information

Patent Timeline
Patent Type & Authority Applications(United States)
IPC IPC(8): C07D311/82G01K11/20C09K11/06C07D471/22C07D471/04
CPCC09K2211/1088C09K2211/1048C09K2211/1044G01K11/20C07D471/22C07D471/04C09K11/06C07D311/82C07D491/22C09B11/24C09K9/02C09K2211/1033
Inventor KANG, JIANSHENGXIE, TAORONGLIU, CHUNFENG
Owner SHANGHAI INST OF BIOLOGICAL SCI CHINESE ACAD OF SCI
Why Eureka
Try Eureka