Biochip Self-Calibration Process
- Summary
- Abstract
- Description
- Claims
- Application Information
AI Technical Summary
Benefits of technology
Problems solved by technology
Method used
Image
Examples
example 1
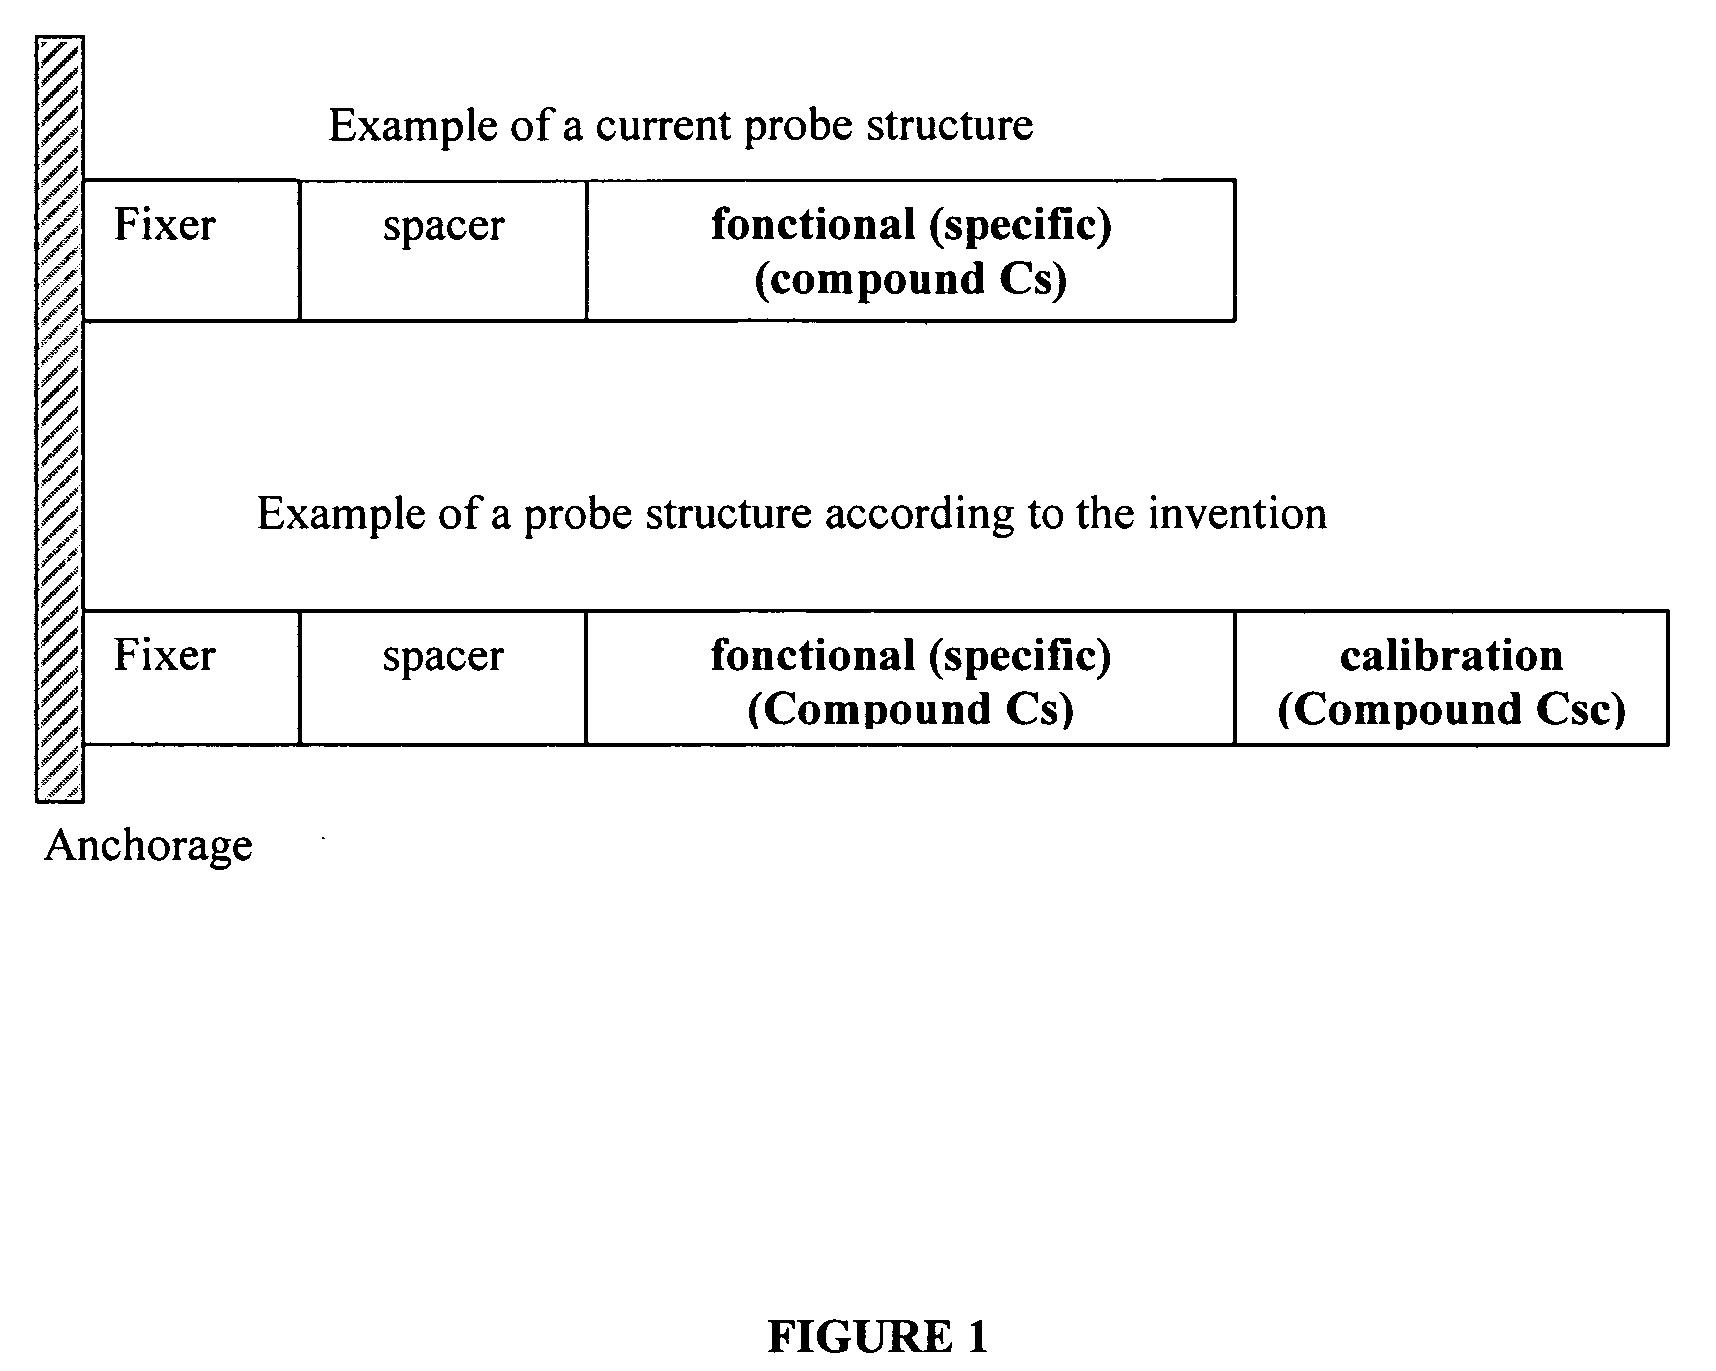
[0137]Assembly of a solid support for SPR imaging with a nucleic type probe specific to target compound Cs attached to its surface, coupled to a calibration probe Csc.
[0138]Materials and methods[0139]Example of adequate functionalisation in the case of dynamic DNA / DNA biochips.
[0140]We produced chips from a glass substrate, of the microscope slide type, onto which was deposited a layer of chromium of about 2 nm and a gold layer of about 50 nm. A molecular self-assembly system of the MUA (11-mercaptoundecanoic acid) / PEI (polyethylineimine) / extravidine type was added to this deposit as described in the document by Bassil et al., 2003, or of the 11-mercaptoundecanol / Dextran / avidine type (Biocore). As the final layer is rich in avidine groups, it is particularly well suited to deposits of new groups functionalised with biotine (the avidine / biotine complex is particularly stable). Biochips were functionalized by spotting biotinylated probe sequences (the probe sequences were diluted to a...
example 2
Results
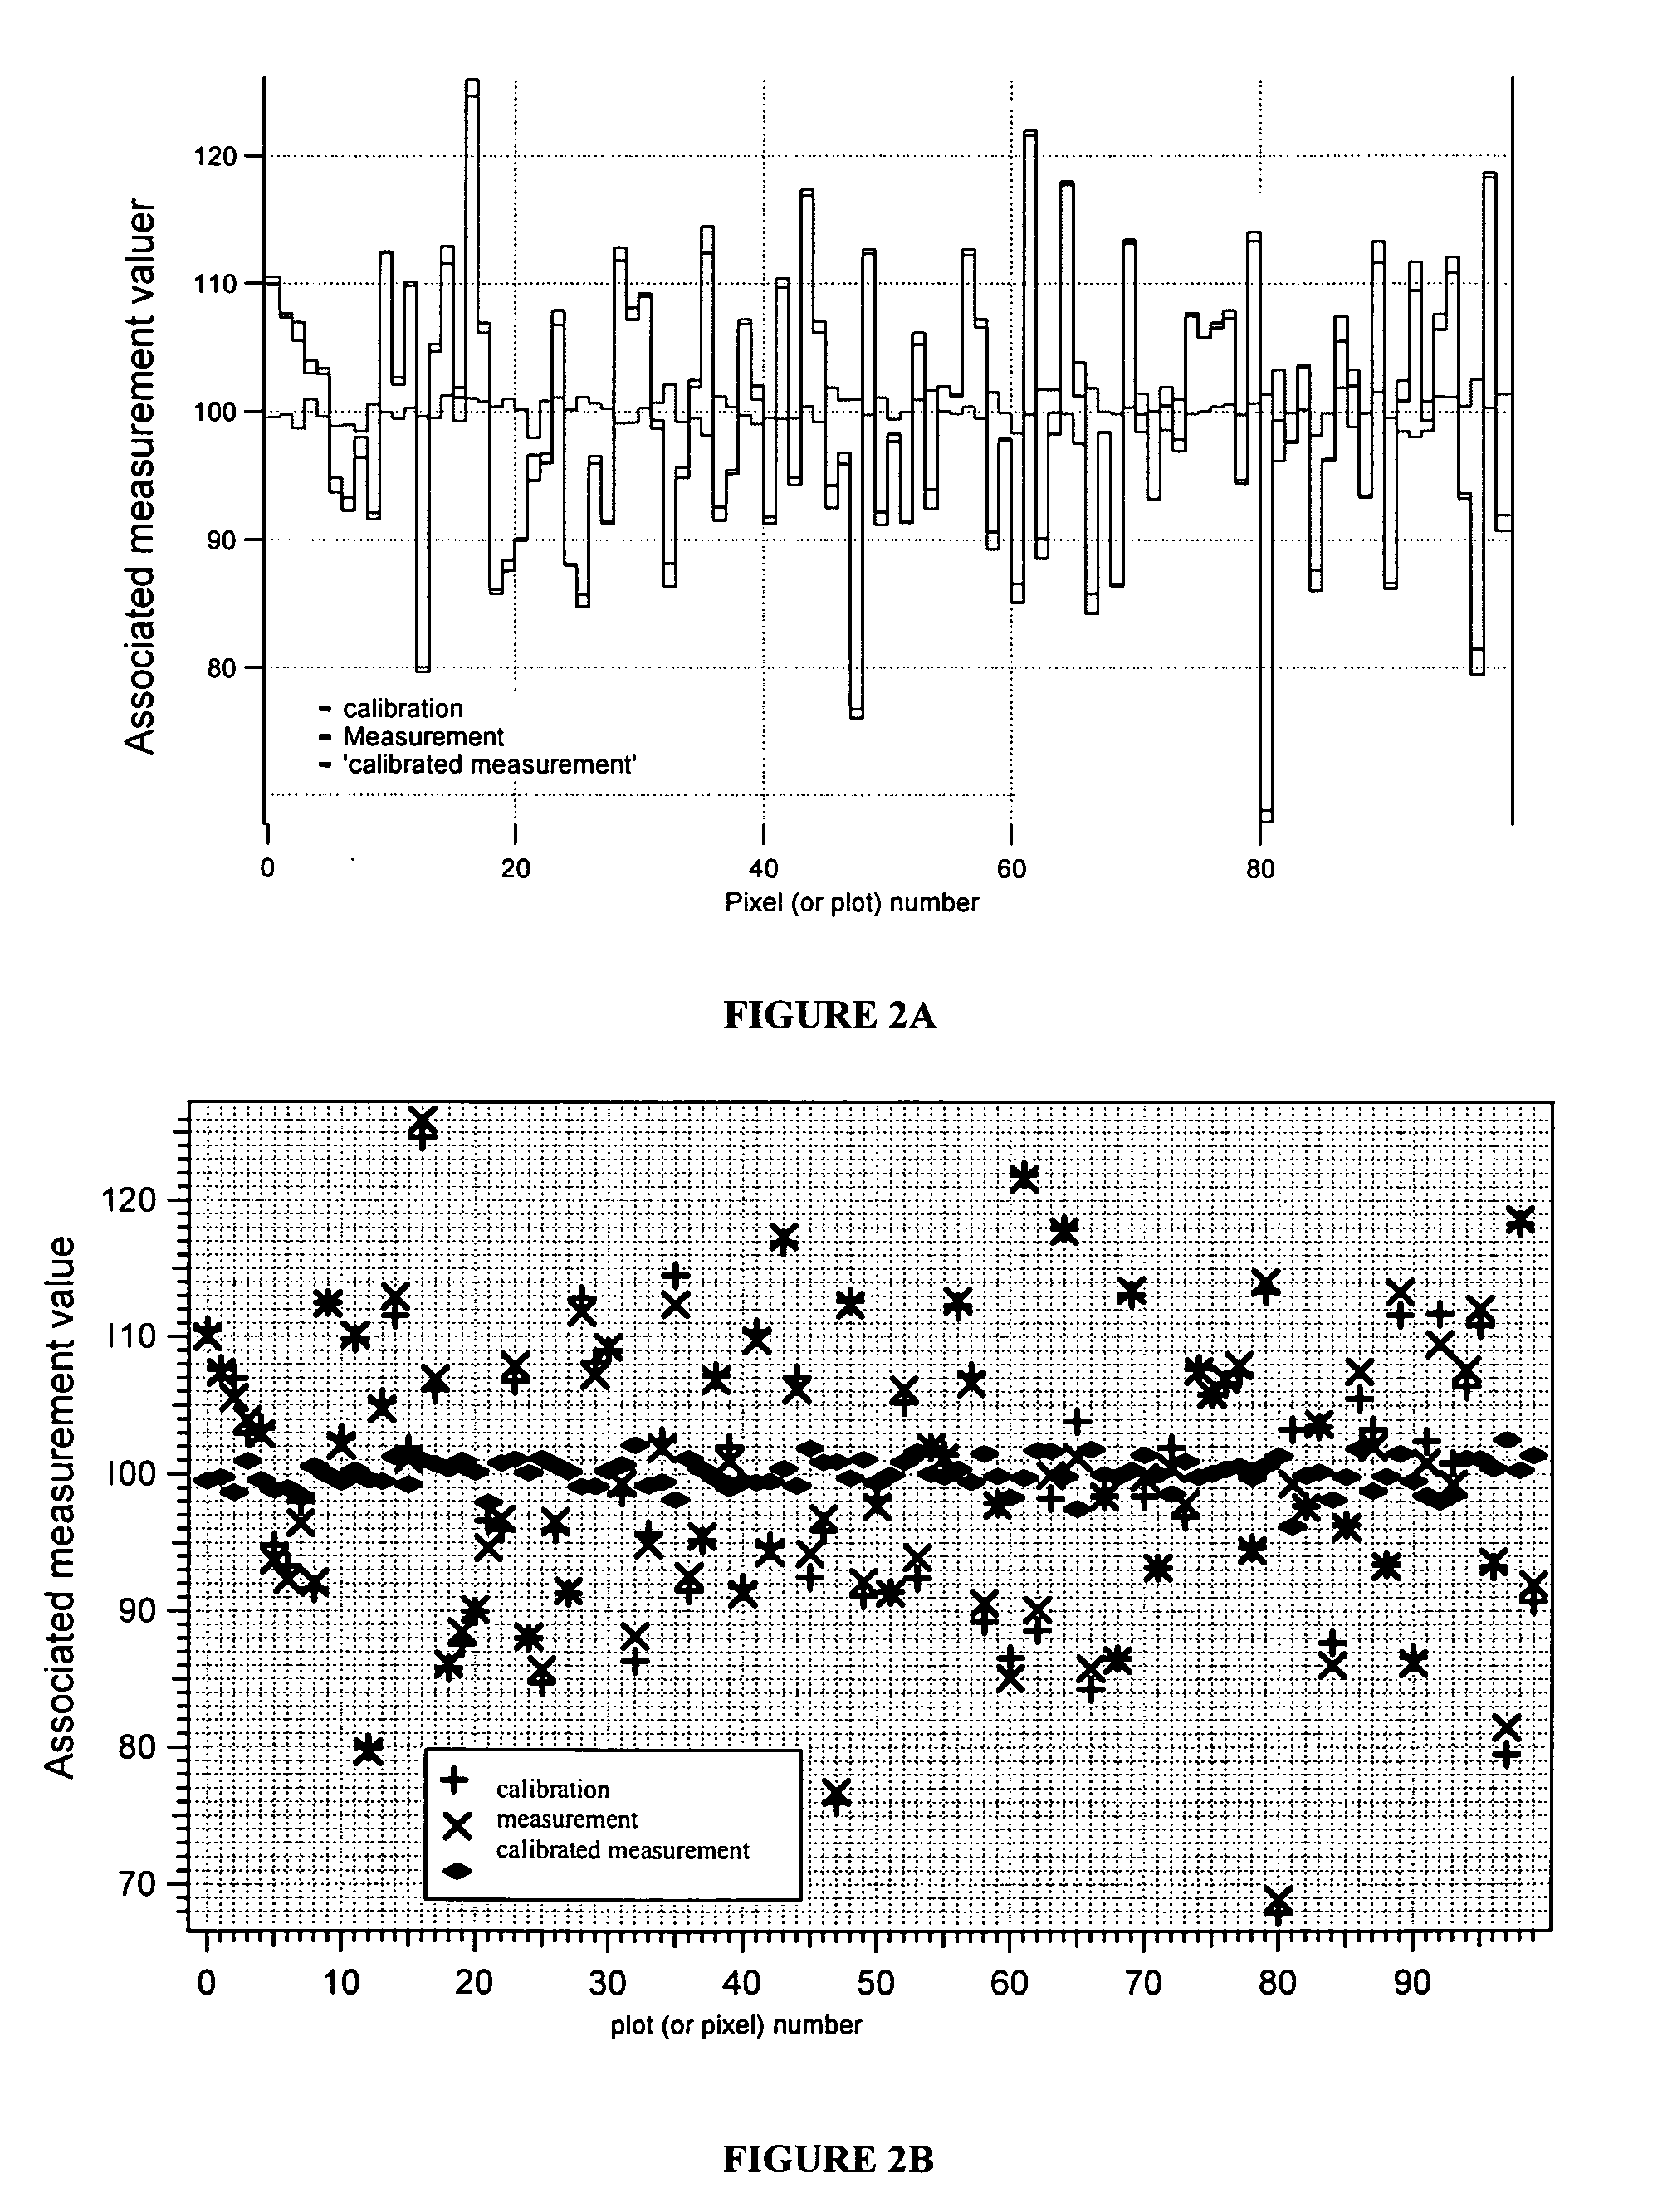
[0151]Example of record of measurements obtained with 100 pixels of a plot (or 100 supposedly identical plots)
[0152]See FIGS. 2A and 2B
[0153]Record of measurements (symbol × (multiplied)) over 100 pixels of a plot (or 100 supposedly identical plots).
[0154]For the same pixels (plots), the corresponding calibration measurements are given by the symbol + (plus).
[0155]The data for measurements corrected by the variations measured in the calibration phase are represented by the symbol ♦ (diamond).
[0156]In the present case, the values for the calibration measurements are the result of Gaussian distribution centred on 100 and a magnitude of 10, those of the measurements are correlated to the calibration measurements with a Gaussian distribution of a magnitude of 1. This is in the order of magnitude that we find naturally, alone, in corrected data.
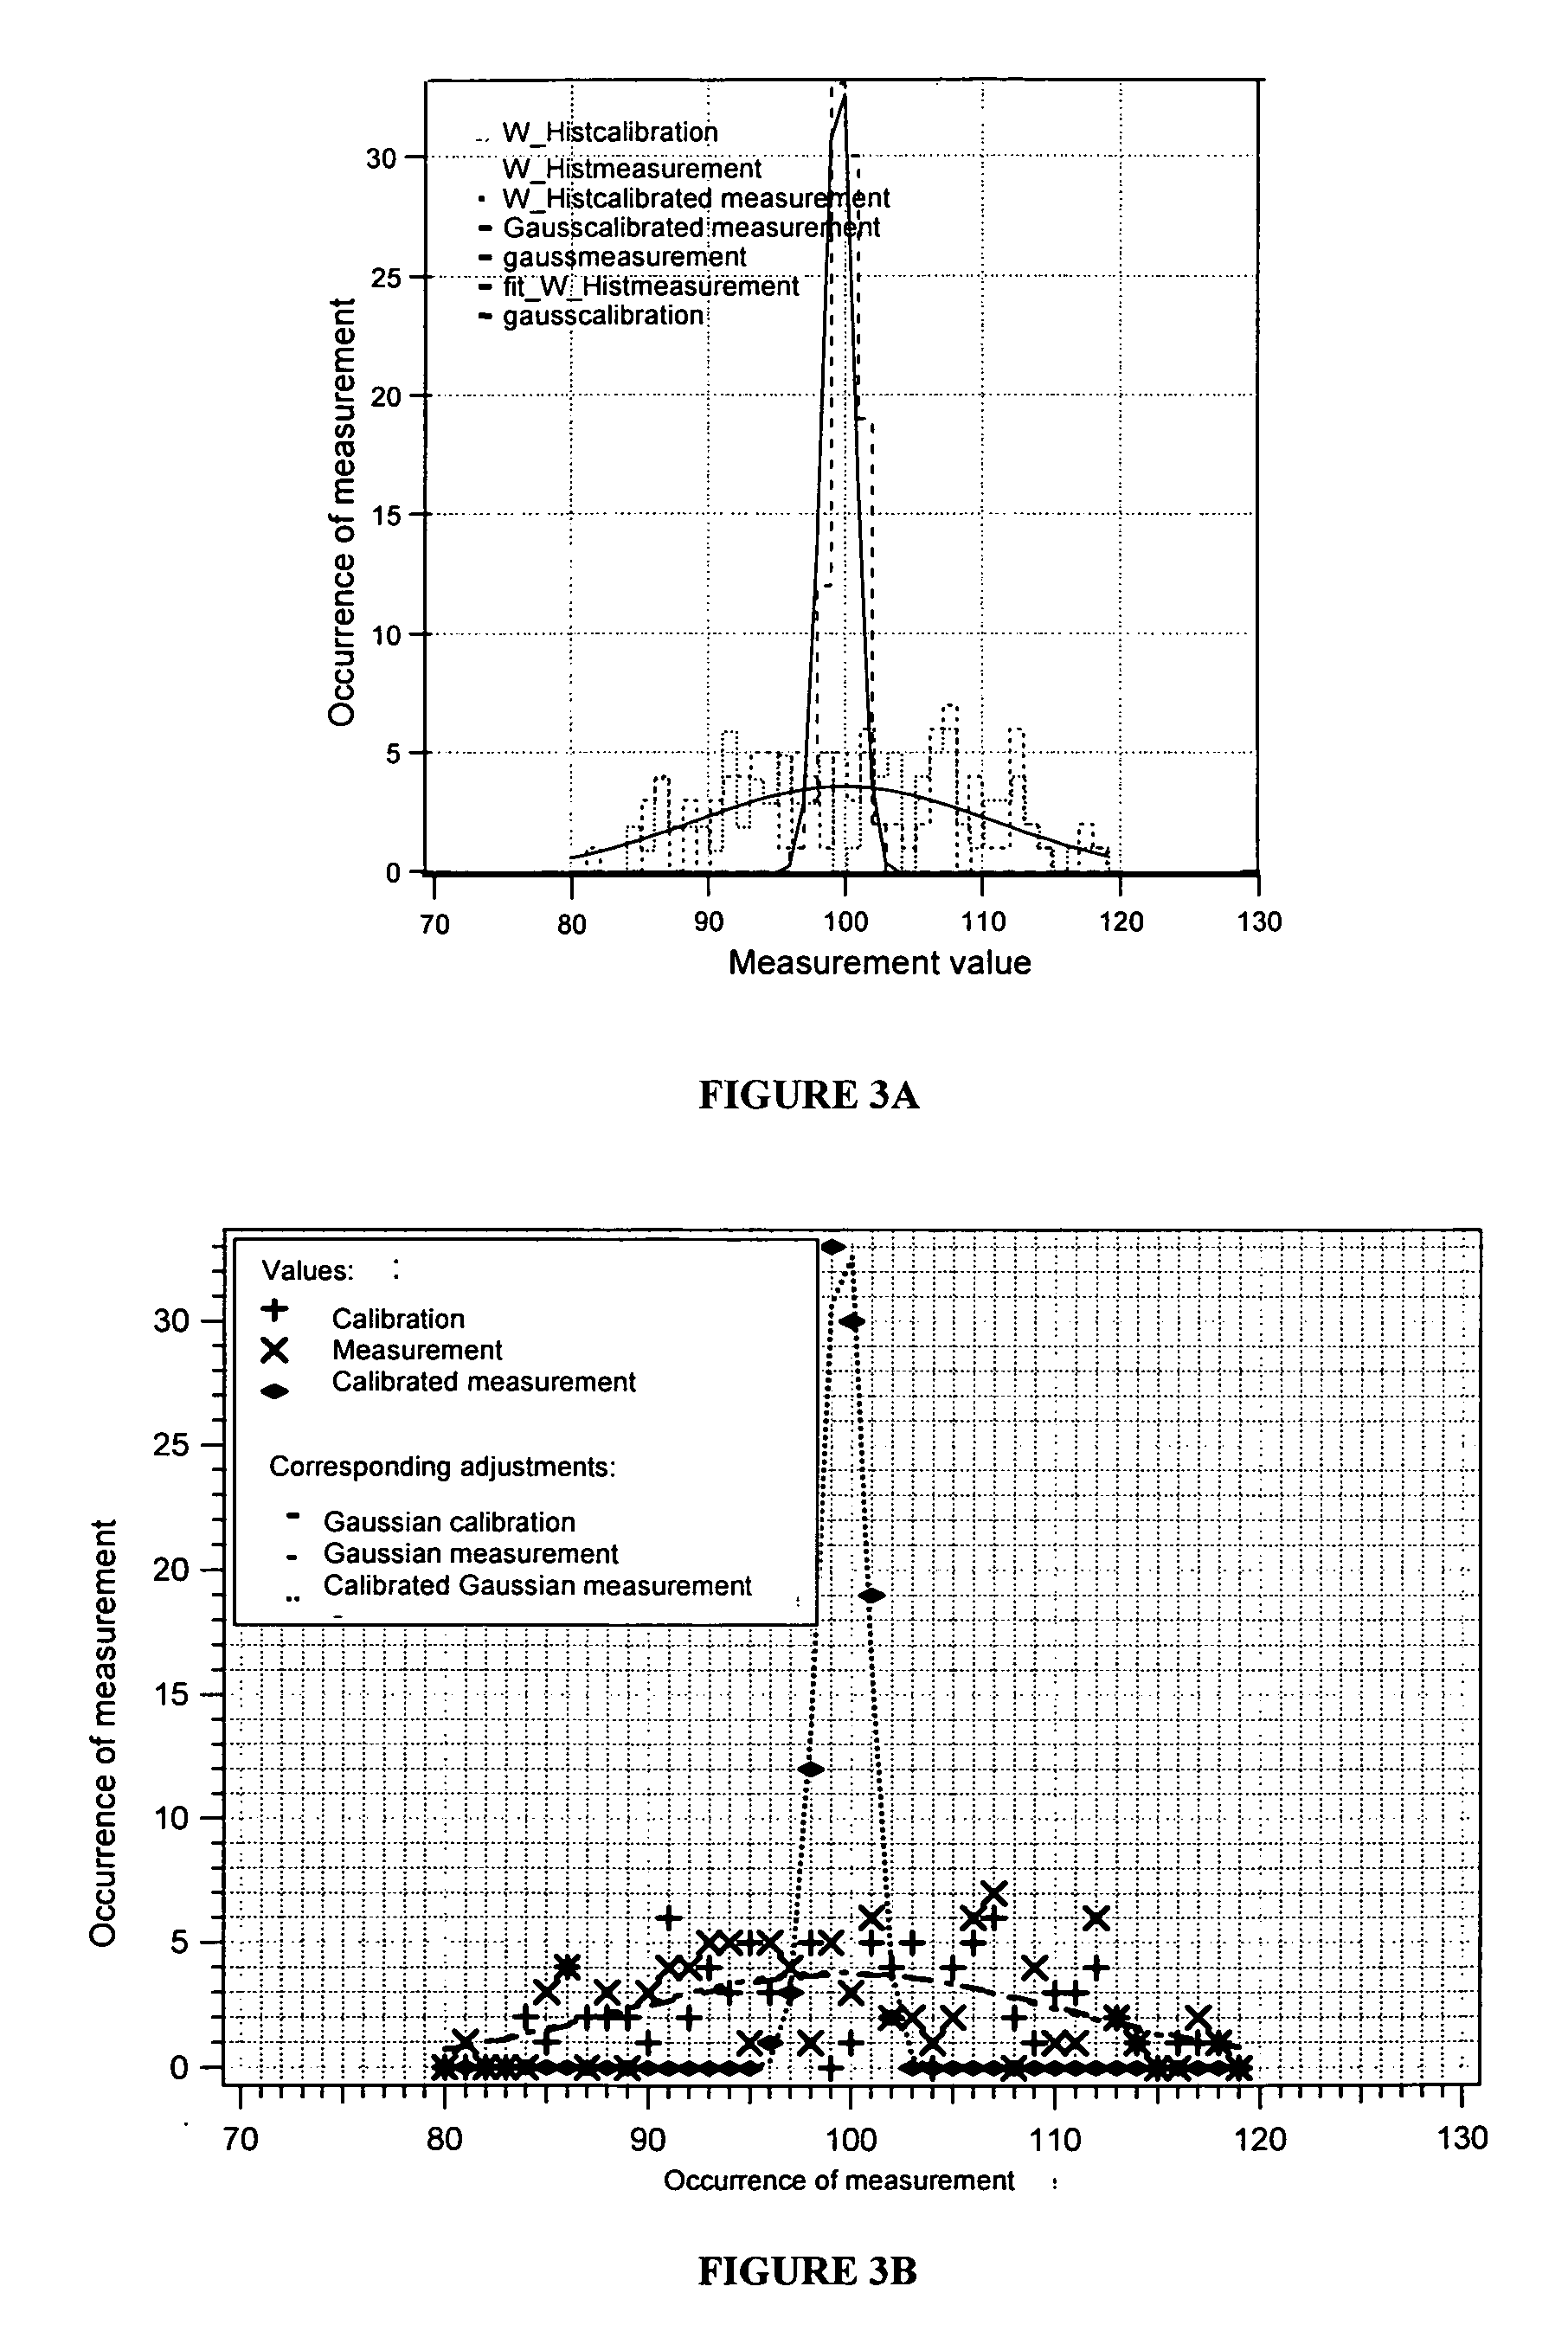
[0157]B) Histogram of raw measurements corrected by calibration measurements
[0158]See FIGS. 3A and 3B
[0159]The histograms corresponding to...
PUM
| Property | Measurement | Unit |
|---|---|---|
| Length | aaaaa | aaaaa |
| Molar ratio | aaaaa | aaaaa |
| Transparency | aaaaa | aaaaa |
Abstract
Description
Claims
Application Information
 - R&D
- Intellectual Property
- Life Sciences
- Materials
- Tech Scout
- Unparalleled Data Quality
- Higher Quality Content
- 60% Fewer Hallucinations
Browse by: Latest US Patents, China's latest patents, Technical Efficacy Thesaurus, Application Domain, Technology Topic, Popular Technical Reports.
© 2025 PatSnap. All rights reserved.Legal|Privacy policy|Modern Slavery Act Transparency Statement|Sitemap|About US| Contact US: help@patsnap.com


