

Method for hematology analysis
a hematology and analysis method technology, applied in the field of hematology analysis, can solve the problems of insufficient strength, artificially low white blood cell counts, and difficulties in the detection of red blood cells and white blood cells, and achieve the effects of reducing the complexity of hematology analyzers, reducing the overall cost, and reducing the error frequency of hematology analyzers
- Summary
- Abstract
- Description
- Claims
- Application Information
AI Technical Summary
Benefits of technology
Problems solved by technology
Method used
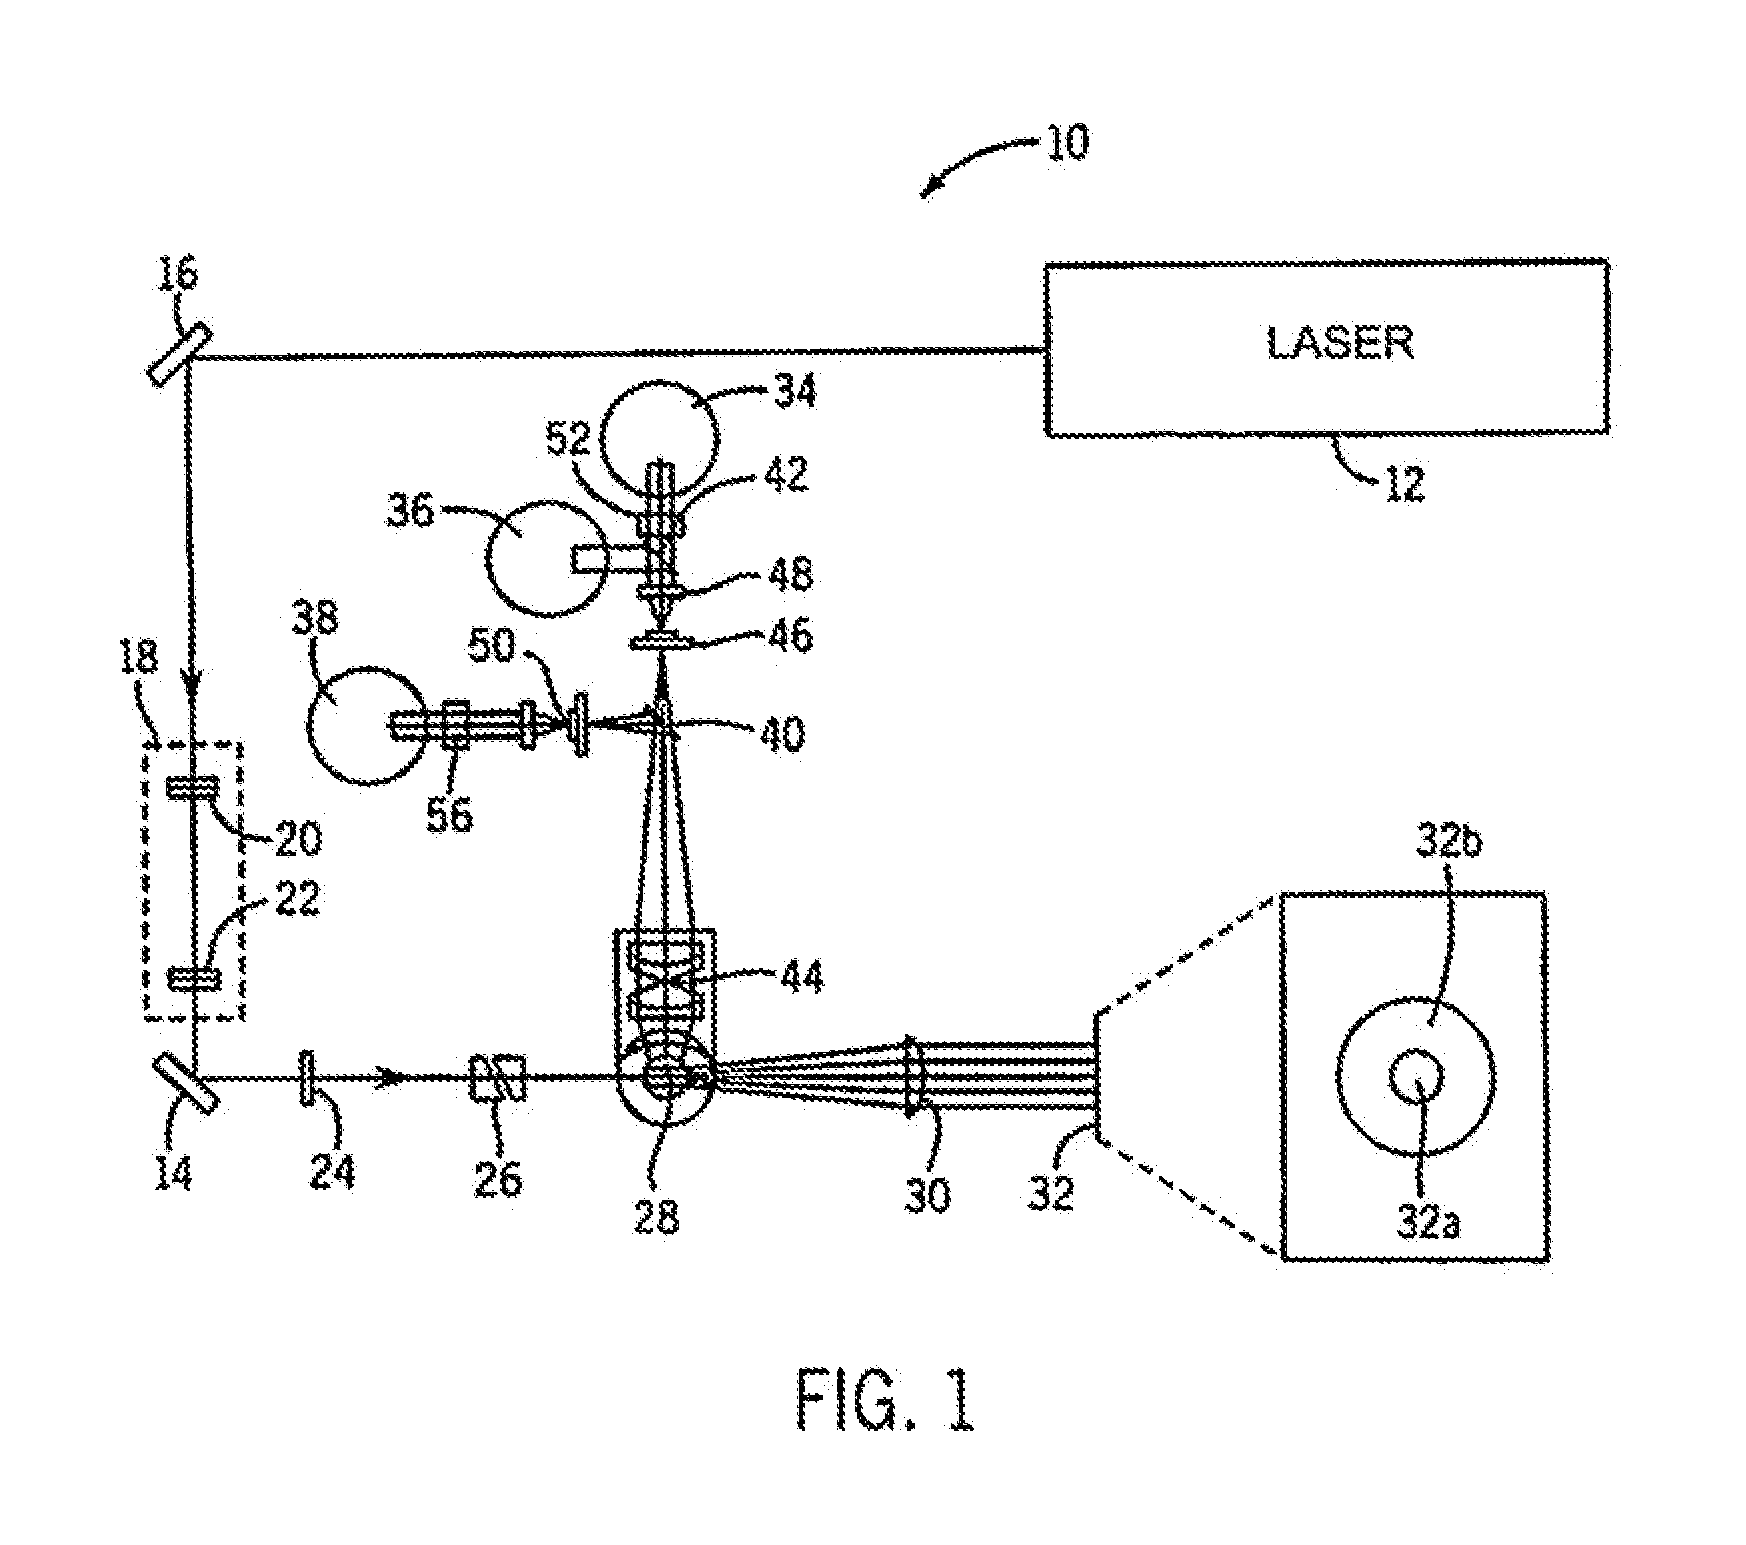
Image

Examples
example 1
[0078]This example illustrates the capture of white blood cells and bright platelet events by means of a fluorescent trigger, following interactions of the sample of blood with dye molecules.
[0079]The following procedure, including apparatus, parameters, reagents, including diluents, was used for EXAMPLES 1-5, inclusive.
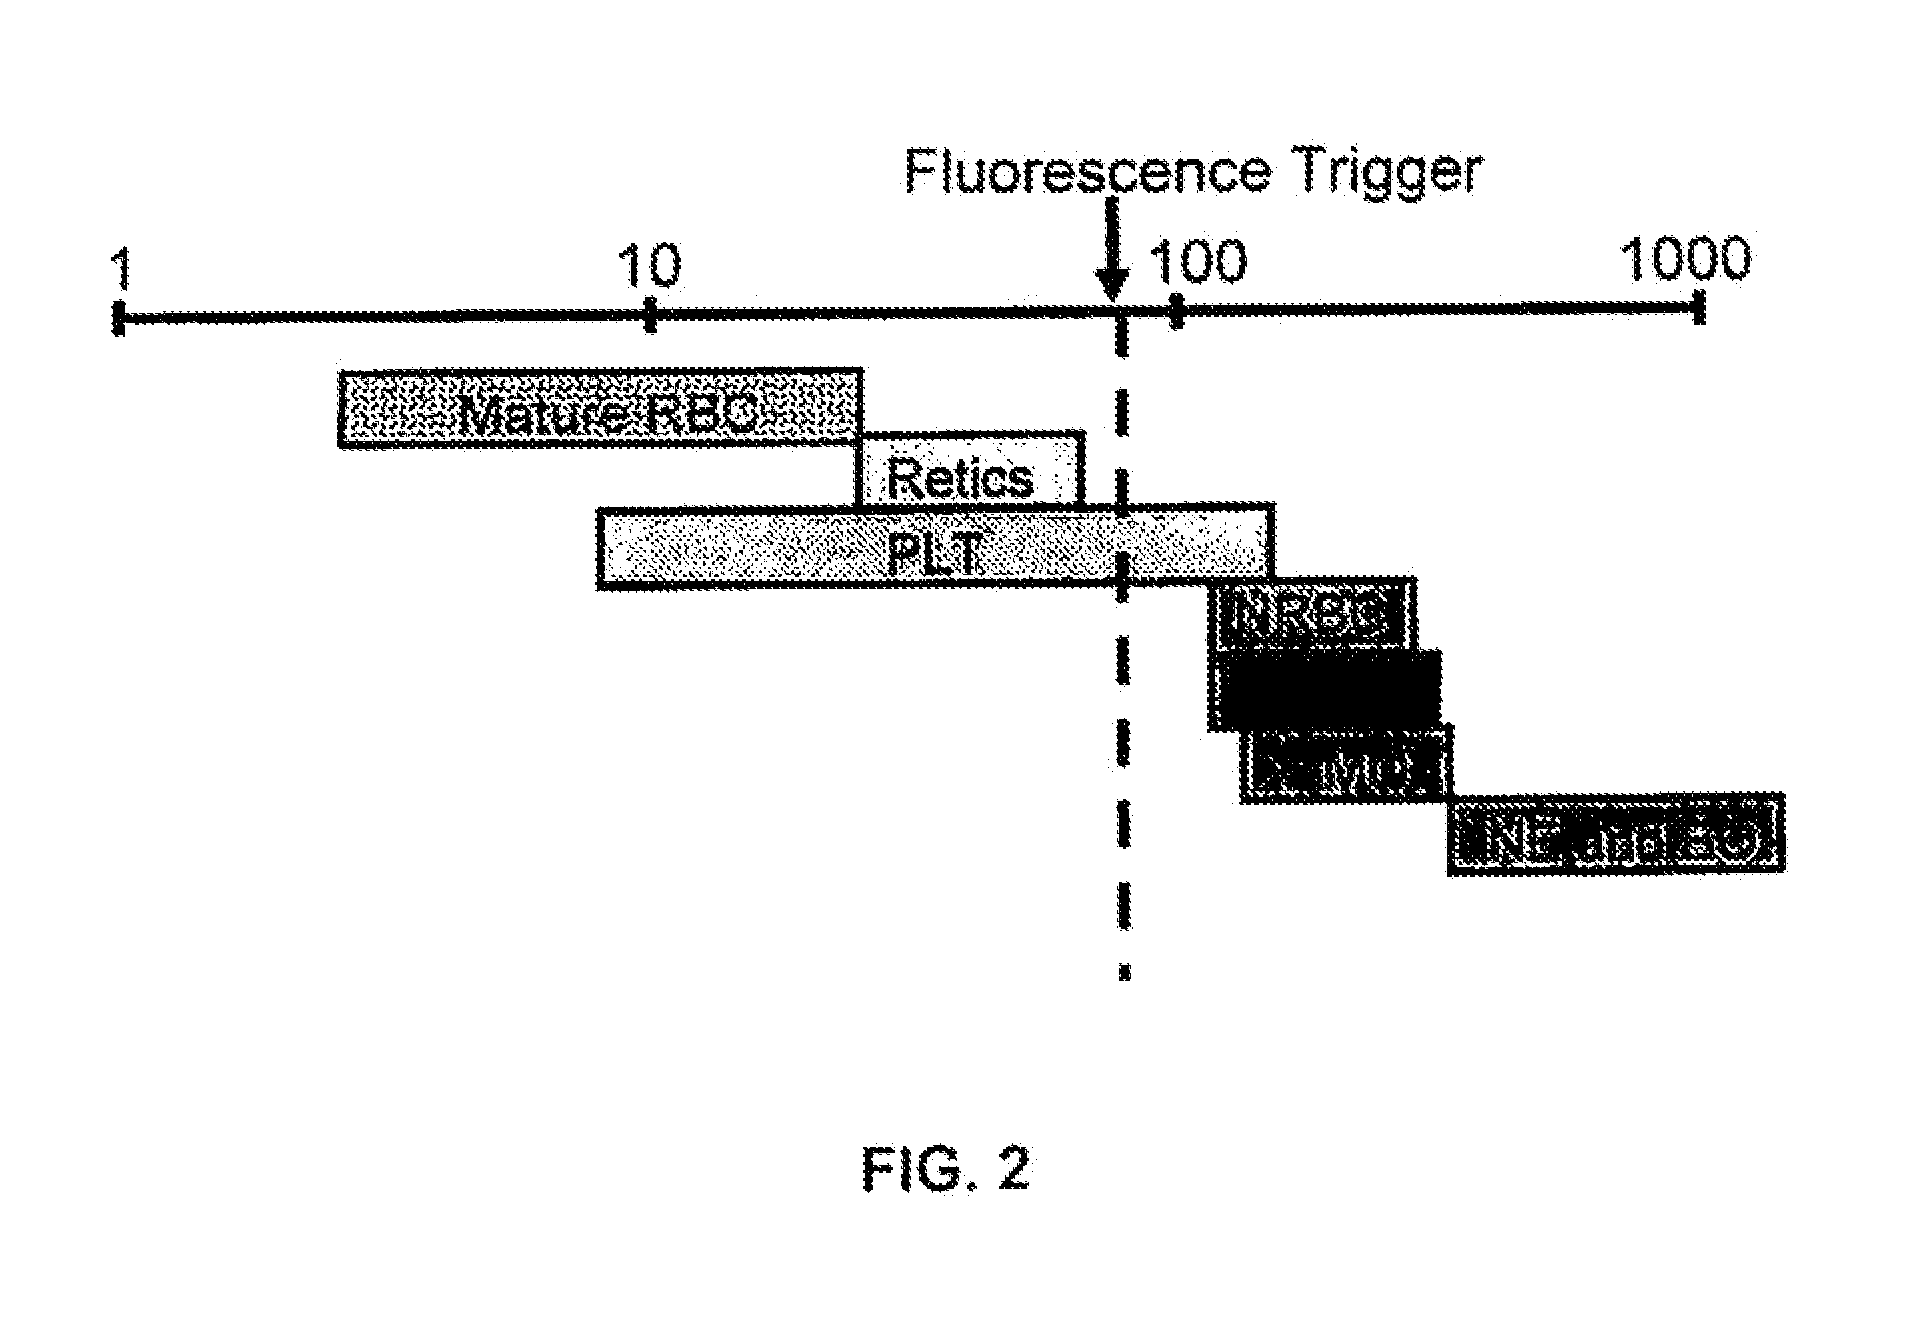
[0080]A fluorescent dye was used to stain and differentiate white blood cells (by means of DNA staining), nucleated red blood cells (by means of DNA staining), and reticulocytes (by means of RNA staining). A fluorescent trigger was used to generate two data blocks, thereby separating the highly fluorescent cells (white blood cells and nucleated red blood cells) from low fluorescent events (red blood cells and platelets). The first data block was used to analyze red blood cells, platelets, and reticulocytes. The second data block was used to identify white blood cells and nucleated red blood cells.
[0081]Each cell population was identified by means of a 407 nm flow cyt...
example 2
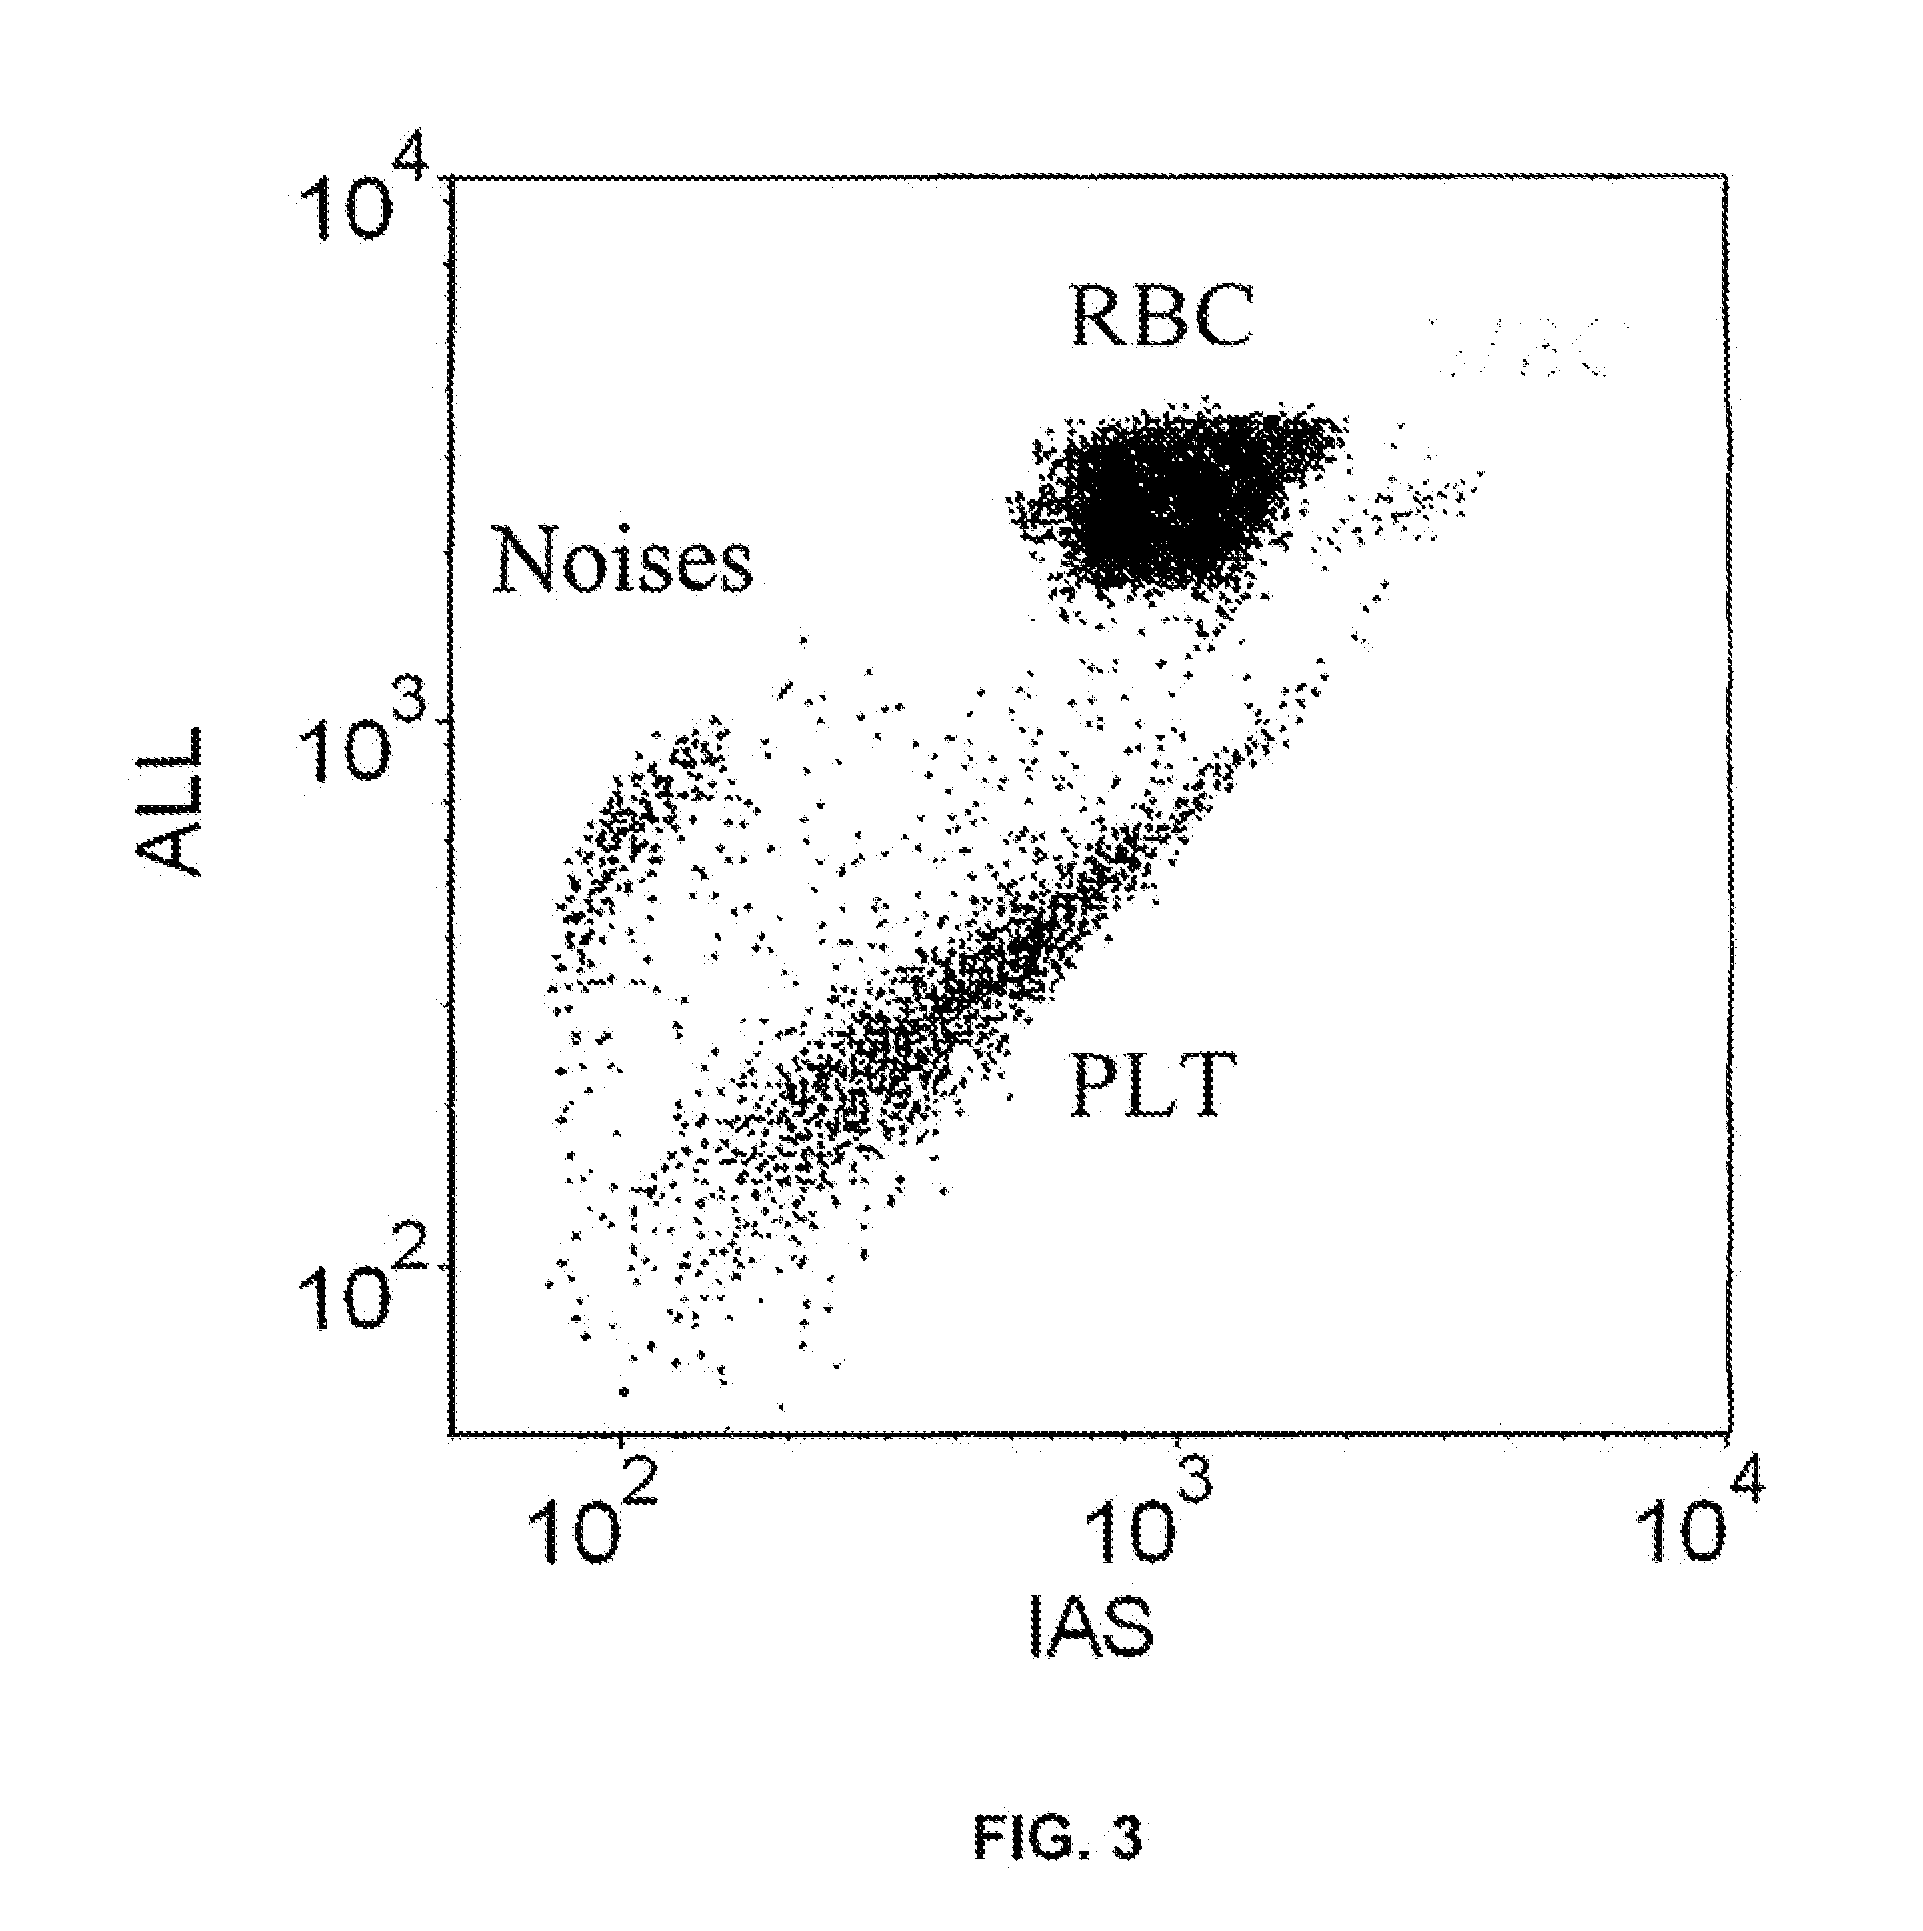
[0097]This example illustrates that the method described herein separates red blood cells and platelets from other components of a sample of blood. The sample set included 103 specimens of whole blood, namely, 35 normal samples, 68 abnormal samples, with 12 samples containing or suspected of containing nucleated red blood cells. Two runs were carried out for each sample of blood; CELL-DYN® Sapphire™ hematology analyzer was used as the primary reference, i.e., to determine to what degree the method described herein compares with a hematology analyzer that requires a lysing agent.
[0098]The apparatus, diluent, fluorescent dye, preparation of the sample, and conditions for measurement were the same as that described in EXAMPLE 1.
[0099]The plot in FIG. 5 illustrates the correlation between the CELL-DYN® Sapphire™ hematology analyzer and a hematology analyzer using the method described herein for counting red blood cells. The slope of the best linear fit was 0.899 (R2=0.933). The approxim...
example 3
[0101]This example illustrates the analysis of a white blood cell differential. The apparatus, diluent, fluorescent dye, preparation of the sample, and conditions for measurement were the same as that described in EXAMPLE 1.
[0102]The data, triggered by fluorescent signals (FL), were collected in 20 seconds for all events having a fluorescent signal (FL) higher than 75, including all white blood cells, nucleated red blood cells, if there were any, and a small fraction of bright platelets. 8586 white blood cell events, equivalent to a white blood cell count of 6.48×10³ white blood cells / μL, were captured for a specimen of whole blood having a white blood cell count of 6.29×10³ white blood cells / μL (based on the reference value from a CELL-DYN® Sapphire™ hematology analyzer). The subpopulations of white blood cells, including neutrophils, lymphocytes, monocytes, and eosinophils, were analyzed by means of the signals obtained from a plurality of optical channels.
[0103]The cytogram of FI...
PUM
| Property | Measurement | Unit |
|---|---|---|
| Nanoscale particle size | aaaaa | aaaaa |
| Nanoscale particle size | aaaaa | aaaaa |
| Nanoscale particle size | aaaaa | aaaaa |
Abstract
Description
Claims
Application Information