
GC Wave Correction for Array-Based Comparative Genomic Hybridization

a comparative genomic and array-based technology, applied in the field of gc wave correction for array-based comparative genomic hybridization, can solve the problems of limited g-banded karyotyping protocols, fish cannot assess dna copy number aberrations, and significant limitations, so as to reduce false positives, increase the sensitivity of cgh-based diagnosis, and effectively correct the

Inactive Publication Date: 2012-02-09
ESOTERIX GENETIC LAB
View PDF0 Cites 1 Cited by
  • Summary
  • Abstract
  • Description
  • Claims
  • Application Information

AI Technical Summary

Benefits of technology

[0008]The present invention provides improved methods of CGH data analysis that significantly reduce false positives and, as a result, increase sensitivity in CGH-based diagnosis of diseases, disorders, or conditions associated with genomic aberrations. The present methods rely on the discovery that GC waves can be effectively corrected for by adjusting the log ratios of the probes on each chromosome based on the chromosome's GC content in combination with selected chromosomal median adjustment.

Problems solved by technology

These aberrations either directly cause the diseases, or predispose the individuals with such aberrations to the diseases.
Although these technologies are reliable for detecting clinically relevant genomic imbalances, they also have significant limitations.
Current G-banded karyotyping protocols are limited by a detection resolution of about 3-5 Mb for detecting deletions throughout the genome.
FISH can only assess DNA copy number aberrations in specific targeted loci and also has resolution limitations of 100 kb-1 Mb, depending on many factors including genomic location.
The currently available aCGH techniques still have noteworthy limitations.
For example, certain genome-wide artefacts commonly known as “GC waves” (which may be due to the guanine / cytosine (GC) content of the probes used in cCGH) can cause the log ratio to deviate from its expected value resulting in false positives.
GC-waves can add large scale variability to the probe signal ratios and interfere with data analysis algorithms as they can skew signal logarithmic ratio data away from expected values.
However, that method is not applicable in the presence of larger aberrations which are often seen clinically.
Each of these methods is effective in reducing GC-wave patterns in some capacity, but these approaches generally require some a priori understanding of expected aCGH results, and in all cases, can lead a loss of sensitivity.
While these approaches may be appropriate for discovery purposes or in certain cases where many aberrations are present, such as cancer samples, these methods are generally not suited for a clinical aCGH setting, as an algorithmic correction needs to be universally applicable and maintain assay sensitivity and specificity, with no prior knowledge or expectation of results in a particular sample.

Method used


Image

  • GC Wave Correction for Array-Based Comparative Genomic Hybridization
  • GC Wave Correction for Array-Based Comparative Genomic Hybridization
  • GC Wave Correction for Array-Based Comparative Genomic Hybridization

Examples


example 1

Array-Based Comparative Genomic Hybridization

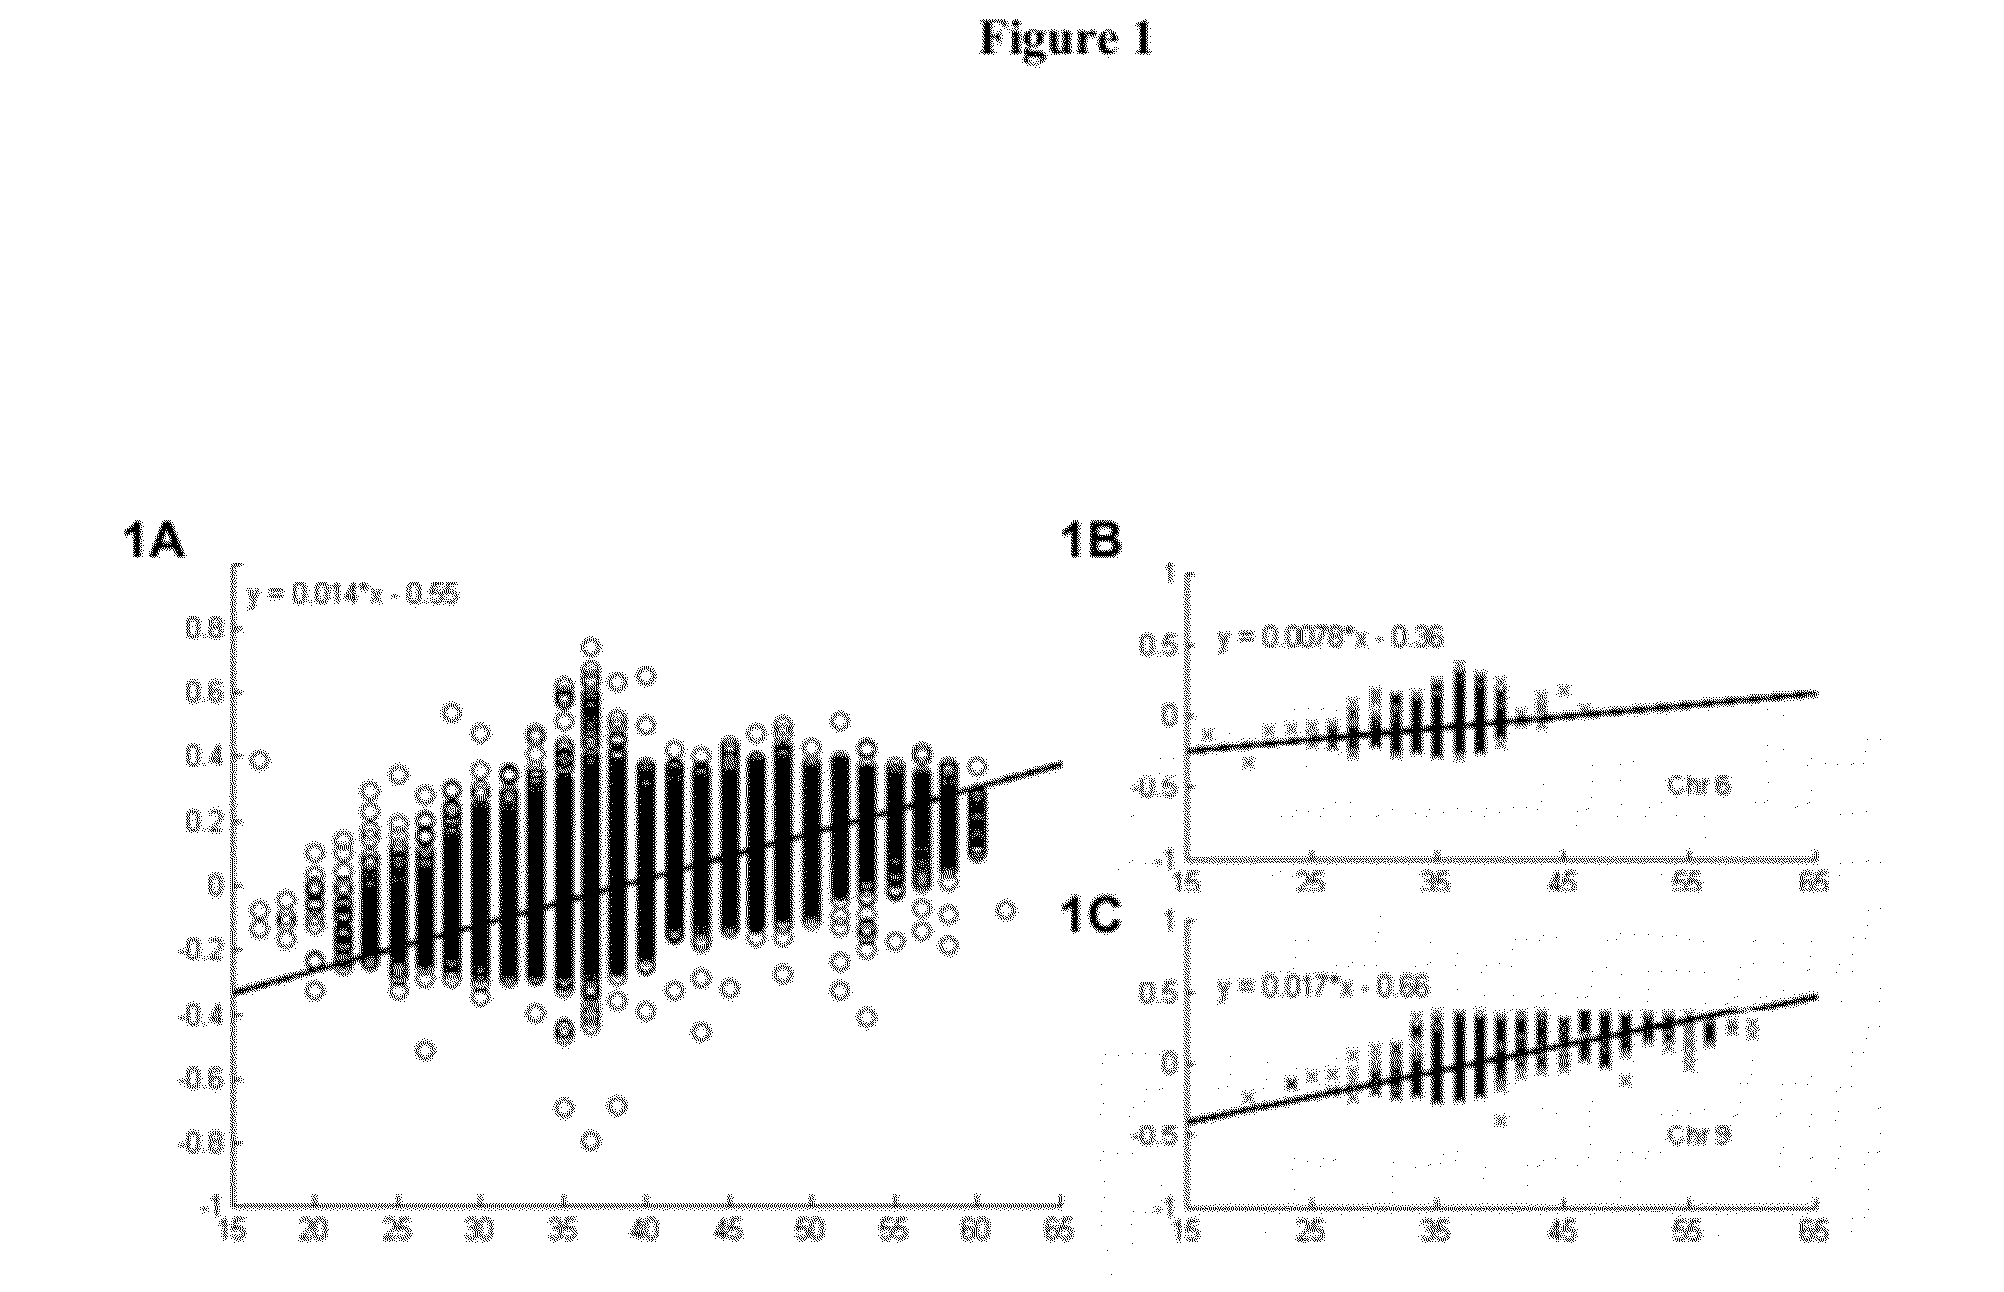
[0147]Microarray-based CGH (aCGH) techniques have revolutionized the field of chromosomal structural variation detection. They are capable of higher resolution than karyotyping, FISH (fluorescence in situ hybridization), SKY (spectral karyotyping) and other techniques and are particularly useful for detection of copy number changes in genetic disorders. In this example, a 60-mer oligonucleotide array was synthesized in situ using inkjet technologies. This array was designed to cover the entire genome with greatly enhanced coverage at known clinically relevant regions. Clinical samples were tested for known microdeletion and / or microduplication syndromes, all subtelomeric and pericentromeric regions, and other clinically significant genomic imbalances covered by the array.

[0148]The array was 4×44K format; that is, there were 4 arrays per slide with approximately 44,000 probes per array. (In another embodiment, the results of which are show...

example 2

Selection of Anchor Chromosomes

[0164]In this example, a set of anchor chromosomes were determined based on archived log ratio values from 27 historical samples obtained using a pre-determined platform and under predetermined assay conditions. Specifically, data from 27 samples run under the same conditions were extracted and GC correction was performed using the algorithm described above. For each sample, the median log ratio of each chromosome after correction was recorded. Table 4 shows GC corrected median log ratio values for 22 autosomal chromosomes from 27 samples.

TABLE 4Exemplary GC corrected median log ratio valuesSampleChr 1Chr 2Chr 3Chr 4Chr 5Chr 6Chr 7Chr 8Chr 9Chr 10Chr 111−0.00514−0.00484−0.0093−0.0157−0.00949−0.00553−0.00936−0.0077−0.00184−0.00212−0.002562−0.00898−0.02096−0.03315−0.04359−0.03631−0.0333−0.01527−0.0259−0.01102−0.0039−0.006763−0.01361−0.02939−0.04415−0.05731−0.04593−0.05084−0.01928−0.03381−0.00869−0.00419−0.008754−0.00654−0.021−0.0337−0.03271−0.04378−0.035...

example 3

Determination of Anchor Values

[0166]To derive chromosomal adjustment values, anchor values were first calculated for the anchor chromosomes chosen in Example 2. As described above, the anchor value a1 for a particular anchor chromosome j was determined by comparing the median log ratios of anchor chromosome j to the median log ratios of the “most skewed” anchor chromosome, i.e., the anchor chromosome whose median log ratio was most skewed from 0. In this example, chromosome 19 was identified as the “most skewed” anchor chromosome. Median log ratio values (after correction) for a given anchor chromosome (e.g., chromosome 3) were then plotted against the median log ratio values of chromosome 19 for the 27 samples. The anchor value for the given chromosome (e.g., chromosome 3) was then defined as the slope of the trend line (calculated using robust regression) from the datasets. This process was repeated for all other anchor chromosomes to obtain the set of anchor values. The anchor va...


PUM

PropertyMeasurementUnit
thresholdaaaaaaaaaa

Abstract

The present invention provides, among other things, new methods for optimizing comparative genomic hybridization (CGH) data analysis. In particular, the methods of the invention provide increased sensitivity and specificity due to the implemented individual chromosome-based GC-wave correction. In certain embodiments, the log ratios of probes derived from each chromosome are corrected based on the chromosome's GC content slope, and certain selected chromosomes undergo chromosomal median adjustment. As a result, the log ratios of the probes on the array are normalized to be closer to zero (0) for diploid regions and thus, the GC waves are substantially reduced, resulting in a reduced false positive rate. Systems, computer readable media, and kits for use in the optimized CGH methods also are provided.

Description

PRIOR RELATED APPLICATIONS[0001]This application claims priority to U.S. Provisional Application No. 61 / 329,264, filed Apr. 29, 2010, and U.S. Provisional Application No. 61 / 362,491, filed Jul. 8, 2010, both of which are hereby incorporated by reference in their entirety.BACKGROUND[0002]Many diseases, such as various cancers, associated with chromosomal imbalance (e.g., Patau syndrome, Down's syndrome, etc.), and certain immunological and neurological diseases are caused by genomic aberrations, including deletion, inversion, duplication, multiplication, chromosomal translocation and other rearrangements, and point mutation. These aberrations either directly cause the diseases, or predispose the individuals with such aberrations to the diseases. Individuals carrying such aberrations may be suffering from the diseases, be at risk of developing the diseases, or may be carriers for the diseases. In addition, the presence of certain aberrations determines the outcome of certain disease c...

Claims


Application Information

Patent Timeline
Patent Type & Authority Applications(United States)
IPC IPC(8): G06F19/18G16B25/00G16B25/10
CPCC12Q1/6809C12Q1/6832G16B25/00C12Q2537/16C12Q2537/165C12Q2539/115G16B25/10
Inventor AKMAEV, VIATCHESLAV R.LEO, ANGELASCHOLL, THOMAS
Owner ESOTERIX GENETIC LAB
Learn More