
Methods for PCR and HLA typing using unpurified samples

a technology of pcr and hla, applied in combinational chemistry, biochemistry apparatus and processes, library screening, etc., can solve the problems of complex and costly lims systems, workflows that require the effort of a full molecular genetics laboratory, and complex workflows

Active Publication Date: 2012-05-17
GENOMICS USA
View PDF1 Cites 8 Cited by
  • Summary
  • Abstract
  • Description
  • Claims
  • Application Information

AI Technical Summary

Benefits of technology

[0030]FIG. 13 shows Correlation of Microarray Data: Raw vs. Purified DNA Samples: HLA-A. Microarray image data, obtained from microarrays have been analyzed to generate the integrated intensity for each of the microarray probe spots. Such microarrays are manufactured with probes printed in triplicate. For the data, the numerical average of those simple repeats has been used for analysis. The data are presented as scatter plots, where the Y-axis comprises microarray probe intensity data for each probe, obtained from hybridization to purified DNA samples that had been extracted from each of the several sample types. The X-axis comprises the microarray hybridization data obtained from the corresponding matched raw samples: i.e. each data point on such scatter plots corresponds to an ordered pair [x,y] obtained from a single microarray probe, for two matched sample types [raw, purified DNA]. These data have been fit to a simple linear regression [y=m×+b] to yield a slope (m) and intercept (b) and a squared linear correlation coefficient R2. 6 sets of purified vs. raw samples have been analyzed: buccal swabs, mouthwash, ORAGENE™ OG-510, ORAGENE™ OG-510 without heat treatment, ORAGENE™ ON-500, ORAGENE™ ON-500 with heat treatment. Data have been displayed for only one of the 12 volunteers (A6). FIG. 13 corresponds to HLA-A microarray data from A6.
[0031]FIG. 14 shows Correlation of Microarray Data: Raw vs. Purified DNA Samples: HLA-B. Microarray image data, obtained from arrays have been analyzed to generate the integrated intensity for each of the microarray probe spots. Such microarrays are manufactured with probes printed in triplicate. For the data, the numerical average of those simple repeats has been used for analysis. The data are presented as scatter plots, where the Y-axis comprises microarray probe intensity data obtained from purified DNA samples that had been extracted from each of the several sample types.

Problems solved by technology

However, the newer HLA-based applications each involve a patient base that is at least 100-times greater than defined by organ transplantation and entail medical treatments which are approximately 100-times less expensive than transplantation.
Thus, the resulting workflow requires the effort of a full molecular genetics laboratory, and at least one full day to compile the final HLA-typing data.
The complexity of such a standard workflow also introduces major concerns related to chain-of-custody and the requirement for complex and costly LIMS systems and workflow standard operating procedures, to keep track of sample flow through the several processing and analysis workstations.
Previous attempts to perform PCR amplification from unpurified blood have been problematic even with the availability of variants of the Taq polymerase used for standard PCR.
The use of raw blood as a PCR substrate has not yielded consistent results due to the extreme sample-to-sample variation in the white cell complement of blood and possible sample-to-sample variation in the very large excess of blood solutes which can interfere with the underlying PCR reaction.
However, the value of those inexpensive DNA sources is compromised, in part, by the cost and labor required to purify DNA from them, prior to genetic testing.
Specifically, the related art is deficient in a hands-free or automated, real-time high-resolution method of HLA typing without a need for first externally purifying the DNA from a sample.

Method used


Image

  • Methods for PCR and HLA typing using unpurified samples
  • Methods for PCR and HLA typing using unpurified samples
  • Methods for PCR and HLA typing using unpurified samples

Examples


example 1

Tandem PCR Yields Constant 2° Product Over Wide 1° Input Amounts

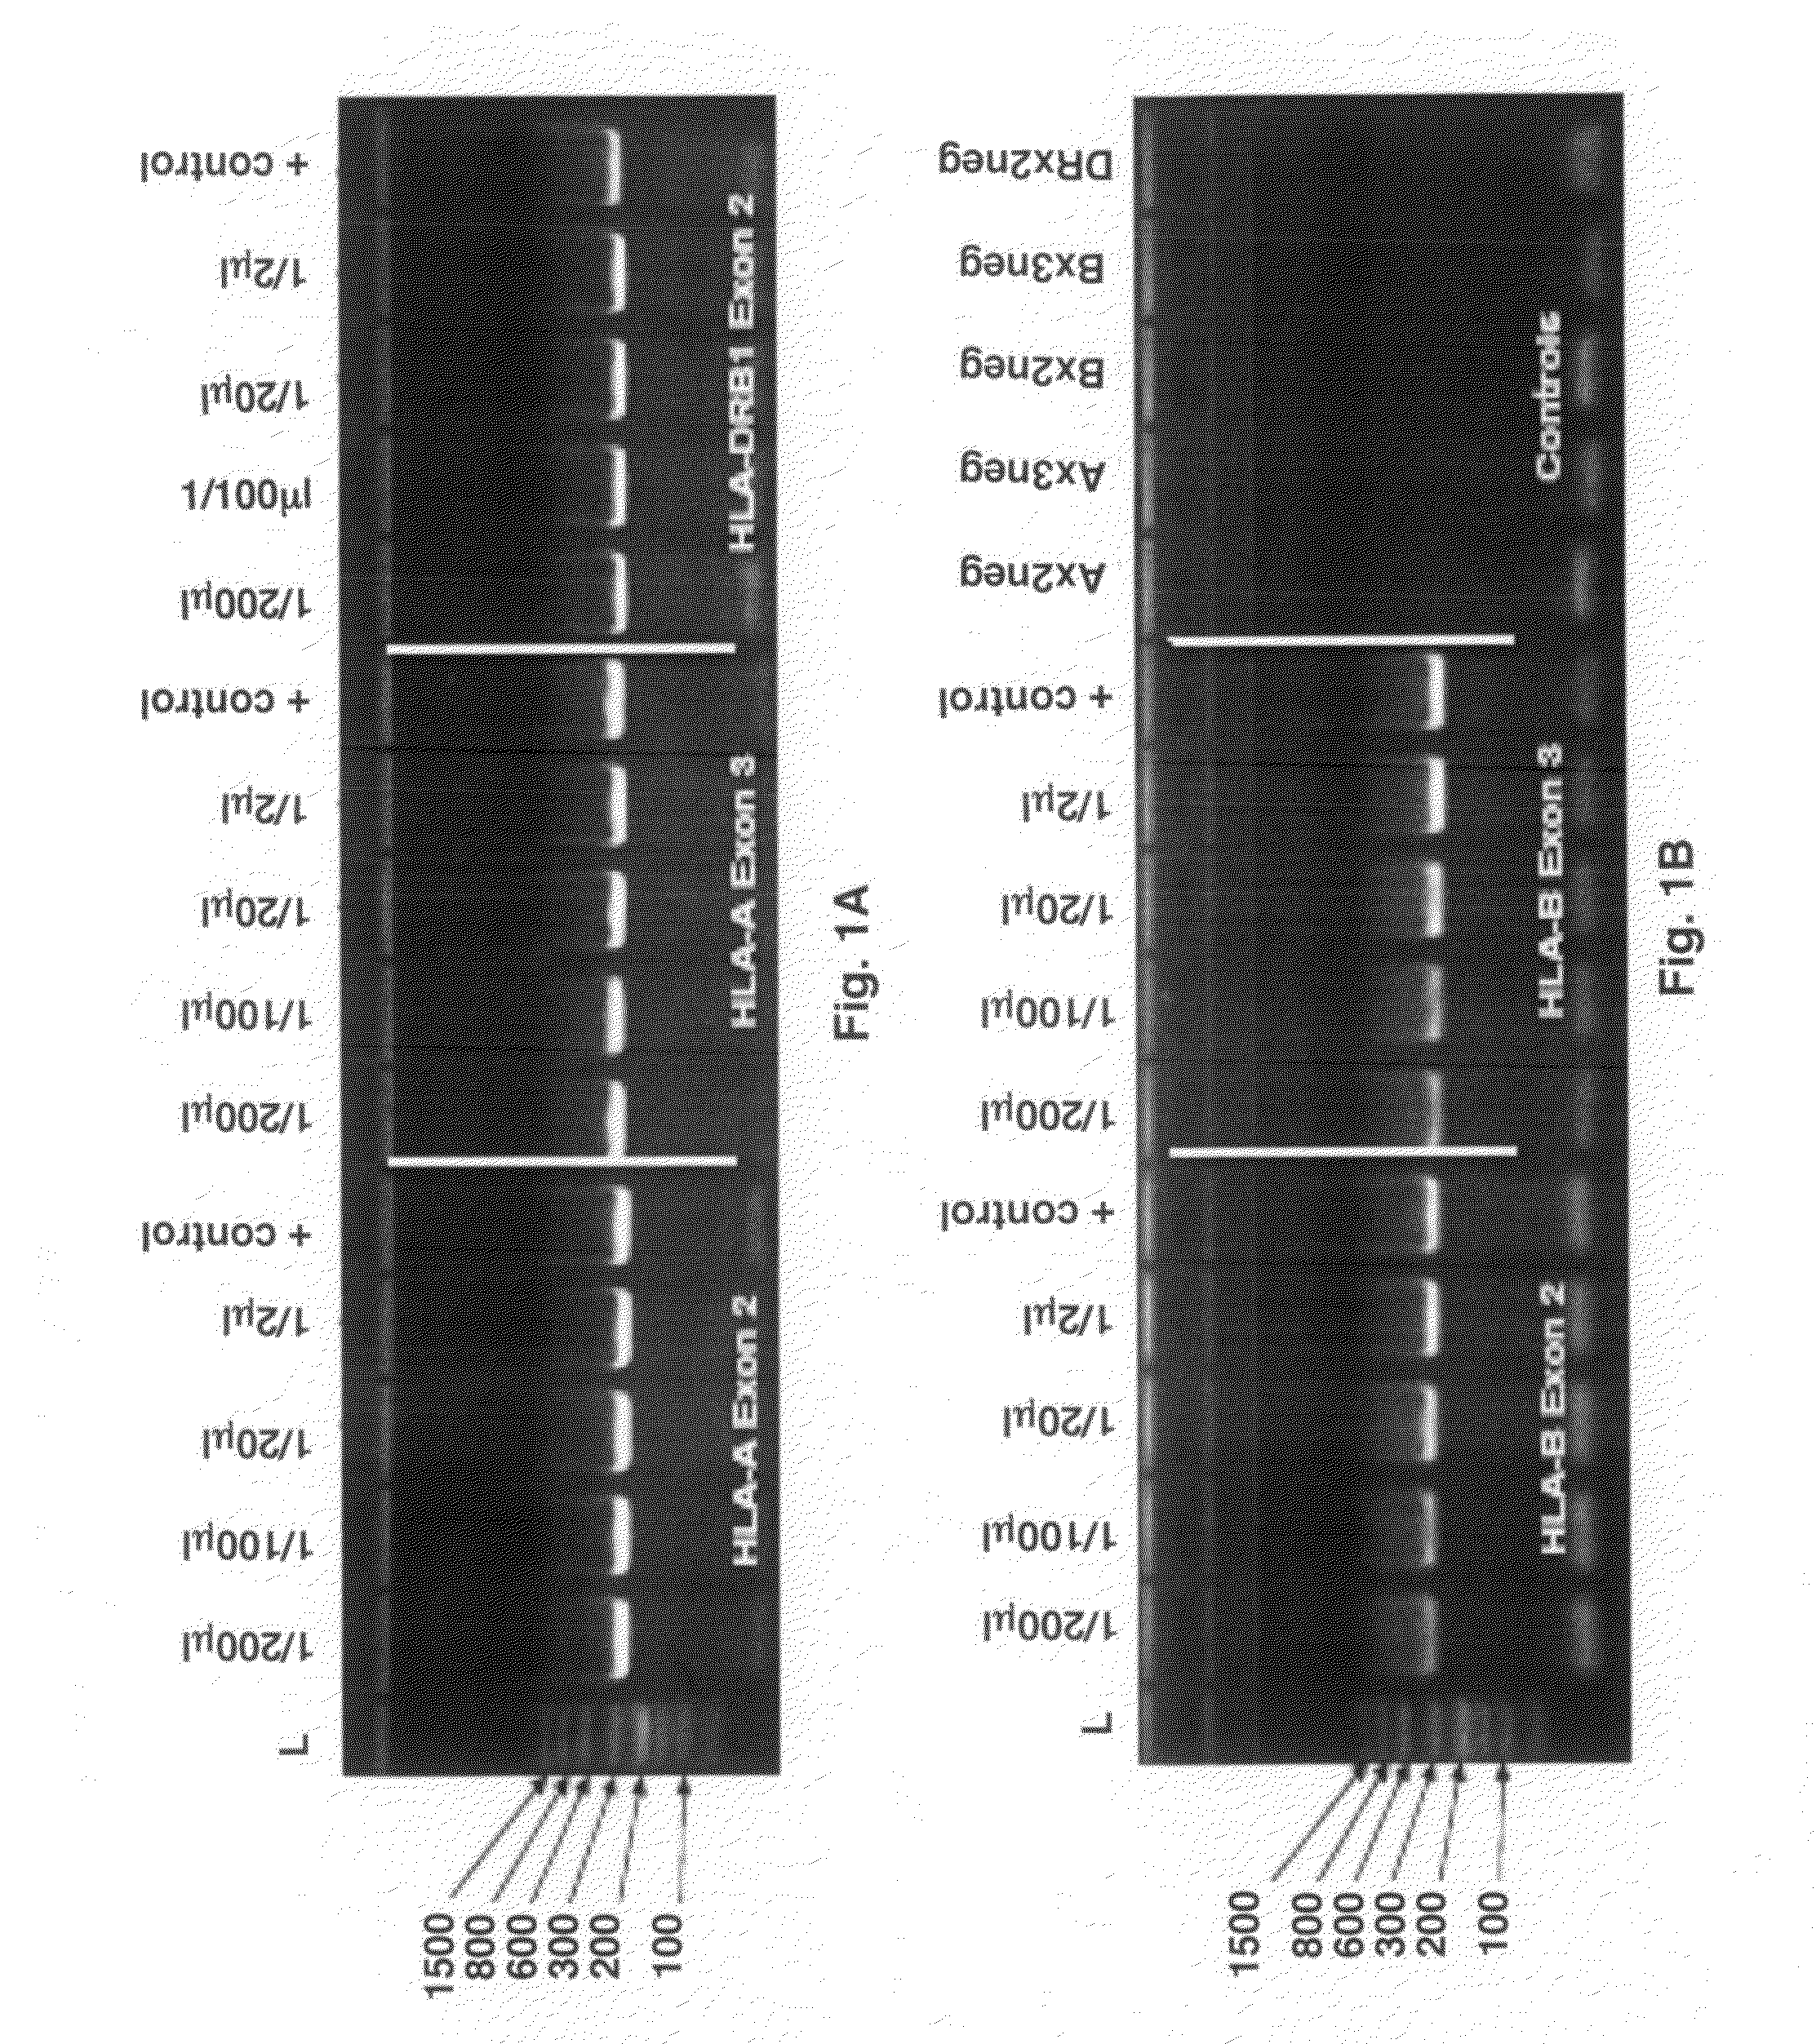
[0076]2 μl of raw blood was used as the template for the primary, locus-specific HLA PCR reactions required for HLA-Chip analysis. Amplification was performed via the Finnzymes PHUSION® Blood Direct kit. Different amounts of that primary, locus specific PCR product were then diluted in H2O and used as template for the secondary, self limiting, exon-specific PCR reactions. One microliter of each of the resulting 2° PCR reaction product was then loaded onto a standard acrylamide gel. HLA-A exons 2 and 3 and HLA-DRB1 exon 2 (FIG. 1A) and HLA-B exons 2 and 3 (FIG. 1B) were visualized by Amresco EZ-Vision DNA Dye. Positive controls on the gel refer to the product of the same tandem HLA PCR reactions, but instead using 10 ng of highly-purified Roche DNA as the original sample input. As seen, the amount of final 2° amplicon obtained from 2 μl of raw blood, is nearly independent of the amount of 1° amplicon used in the reaction...

example 2

Generation of HLA Locus-Specific Amplicons

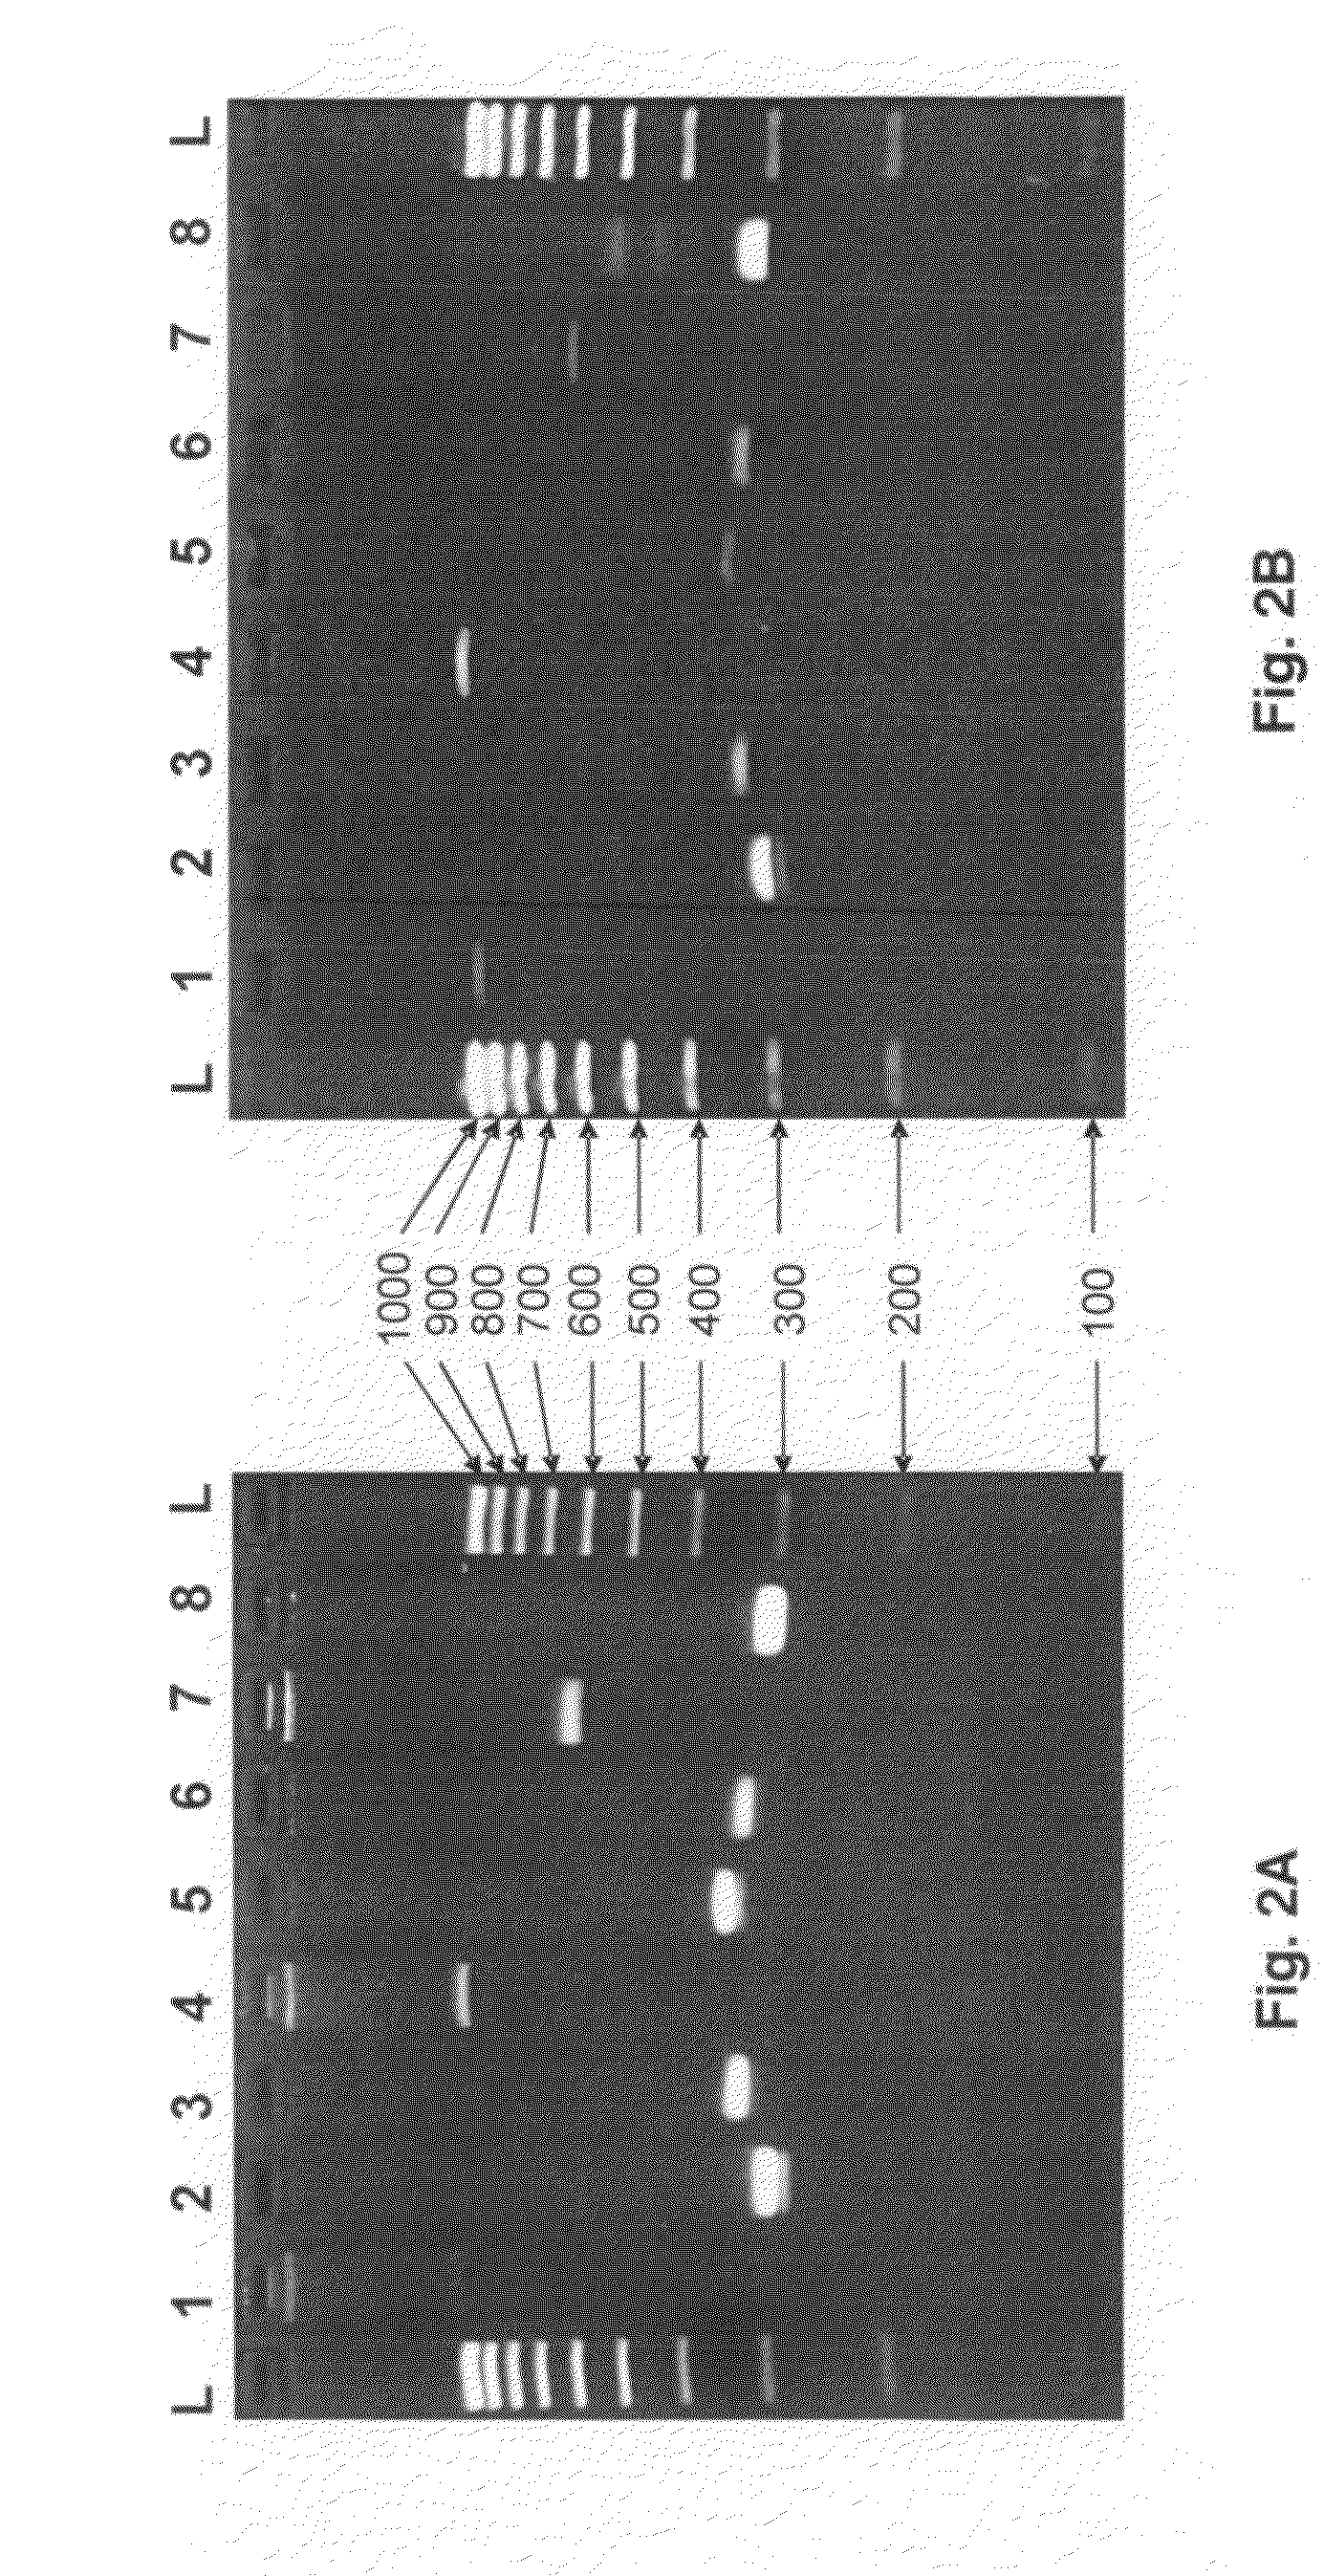
[0077]HLA locus-specific amplicons are generated from 2 μl whole fluid blood (FIG. 2A) via the PCR reaction using the PHUSION BLOOD DIRECT® kit commercially available from Finnzymes (Woburn, Mass.). Reaction conditions are as follows: 1× PHUSION® Blood PCR Buffer, 0.8 μl PHUSION® Blood DNA Polymerase, 1.75 mM EDTA, 400 nM each primer in a 20 μl reaction volume. Reactions are cycled using the following protocol: initial denaturing at 98° C. for 5 minutes followed by 35 cycles of i) denature at 98° C. for 5 seconds, ii) anneal at 70° C. for 5 seconds, and iii) extend at 72° C. for 30 seconds, and one final extension at 72° C. for 1 minute.

[0078]When amplifying HLA loci from purified DNA (FIG. 2B), 10 ng of genomic DNA is used as template for PCR using Roche (Basel, Switzerland) FastStart Taq DNA Polymerase under the following conditions: 1×PCR Buffer (without Mg++), 1.5 mM MgCl2, 0.16 mg / ml BSA (fraction V), 0.05 μM each dNTP, 400 nM each prim...

example 3

Lab-on-a-Chip Microarray Platform

[0089]The LoC microarray platform (In-Check™) system integrates PCR amplification and microarray detection processes for genetic testing in a single lab-on-a-chip. The system is designed for identification of complex nucleic-acid analytes, such as in HLA-typing, by integrating PCR amplification and hybridization on a single low-density microarray. The system is based on a technology that monolithically integrates a PCR micro-reactor fluidically connected with a hybridization reactor composed of a low-density microarray on a miniaturized silicon lab-on-chip (LoC).

PCR Module

[0090]The PCR module (In-Check™) has integrated silicon heaters, temperature sensor and miniaturized 25 μl volume which allow the PCR module to perform the rapid heating and cooling cycles required for highly reliable, end-point PCR. The PCR module is thermally driven by the temperature control system (TCS; In-Check™). The TCS allows fast and programmable temperature cycling in a wa...


PUM

PropertyMeasurementUnit
Electrical conductanceaaaaaaaaaa
Temperatureaaaaaaaaaa

Abstract

Provided are methods for amplifying a gene or RNA or sets thereof of interest using a tandem PCR process. The primers in the first PCR or set of PCR reactions are locus-specific. The primers in the second PCR or set of PCR reactions are specific for a sub-sequence of the locus-specific primers and completely consumed during the second PCR amplification. For RNA amplification, the first PCR is reverse transcription and the resulting cDNA(s) provide a template for cRNA synthesis, endpoint PCR or real time PCR. Also provided is a tandem PCR method which accepts raw, completely unpurified mouthwash, cheek swabs and ORAGENE™-stabilized saliva as the sample input, the resulting amplicons serving as the substrate for complex, microarray-based genetic testing. Also provided is a method of allelotyping a gene or set thereof by amplifying the gene(s) using tandem PCR on DNA or RNA comprising the sample.

Description

CROSS-REFERENCE TO RELATED APPLICATIONS[0001]This is a continuation-in-part of pending application U.S. Ser. No. 12 / 924,301 filed Sep. 24, 2010, which claims benefit of priority under 35 U.S.C. §119(e) of provisional application U.S. Ser. No. 61 / 281,404, filed Nov. 16, 2009, the entirety of which is hereby incorporated by reference.BACKGROUND OF THE INVENTION[0002]1. Field of the Invention[0003]The present invention relates to the fields of PCR and HLA-typing. More specifically, the present invention discloses methods and systems for a tandem PCR process to amplify DNA or RNA within a raw biological specimen and subsequent HLA-typing thereof on an individual or population scale in a field or medical office environment.[0004]2. Description of the Related Art[0005]There is a new and rapidly growing understanding of the medical significance of HLA typing in current medicine. Indeed, there is a very large range of diagnostic and public health applications for HLA-typing. Analysis of the...

Claims


Application Information

Patent Timeline
IPC IPC(8): C12Q1/68C12Q1/70C40B30/04
CPCC12Q1/6804C12Q1/686C12Q1/6881C12Q1/689C12Q2600/156C12Q2527/143C12Q2563/107C12Q2565/501C12Q2600/16
Inventor HOGAN, MICHAEL E.PADILLA, GEORGINA LOPEZMAY, MELISSA R.ABALOS, ANDREW T.EGGARS, FREDERICK H.O'BRIEN, KEVIN M.
Owner GENOMICS USA
Learn More