
Lumen Morphology and Vascular Resistance Measurements Data Collection Systems, Apparatus and Methods

a data collection system and vascular resistance technology, applied in image enhancement, angiography, instruments, etc., can solve the problems of unrecognized relationship of geometric measurements and clinically relevant variables, tedious, expensive, time-consuming,

Active Publication Date: 2013-03-21
LIGHTLAB IMAGING
View PDF5 Cites 68 Cited by
  • Summary
  • Abstract
  • Description
  • Claims
  • Application Information

AI Technical Summary

Benefits of technology

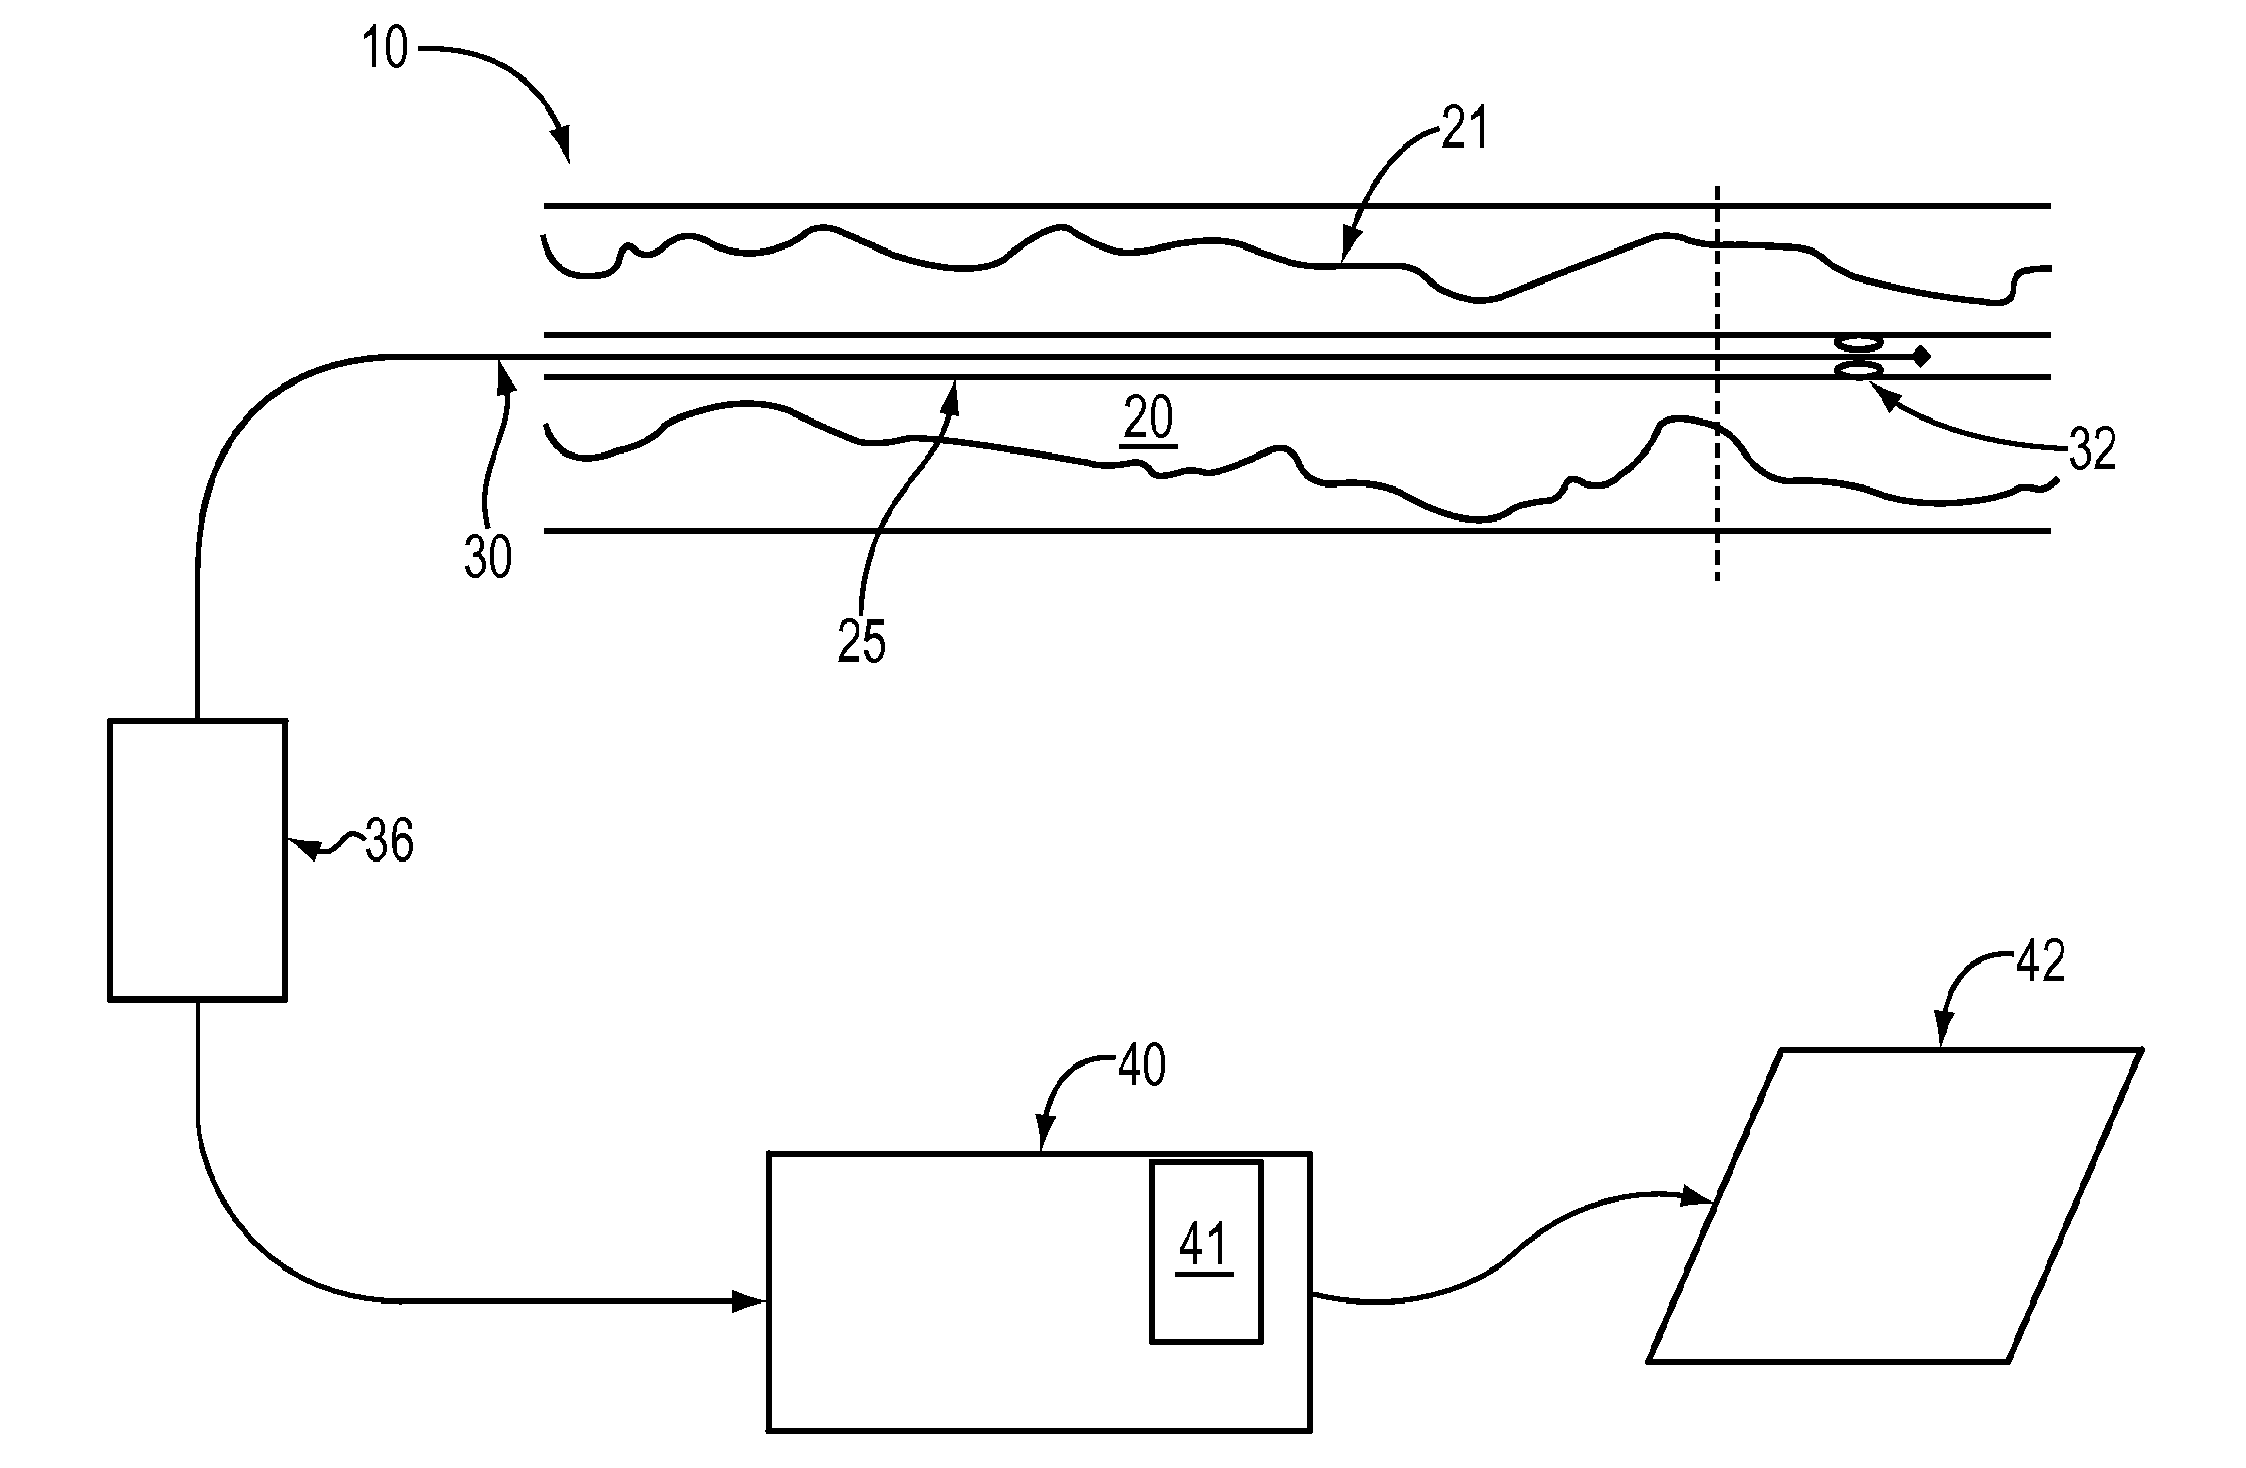
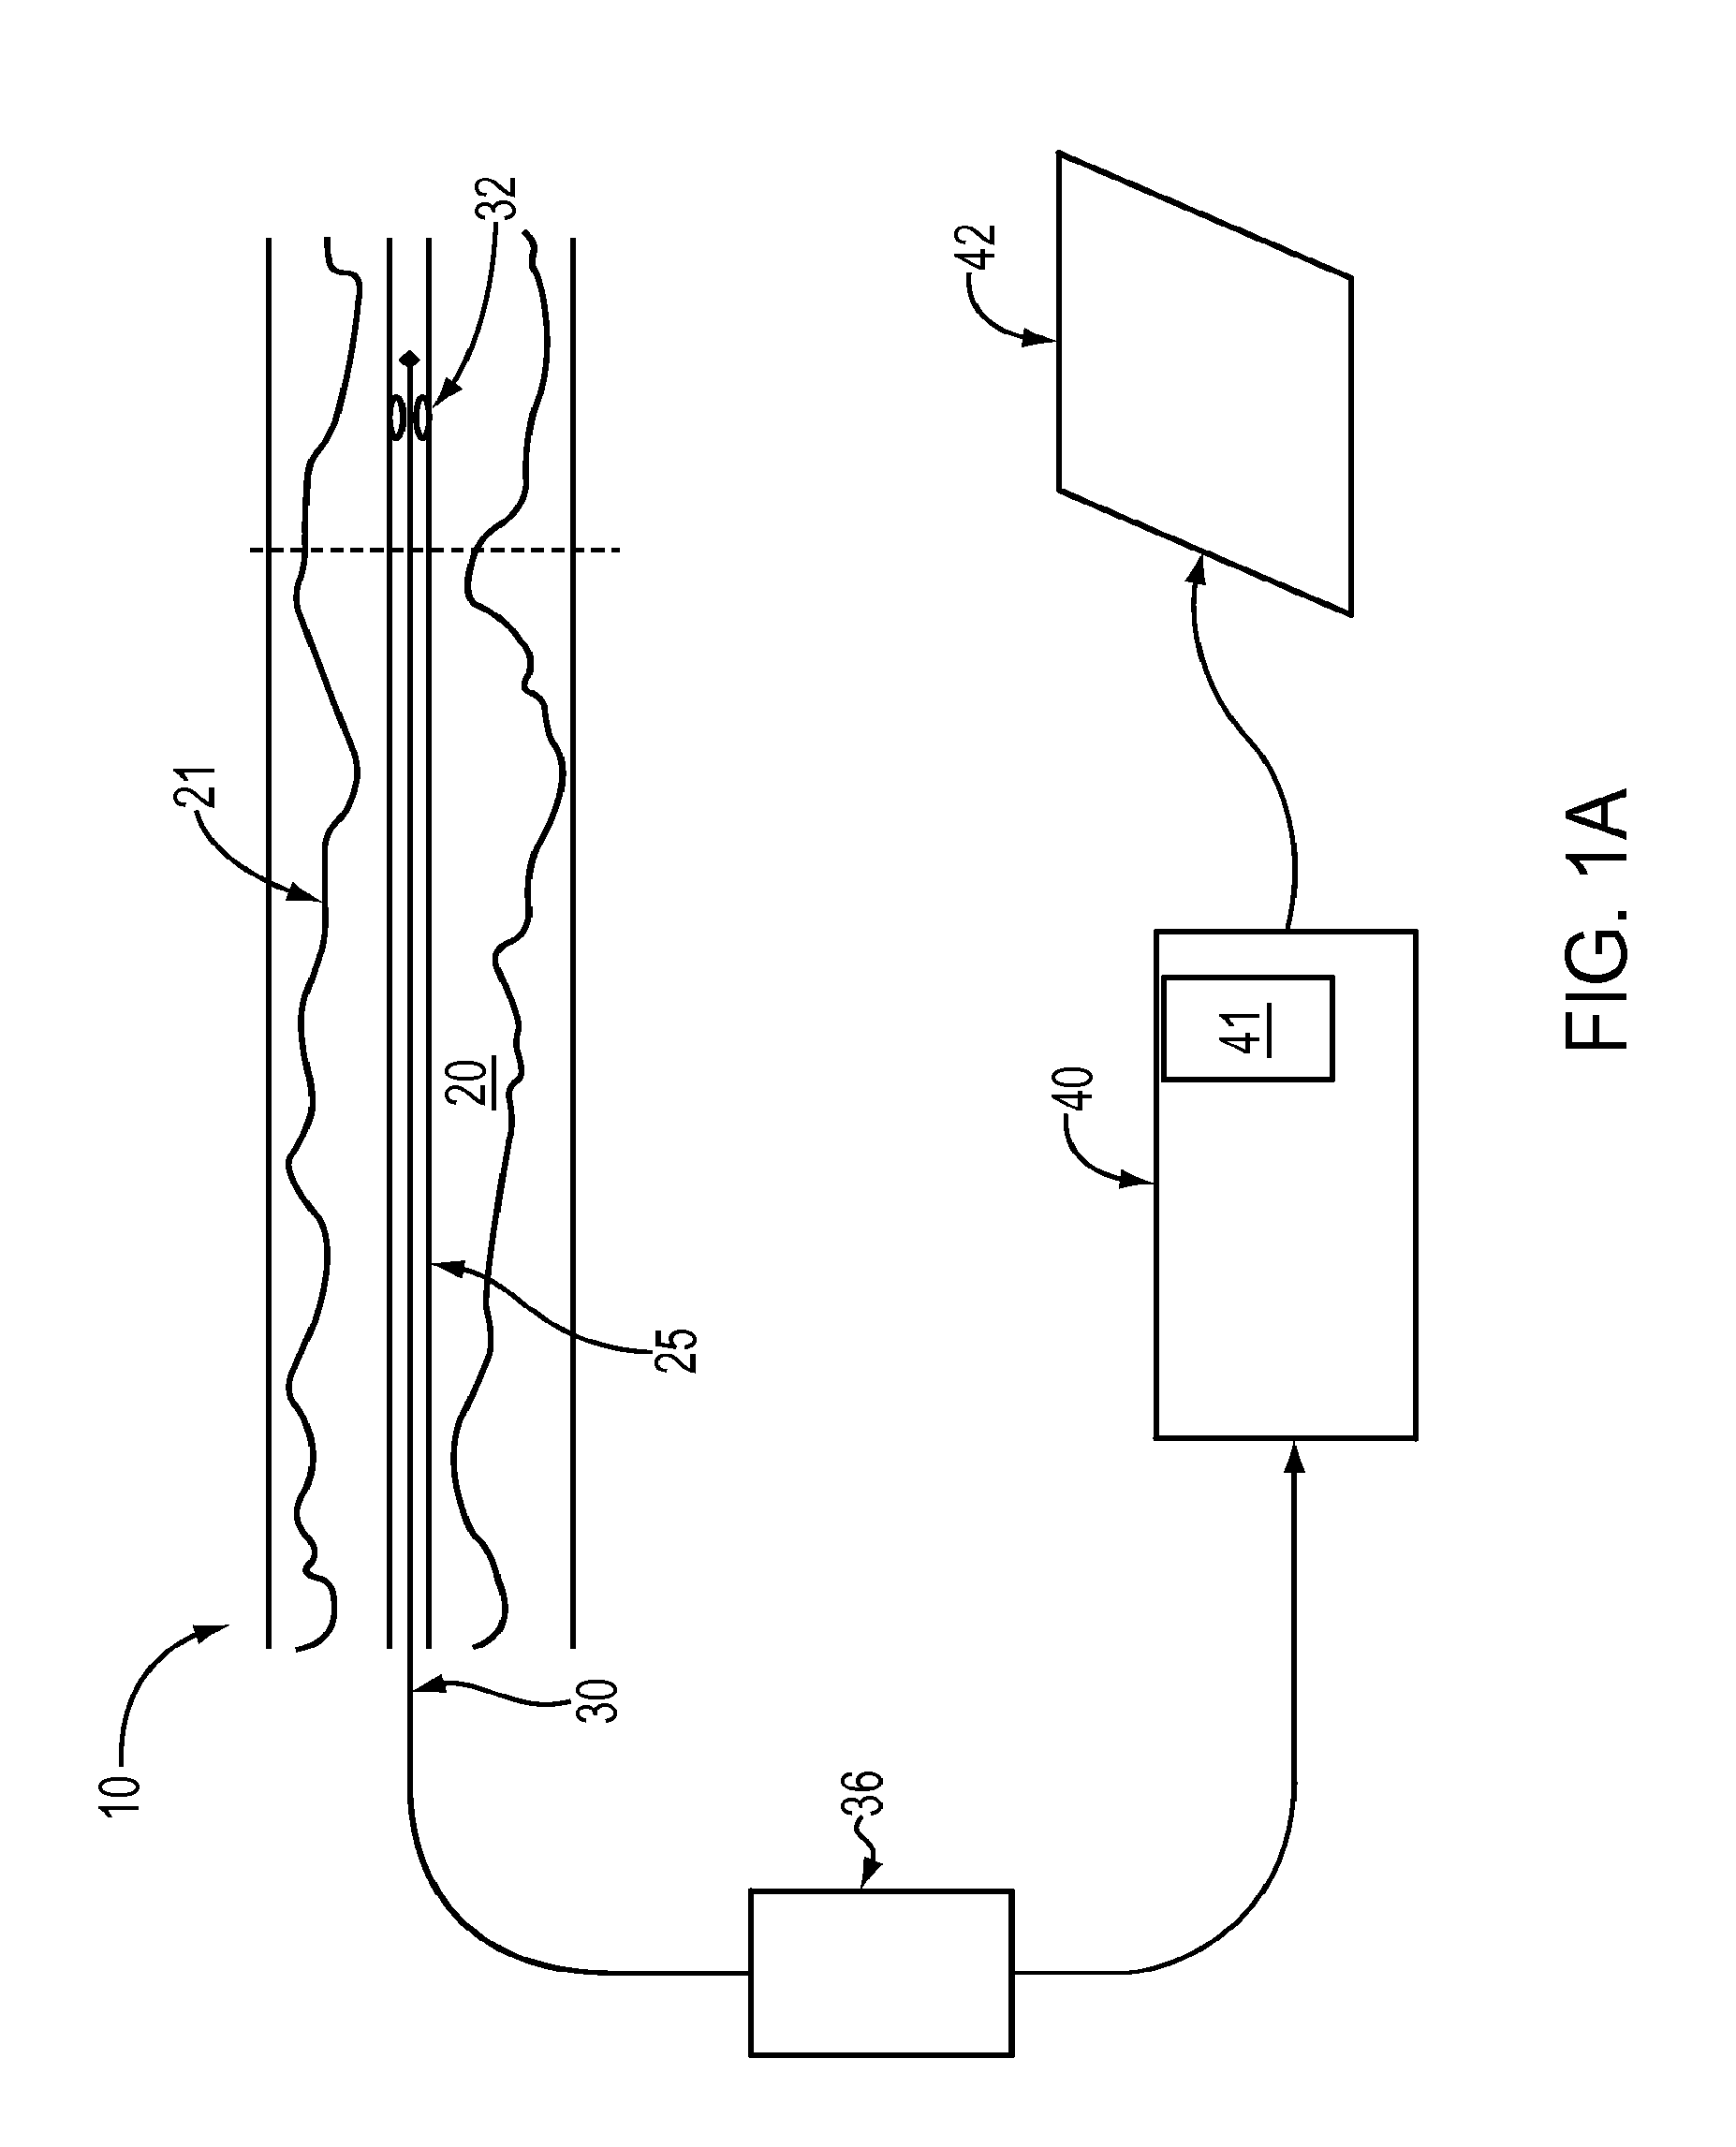
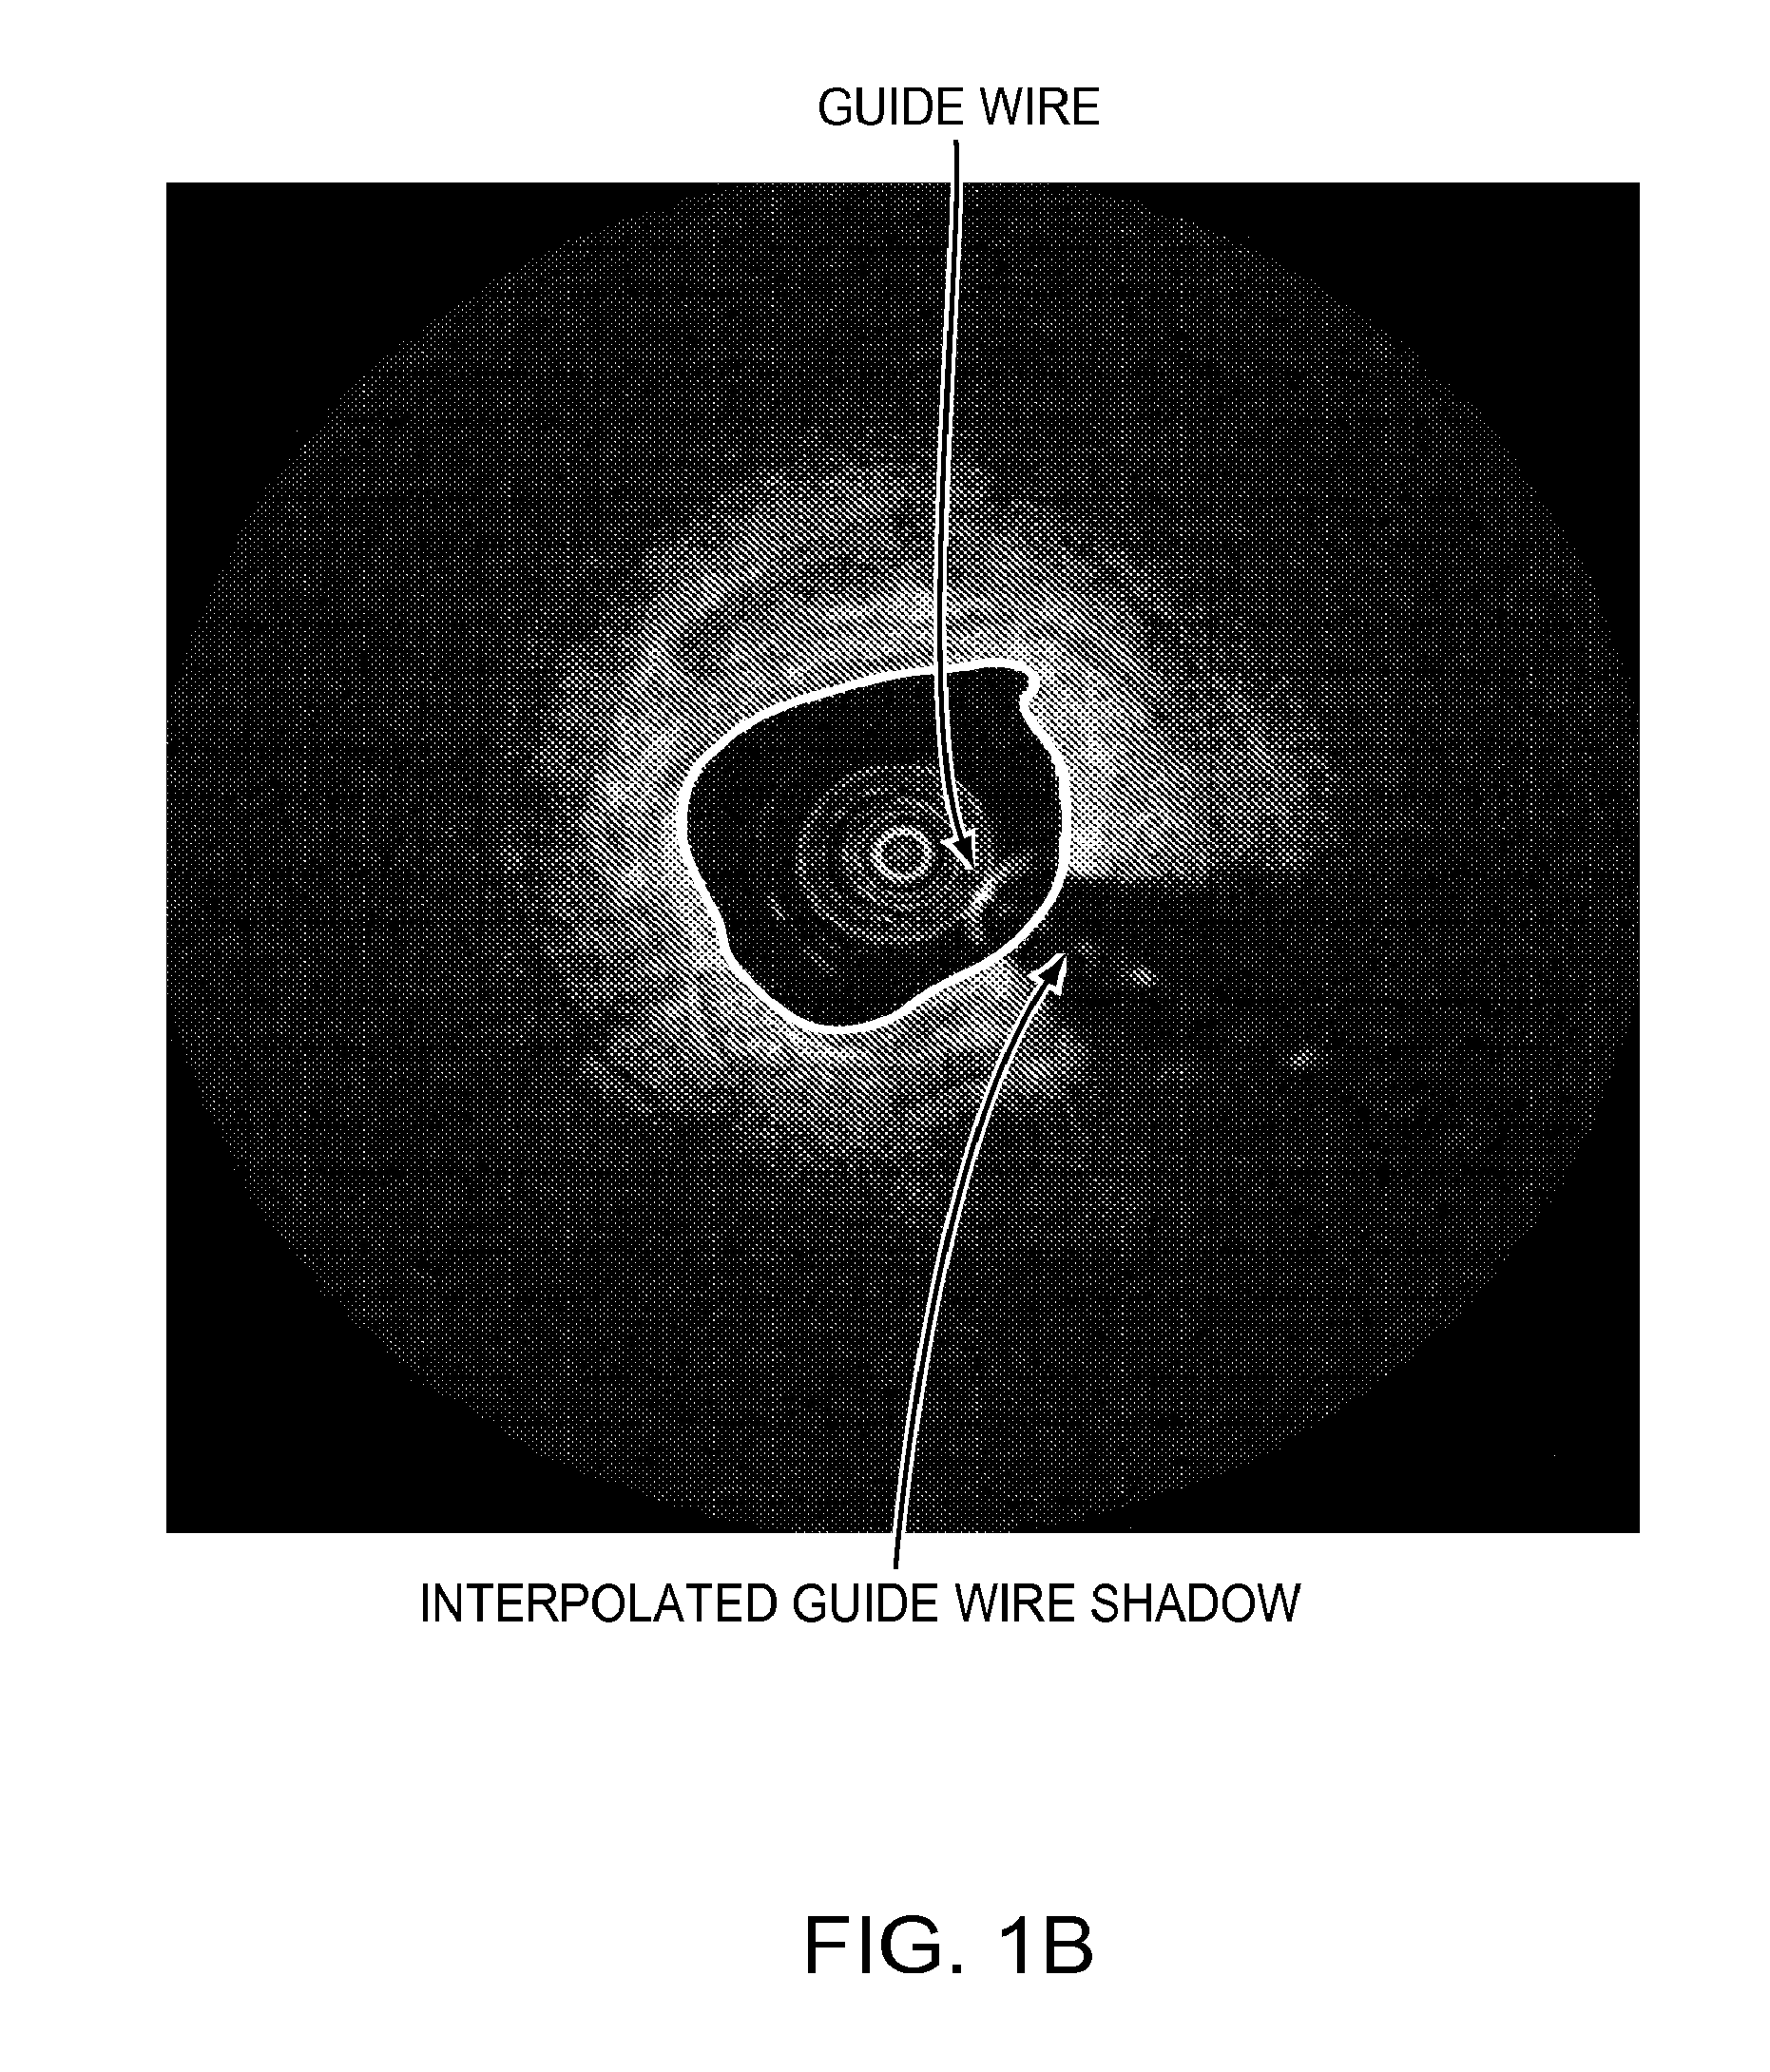
The invention relates to an automated computer-based method for evaluating a region of a vessel by using optical coherence tomography (OCT) data. The method involves collecting data regarding the vessel segment, determining the vascular resistance ratio, and identifying the characteristic of the region in relation to the vascular resistance ratio. The invention also includes methods for automatically identifying the luminal border, detecting and removing guide wire shadow artifacts, and evaluating the correctness of the computed contour. The invention also includes a method for quantifying the vascular resistance by calculating the actual vascular resistance and total vascular resistance of the vessel segment. The invention can help improve the accuracy and efficiency of evaluating and treating vascular disease.

Problems solved by technology

While the luminal border in OCT images is clearly identifiable by the human eye, it is tedious, expensive, and time consuming to manually trace the luminal border.
However, the relationship of these geometric measurements to clinically relevant variables, such as ability of the artery to supply an adequate flow of blood to the myocardium when metabolic demands are high, is not well understood.
In early studies, the percent stenosis of an individual coronary lesion measured by angiography was found to be a relatively poor predictor of the physiological significance of the lesion.
The angle of the X-ray projection, in addition to the shadowing effect of lesions with irregular contours, can increase errors significantly beyond the theoretical minimums Even state-of-the-art IVUS imaging systems, which have resolutions of approximately 0.15 mm in the axial dimension and 0.3 mm in the angular dimension, cannot accurately measure the cross-sectional areas of small eccentric lesions or lesions with irregular borders.
Second, the hemodynamic effects of a lesion depend on local variations of its cross-sectional area integrated over the entire length of a lesion.
Therefore, the minimum cross sectional area alone is insufficient to characterize the pressure drop across a lesion at a given flow rate, especially in patients with diffuse coronary disease.
Especially at high blood flow rates, the eccentricity and local slope of the walls of the artery can influence the effective resistance of a lesion, because losses due to flow separation and turbulence depend on local flow velocity.
Therefore, even if the vascular resistance of a lesion in the vessel is high, revascularization may be contraindicated, because the pressure drop across the lesion may be clinically insignificant.
In spite of advances in intravascular imaging, cardiologists frequently do not take full advantage of the capabilities of OCT and IVUS for planning and evaluating stent deployment, because the measurements currently derived from the images provide insufficient information to predict the effectiveness of treatment.
The wrong choice of the size or location of the stent may lead to the failure to restore blood flow and may even cause potentially serious clinical complications, such as stent migration, stent thrombosis, or dissection of the vessel wall.

Method used


Image

  • Lumen Morphology and Vascular Resistance Measurements Data Collection Systems, Apparatus and Methods
  • Lumen Morphology and Vascular Resistance Measurements Data Collection Systems, Apparatus and Methods
  • Lumen Morphology and Vascular Resistance Measurements Data Collection Systems, Apparatus and Methods

Examples


first embodiment

[0085]a method for calculation of Rs is adapted from a model of pressure loss in stenotic lesions developed by Kirkeeide. FIG. 14 illustrates the cylindrically symmetrical geometry on which the model is based. The total resistance of the stenosis is assumed to consist of two flow-independent components and a flow-dependent component:

Rs=Rp+Rv+keQ   (9)

[0086]Here Rp represents losses due to viscous wall friction, calculated according to Poiseuille's law as:

Rp=8πηC1[∑i=1NΔxiAi2-∑(Exitregions)ΔxiAi2](10)

[0087]This resistance equals the total integrated viscous losses along the vessel minus the losses in the exit regions where flow separation occurs. Exit regions are defined as the segments of the artery within which the exit angle (θ in FIG. 14) exceeds a threshold value (typically)5°). In these equations C1=0.86, based on results of experiments conducted by Kirkeeide.

[0088]The second flow-independent component of Rs in Eq. 9, which represents the additional viscous losses that occur at...

third embodiment

[0098]The reference area, A, in Eqn. 5, is calculated differently for the two models. The cylindrically symmetric model (second method) does not have any branches, therefore An is calculated based on the average of proximal and distal areas. Thus, the velocity in the FloWorks geometry will be an average of the flows that would be encountered through the tapering section. The full 3-D model (third embodiment) includes branches, therefore A, is calculated based on the proximal area only.

[0099]The lumped resistor method shown in FIG. 13 is extended for the full 3-D Computational Flow Model in FIG. 24. The resistance of the branches R1, R2 . . . . RN and RDistal are each composed of the series resistors Re+Rmv. The downstream end of the every branch resistor is at Pv (10 mm Hg). The upstream end of the resistor is at the static pressure that numerical method calculates at that branch. The input pressure of the parent artery at the proximal reference is 90 mm Hg.

[0100]Re of each branch i...


PUM


Abstract

A method and apparatus of automatically locating in an image of a blood vessel the lumen boundary at a position in the vessel and from that measuring the diameter of the vessel. From the diameter of the vessel and estimated blood flow rate, a number of clinically significant physiological parameters are then determined and various user displays of interest generated. One use of these images and parameters is to aid the clinician in the placement of a stent. The system, in one embodiment, uses these measurements to allow the clinician to simulate the placement of a stent and to determine the effect of the placement. In addition, from these patient parameters various patient treatments are then performed.

Description

RELATED APPLICATIONS[0001]This application claims priority to provisional application U.S. Ser. No. 61 / 244,992 filed Sep. 23, 2009 and provisional application U.S. Ser. No. 61 / 334,834 filed May 14, 2010, the disclosures of which are herein incorporated by reference in their entirety.FIELD OF INVENTION[0002]This invention relates generally to the field of optical coherence tomographic imaging and more specifically to optical coherence techniques for diagnosing and treating vascular stenoses.BACKGROUND OF THE INVENTION[0003]Coronary artery disease is one of the leading causes of death worldwide. The ability to better diagnose, monitor, and treat coronary artery diseases can be of life saving importance. Intravascular optical coherence tomography (OCT) is a catheter-based imaging modality that employs safe, non-ionizing near-infrared light to peer into coronary artery walls and present images valuable for the study of the vascular wall architecture. Utilizing broad-band coherent light,...

Claims


Application Information

Patent Timeline
Patent Type & Authority Applications(United States)
IPC IPC(8): A61B5/00A61F2/82
CPCA61B5/0066A61B5/02007A61B5/6852A61B2019/502G06T2207/30101G06T7/0012G06T2200/24G06T2207/10016G06T2207/10101A61F2/82A61B2034/102
Inventor SCHMITT, JOSEPH M.FRIEDMAN, JOEL M.PETROFF, CHRISTOPHERELBASIONY, AMR
Owner LIGHTLAB IMAGING
Learn More