Methods and algorithms for aiding in the detection of cancer
a technology of cancer detection and algorithms, applied in the field of methods, can solve the problems of high false positive and false negative increased false negative and false positive rate of cancer detection tests, and unnecessary, expensive and invasive follow-on tests, etc., and achieve the effect of reducing costs, anxiety and radiation exposur
- Summary
- Abstract
- Description
- Claims
- Application Information
AI Technical Summary
Benefits of technology
Problems solved by technology
Method used
Image
Examples
example 1
Study of Lung Cancer Biomarker Expression in Retrospective Clinical Samples
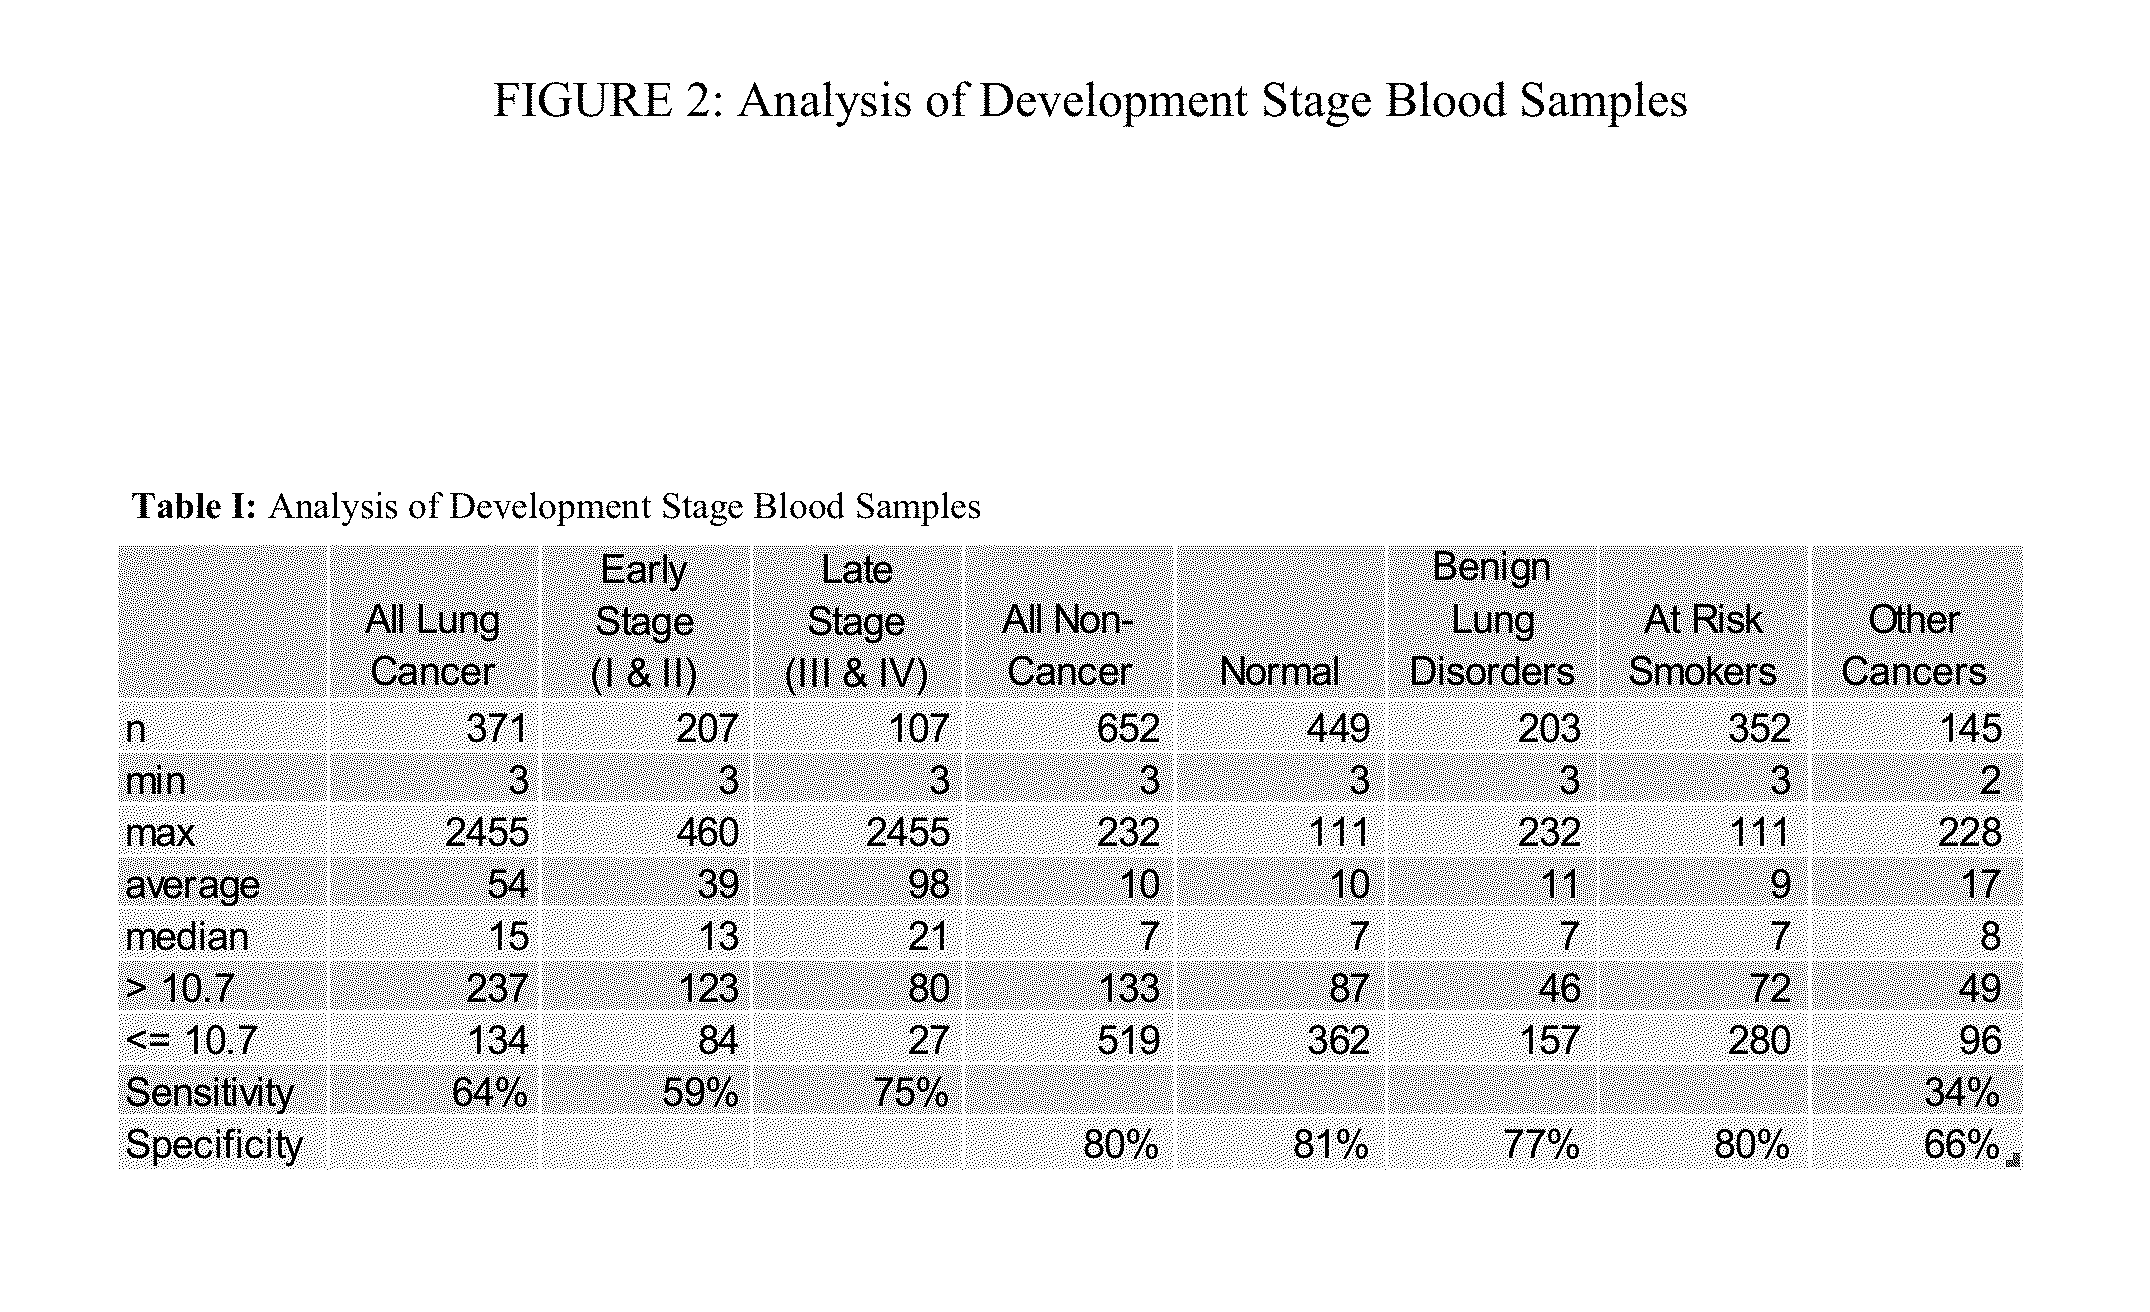
[0157]Over 1000 blood samples from patients with all stages of lung cancer, the at risk population (20 pack-year smokers over 50 years of age) and various other control groups including those with non-cancerous lung disorders and other cancers (prostate, breast and colorectal) are provided herein (See, FIG. 2). These samples were collected from multiple cohorts of patients over a 5 year period from several sites both in the United States and in Europe.
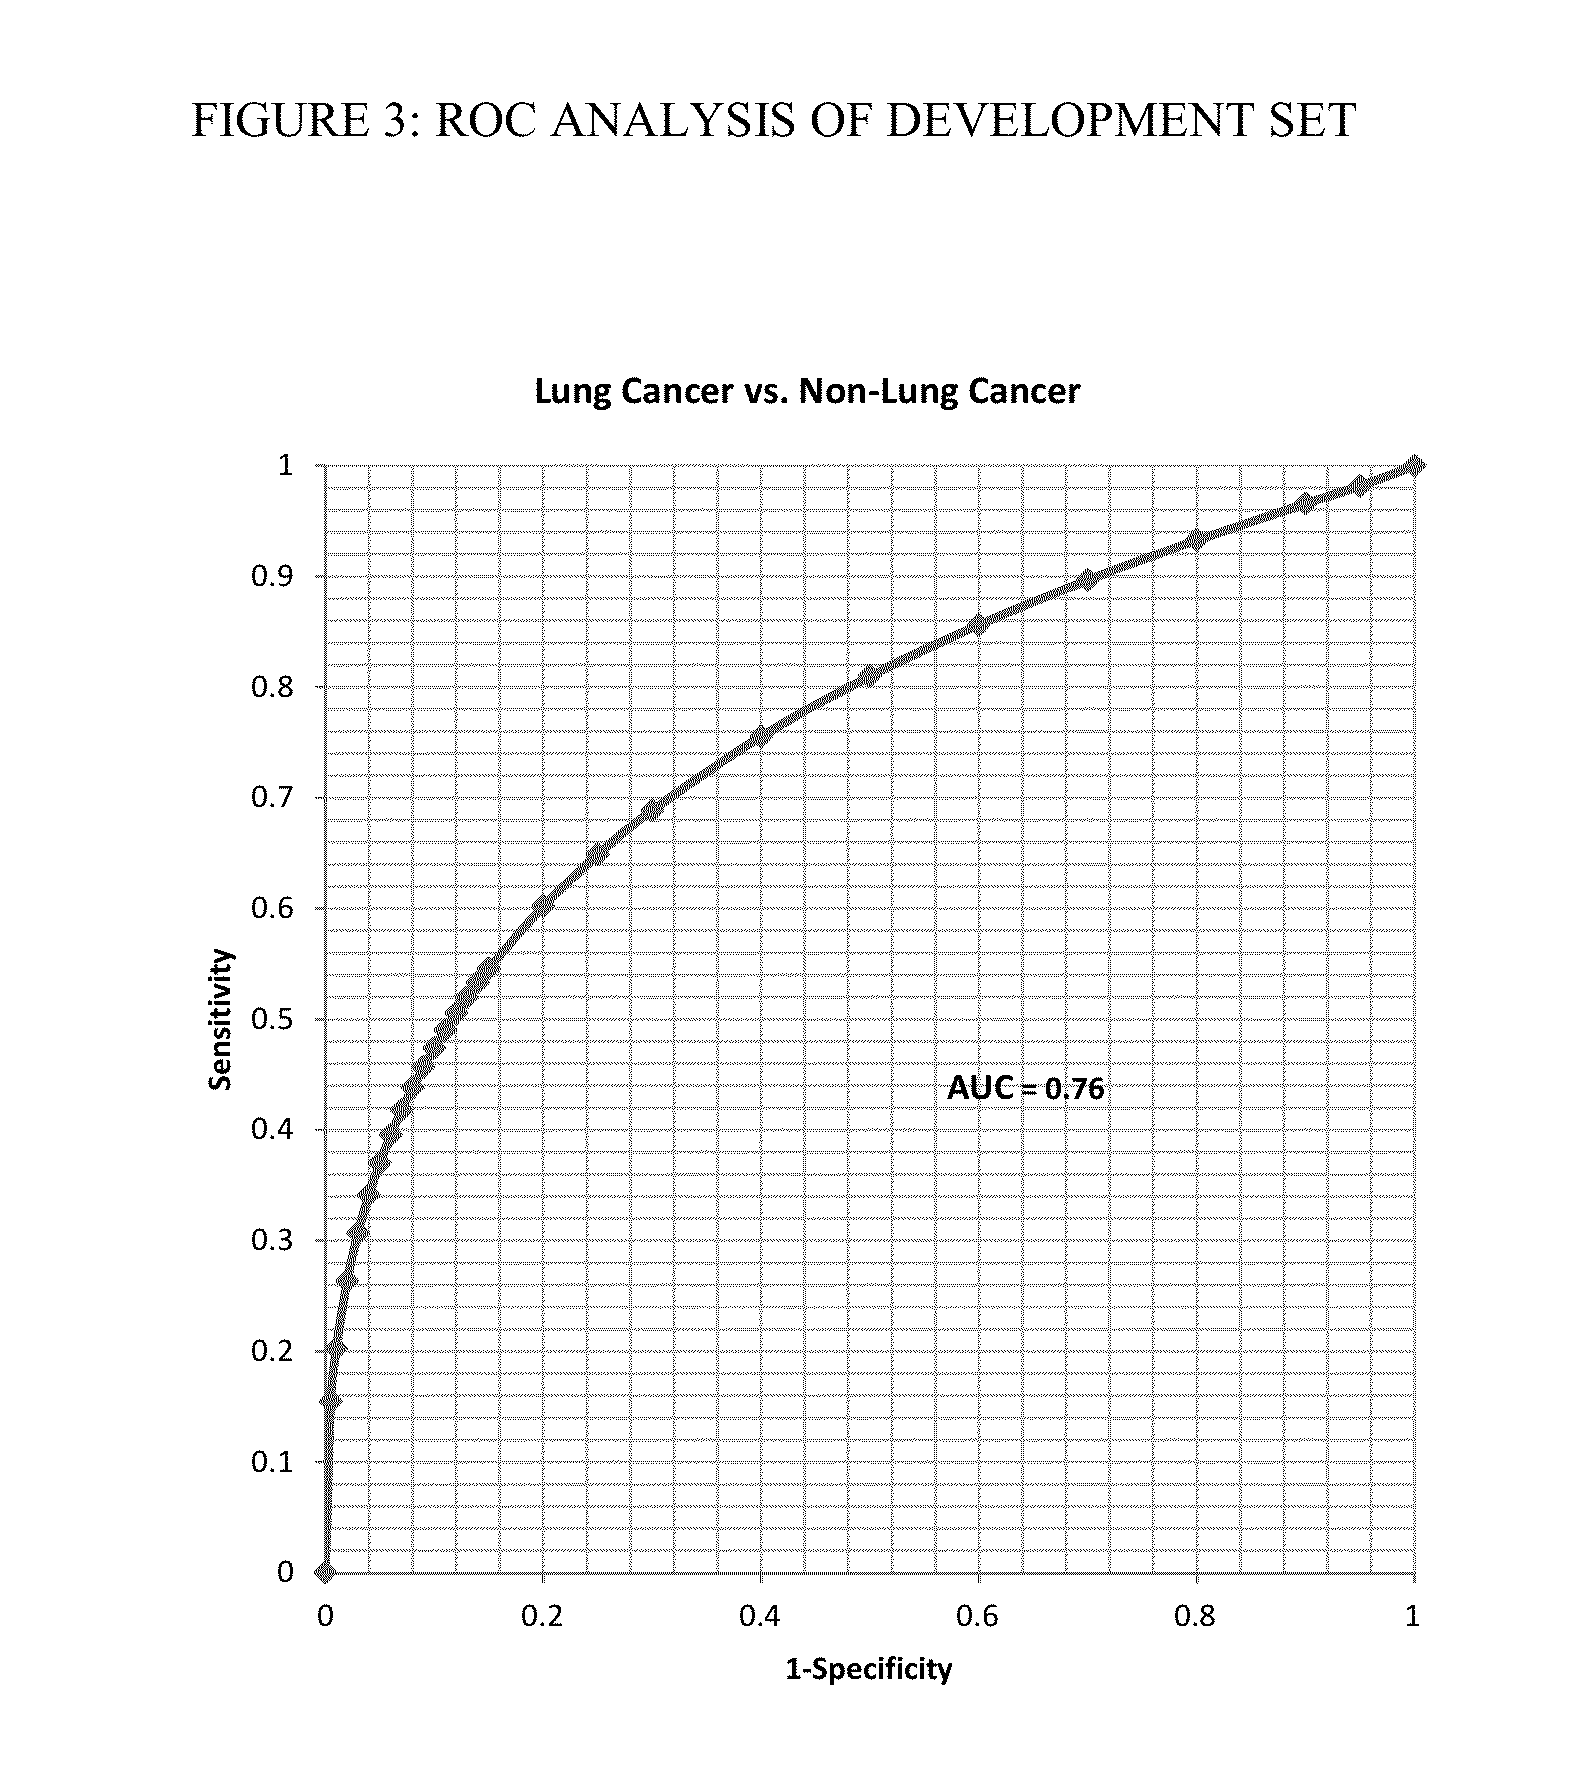
[0158]FIG. 3 shows a receiver operator characteristic (ROC) curve analysis of all lung cancer vs. all non-cancer samples yielded an area under the curve (AUC) of 0.76. Choosing a cutoff of 10.7 shows a specificity of 80% yields a sensitivity of 64%. The data was further analyzed as a function of tumor stage using the same cutoff and yielding 75% sensitivity in late stage disease and 59% sensitivity for early stage disease indicating that the test has a higher se...
example 2
Validation of Biomarker Panel and Assay Redesign
[0160]Applicants redesigned the assay system to allow for multiplexing of biomarker detection and thus increased efficiency in the clinical diagnostic lab. As part of this work, Applicants performed a full analytical validation of the test in accordance with standard clinical laboratory practice. Specifically, assay linearity, precision and reproducibility were assessed for each of the six biomarkers. FIG. 6 presents the linearity of one of the tumor markers in a spike and recovery assay. All 6 biomarkers, those disclosed above, are detected in the linear range and have r2 values of >0.9. Precision and repeatability were determined by testing 3 samples twice a day for 5 days each for two independent operators. An additional 5 days of data were collected for a single operator. All testing was performed in duplicate. FIG. 7 displays representative data for 3 of the markers.
[0161]A clinical bridging study was also performed in which 181 b...
example 3
Final Validation Study
[0162]The Applicants a blinded retrospective study of the present methods using a total of 255 patients including 134 confirmed diagnoses of lung cancer and 121 age-matched >20 pack-year smokers as controls. The study group included two cohorts of patients collected at two separate cancer centers; one in the Northeastern United States and one in the Southwest. Cancer patients were a mix (˜50:50) of early and late stage. All six biomarkers were tested and analyzed to yield the composite score. The data is presented as a box plot in FIG. 8. A ROC curve analysis yielded an AUC of 0.74 and applying a cutoff to hold the specificity at 80% yields a sensitivity of 59% FIGS. 4B& C). This data is in good agreement with the previous studies (FIGS. 2-5).
PUM
 Abstract
Description
Claims
Application Information
 - R&D
- Intellectual Property
- Life Sciences
- Materials
- Tech Scout
- Unparalleled Data Quality
- Higher Quality Content
- 60% Fewer Hallucinations
Browse by: Latest US Patents, China's latest patents, Technical Efficacy Thesaurus, Application Domain, Technology Topic, Popular Technical Reports.
© 2025 PatSnap. All rights reserved.Legal|Privacy policy|Modern Slavery Act Transparency Statement|Sitemap|About US| Contact US: help@patsnap.com


