Subvolume identification for prediction of treatment outcome

a subvolume and treatment outcome technology, applied in the field of subvolume identification for prediction of treatment outcome, can solve the problems of inability of existing techniques to effectively discriminate information within tumor images, patient loses the time window for optimal treatment, and inability to effectively identify information within tumor images

Active Publication Date: 2013-12-12
RGT UNIV OF MICHIGAN
View PDF4 Cites 50 Cited by
  • Summary
  • Abstract
  • Description
  • Claims
  • Application Information

AI Technical Summary

Benefits of technology

[0009]The present techniques address the foregoing problems by providing techniques for assessing imaging-defined abnormalities (phenotypes) of diseases in regions of interests, through physiological, metabolic, biologic, and / or molecular imaging, to identify abnormality probabilities of a tumor or other disease, and more specifically multiple biological subvolumes that may be analyzed against any number of disease conditions. In this way, not only are diagnostic determinations possible, but prognostic or predictive determinations can be made for predicting a therapy response and outcome of treatment on an identified subvolume. From here, the techniques may be used to provide a biological-imaging defined target for intensive treatments, e.g., for more effective ‘painting’ and ‘sculpting’ of radiation dosage treatments or any number of tumor treatment optimizations.

Problems solved by technology

However, unfortunately, a tumor size change often occurs late, and therefore the patient loses the time window for optimal treatment.
This is a simple but not effective approach due to neglecting the heterogeneous distribution of the physiological parameter in the tumor, particularly in large tumors.
Indeed, this sensitivity problem is a direct result of the inability of existing techniques to effectively discriminate the information within a tumor image.
Tumor image data may reflect numerous different phenotypes / conditions within a tissue mass, but without an ability to properly discriminate between these different phenotypes / conditions, from a medical image data, effective analysis and diagnosis is limited.
When there is tumor growth and shrinkage from pre to post therapy, the results of the voxel-by-voxel analysis of the physiological imaging are often incorrect or, at a minimum, misleading.
The reasons for this are numerous, but the primary culprit is mis-registration of image data at the voxel level.
As a tumor changes in size, it is difficult to register with satisfactory certainty a first image of a tumor, taken at one point, e.g., pre-treatment, with the second image of that same tumor, now changed, taken at a second point, e.g., post treatment.
This image registration problem commonly requires complex image analysis to correct and still limits the effectiveness of practitioners to use physiological, metabolic and molecular imaging for proper tumor treatment assessment.
To derive a physiological imaging parameter from dynamic contrast enhanced magnetic resonance imaging (DCE-MRI) data or other dynamic PET / SPECT data involves time-consuming pharmacokinetic modeling.
Trying to diagnose physiological conditions from that image parameter is prone to error, poor reproducibility and lack of accuracy.
However, target volume delineation based upon anatomic information provided by CT images and MRI images is limited.
Also, considering spatially-heterogeneous biological properties of a tumor, a uniform dose distribution within a target volume might not lead to an optimal treatment outcome.
In any event, voxel-by-voxel image analyses, while effective to an extent, are limiting.

Method used


Image

  • Subvolume identification for prediction of treatment outcome
  • Subvolume identification for prediction of treatment outcome
  • Subvolume identification for prediction of treatment outcome

Examples


experiment 1

[0049]Patient Sample:

[0050]In an example implementation of the techniques described herein, twenty patients (11 women and 9 men, ages 41-76 years) diagnosed with brain metastases were enrolled in a prospective MRI study approved by the institutional review board (Table 1). The histology included melanoma (11), non-small cell lung cancer (6), renal cell carcinoma (1), breast cancer (1), and head & neck squamous cell carcinoma (1). All patients received WBRT with a total dose of 30 Gy in 10 fractions (13 patients) or 37.5 Gy in 15 fractions (7 patients). In addition, thirteen patients received Bortezomib during WBRT as a radiation sensitizer. If a patient had three brain metastatic lesions or less, all lesions were included in this analysis. If a patient had more than three lesions, only the three largest lesions were included. If a patient had more than three lesions larger than 1 cm3, the lesions greater than 1 cm3 were also included. As a total, 45 lesions with a median volume of 1...

experiment 2

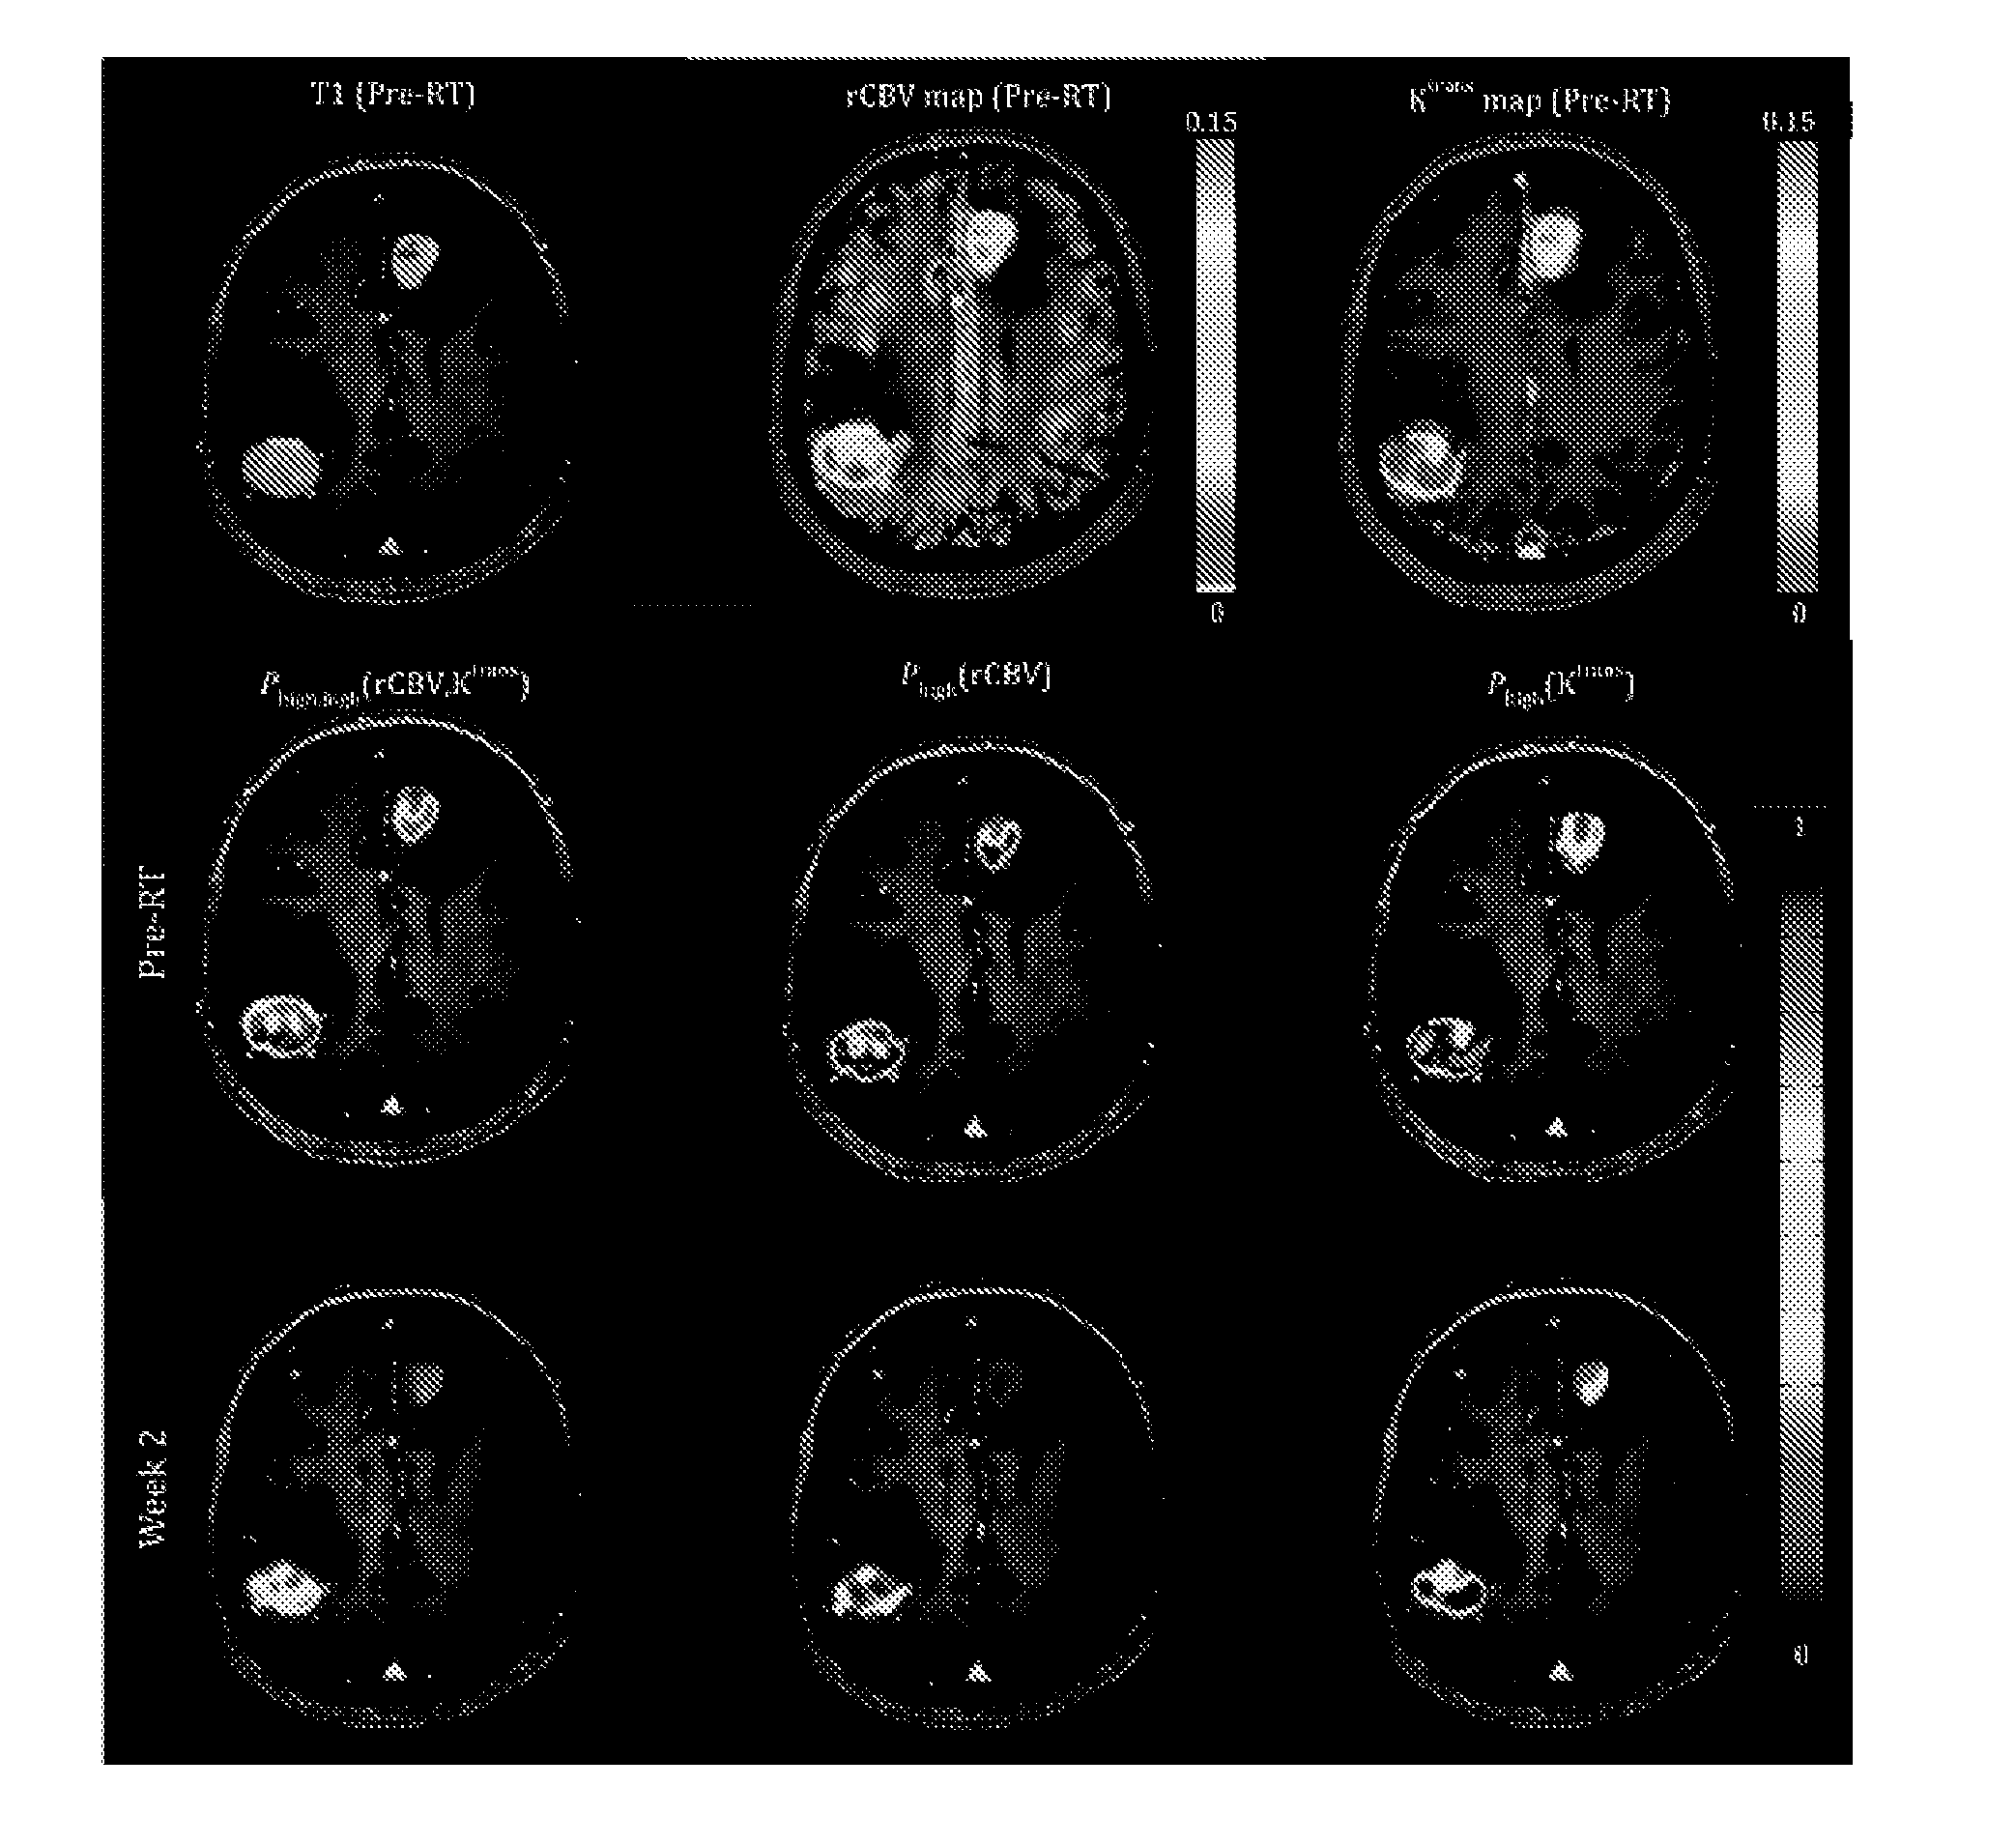
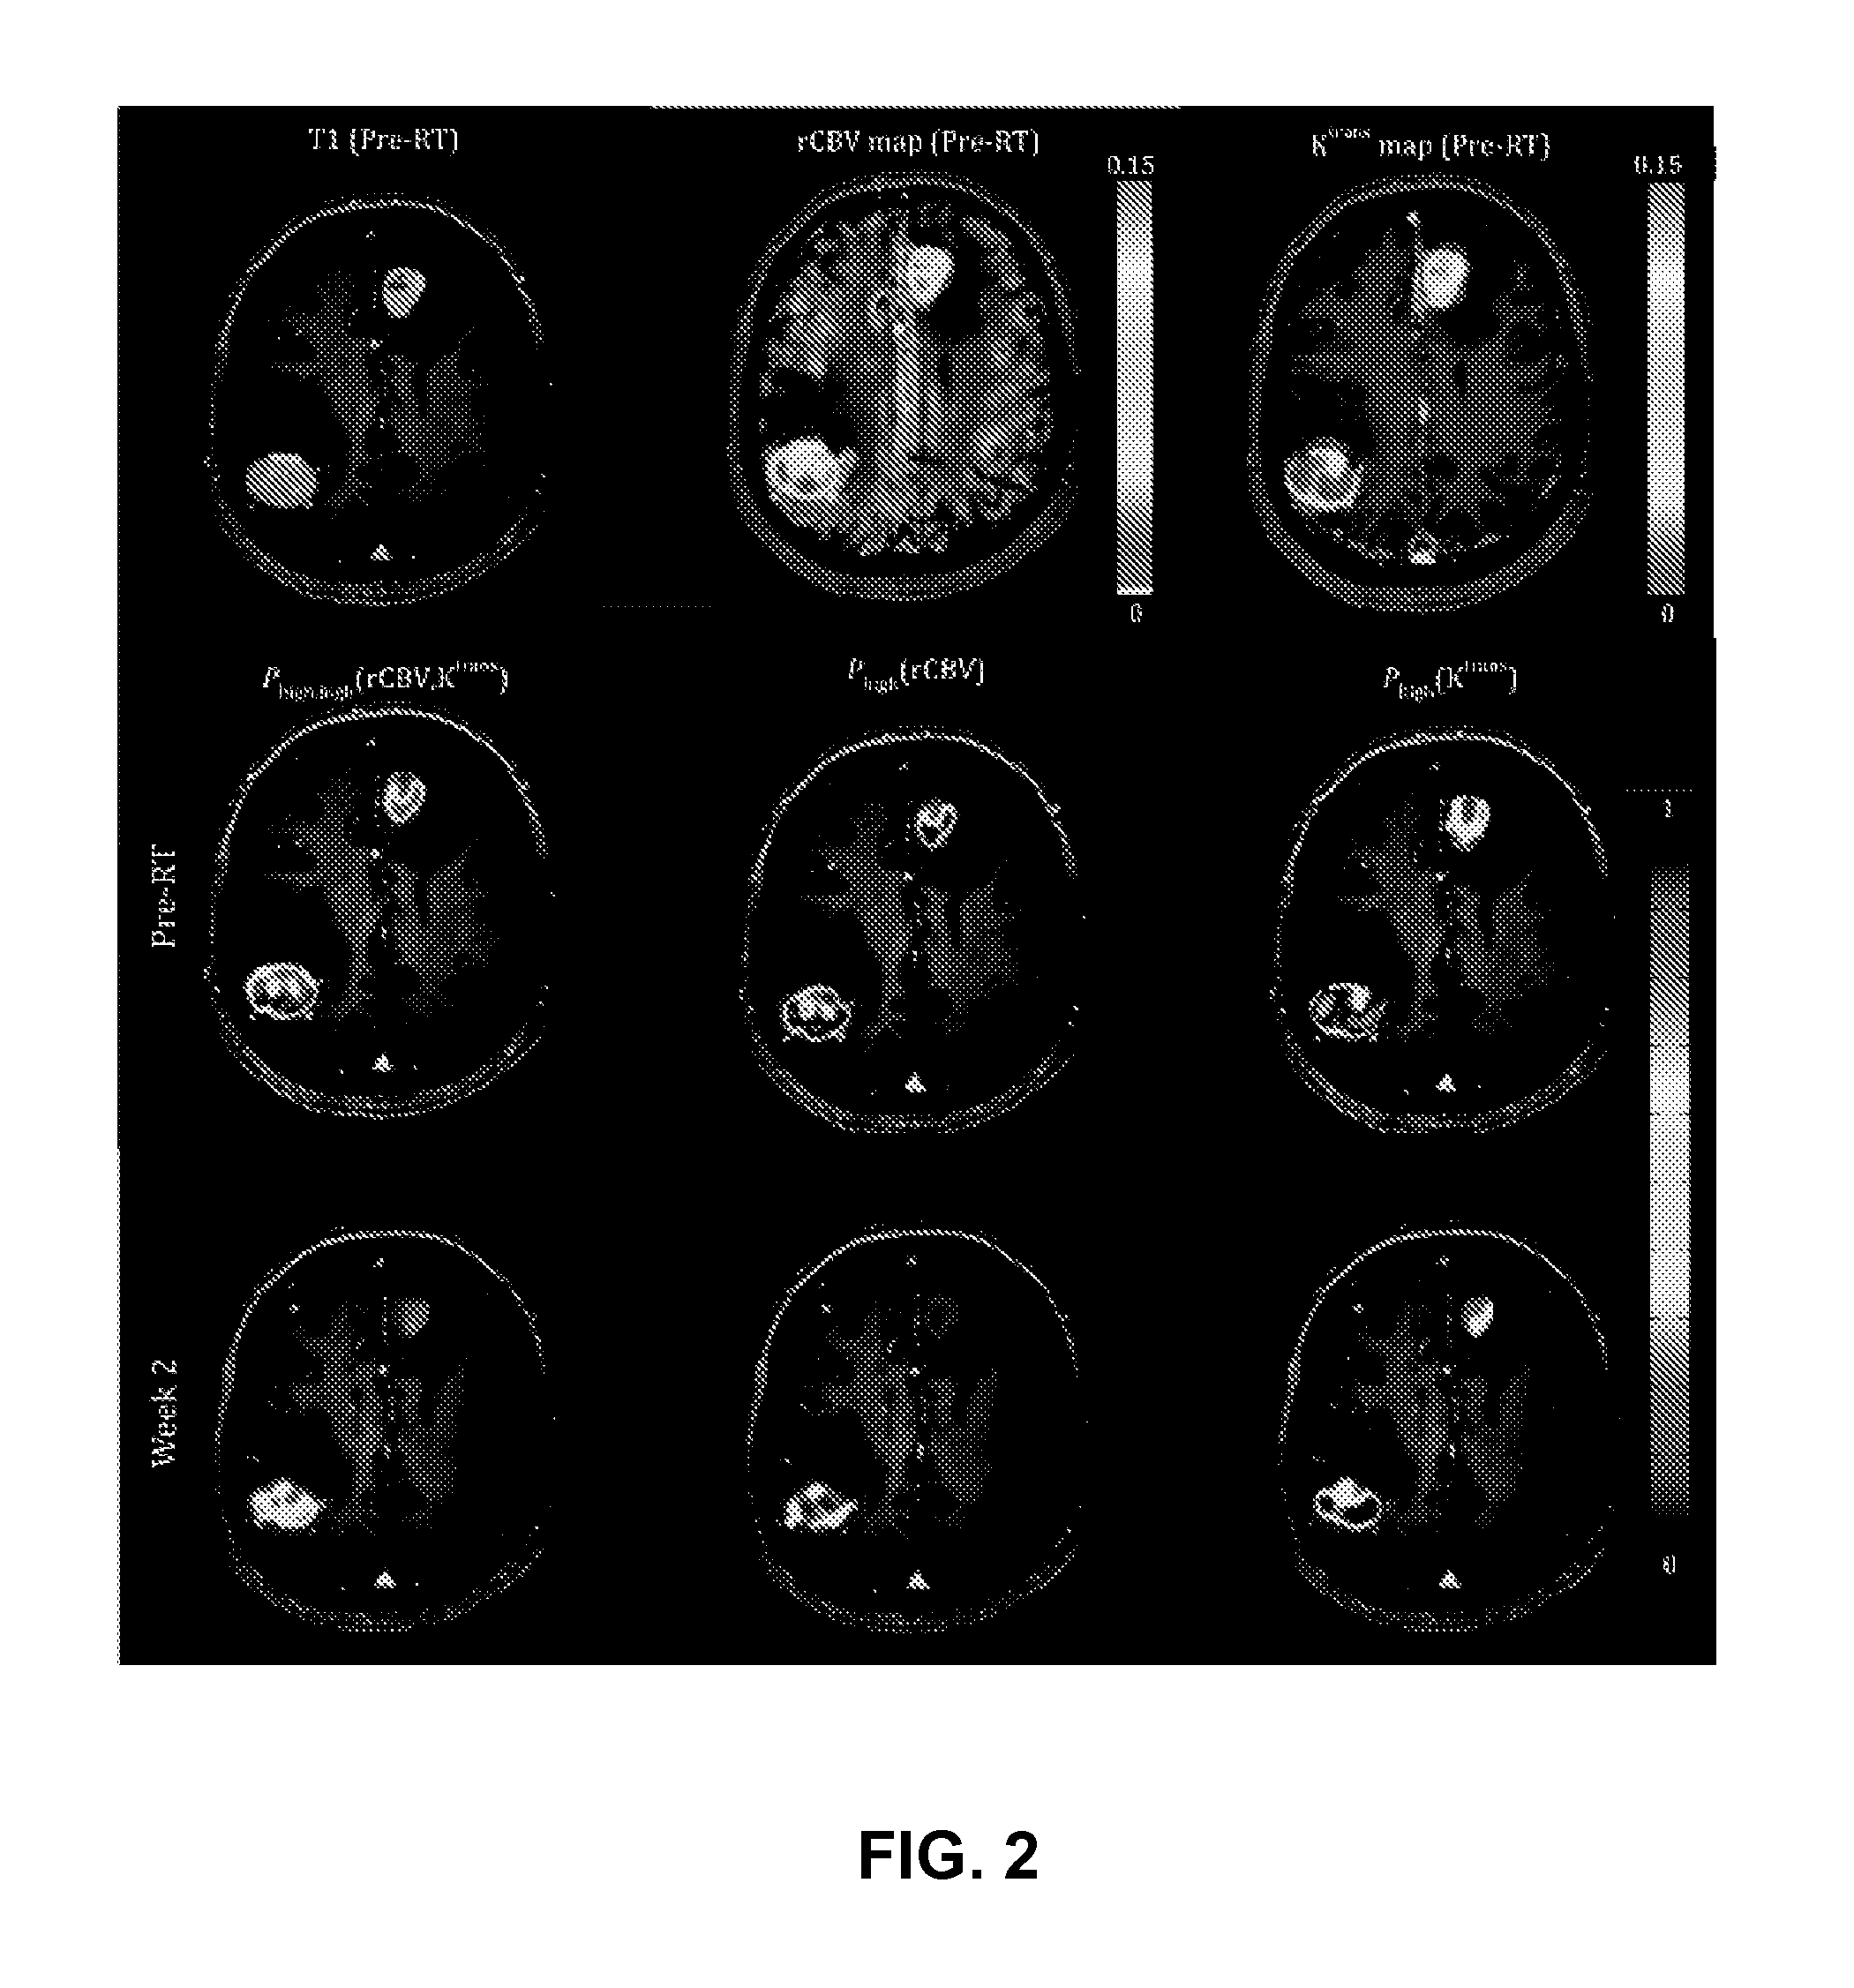
[0073]In another example implementation the present techniques were applied to dynamic contrast enhanced (DCE) MRI image data. The implementation used global initiated regularized local fuzzy clustering (GRELFC), similar to the techniques outlined above, to identify abnormal subvolumes of head and neck cancers (HNC) from heterogeneous distributions of tumor blood volume (BV) and blood flow (BF), i.e., from functional image data for assessment of therapy response.

[0074]In operation, BV and BF images, derived from DCE-MRI, of 14 patients with advanced HNC were obtained before chemo-radiation therapy (chemo-RT) and 2 weeks after start of 7-week chemo-RT. The delineated subvolumes of tumors with low BV or BF before and during treatment were evaluated for their associations with local failure. Receiver operating characteristic (ROC) analysis was used to assess performance of the method for prediction of local failure of HNC. As discussed further, the results showed that the sizes of the ...

experiment 3

[0115]Using the data gathered from Experiment 1, the following steps of the PCA technique were employed.

[0116]Pre-Processing; DCE Curves Normalization:

[0117]the dynamic curve at each voxel represents the temporal changes in signal intensity after the contrast injection. The signal intensity change AS from pre (baseline) to post contrast is calculated as following:

ΔS(t)≡s(t)-soSo(12)

where S(t) and So represent signal intensities of a DCE curve at times t and 0 (the time of contrast injection), respectively. Note that AS(t) is proportional to AR1, the change in the longitudinal relaxation rate, as long as TR×R1<<1. To account for the individual hemodynamic response to contrast, AS was normalized at each voxel using the peak of the arterial input function, AIFmax, obtained during the same scan as:

ΔSN(t)=ΔS(t)·1AIFmax(13)

[0118]An arterial input function can be determined from a region of interest (ROI) in a large artery (e.g., carotid artery, etc.) manually, semi-automatically or automa...


PUM


Abstract

Physiological imaging-defined subvolumes of tissues/disease are identified to yield spatially-defined prognostic and/or predictive indicators and/or focal therapy targets within such tissues, in particular tumors, for evaluation over time, for example, prior to and after a therapy treatment. Medical image data is analyzed to delineate subvolumes of tissue based upon multiple physiological, metabolic, and biological imaging properties, where those subvolumes are extracted and analyzed in a probabilistic manner to associate with one or more abnormal or disease phenotype conditions.

Description

RELATED APPLICATIONS[0001]This application claims benefit to U.S. Patent Application No. 61 / 656,323, filed on Jun. 6, 2012, and entitled “SUBVOLUME IDENTIFICATION FOR PREDICTION OF TREATMENT OUTCOME,” the entirety of which is hereby incorporated herein by reference for all purposes.STATEMENT OF GOVERNMENT INTEREST[0002]This invention was made with government support under Contract Nos. RO1 NS064973, R21 CA113699, and 3P01 CA59827 awarded by the National Institutes of Health. The government has certain rights in the invention.FIELD OF THE INVENTION[0003]The present invention relates generally to a method to identify physiological, metabolic, molecular, and / or biological imaging-defined abnormalities (phenotypes) of diseases for diagnosis, prognosis or prediction of therapy response and / or for intensified local treatment.BACKGROUND OF THE RELATED ART[0004]When treating tumors, the effectiveness of a treatment is determined by analyzing tumor size, comparing the size pre-treatment and ...

Claims


Application Information

Patent Timeline
Patent Type & Authority Applications(United States)
IPC IPC(8): A61B5/00
CPCA61B5/0033A61B5/0036G06T7/0016G06T2207/10096G06T2207/10104G06T2207/10108G06T2207/20076G06T2207/30016
Inventor CAO, YUEWANG, PENGFARJAM, REZA
Owner RGT UNIV OF MICHIGAN
Why Eureka
Try Eureka