Alzheimer's disease signature markers and methods of use
a technology of alzheimer's disease and signature markers, applied in the field of gene expression marker gene sets, can solve the problems of loss of synapses, neurons and brain activity, massive atrophy and gliosis,
- Summary
- Abstract
- Description
- Claims
- Application Information
AI Technical Summary
Benefits of technology
Problems solved by technology
Method used
Image
Examples
example 1
Study Population and Sample Collection
[0062]The dataset comprises gene expression data from brain tissue samples that were posthumously collected from more than 600 individuals with diagnosed with Alzheimer's disease (AD), Huntington disease (HD), or with normal, non-demented brains. All brains were obtained from individuals for whom both the donor and the next of kin had completed the Harvard Brain Tissue Resource Center Informed Consent Form (HBTRC, McLean Hospital, Belmont, Mass.). All tissue samples were handled and the research conducted according to the HBTRC Guidelines, including those relating to Human Tissue Handling Risks and Safety Precautions, and in compliance with the Human Tissue Single User Agreement and the HBTRC Acknowledgment Agreement. Table 10 summarizes the composition of the HBTRC gene expression dataset by experimental phase, brain region, gender, and diagnosis at the time of death.
TABLE 10MeanRegion,MeanAgeMeanBraakMeanMeanPhaseDiagnosisTotalMalesFemalesAgeR...
example 2
Gene Expression Profiling
[0064]The total of 1 μg mRNA from each sample was extracted, amplified to fluorescently labeled tRNA, and profiled by the Rosetta Gene Expression Laboratory in two phases using Rosetta / Merck 44k 1.1 microarray (GPL4372) (Agilent Technikogies, Santa Clara, Calif.) (Hughes, 2001, Nat. Biotechnol., 19:342-347). The average RNA integrity number of 6.81 was sufficiently high for the microarray experiment monitoring 40,638 transcripts representing more than 31,000 unique genes. The expression levels were processed and normalized to the average of all samples in the batch from the same region using Rosetta Resolver (Rosetta Biosoftware, Seattle, Wash.).
[0065]Applicants refer to each batch of samples hybridized to the microarrays profiled at the same time by use of the abbreviation for the brain region and the phase of the experiment (e.g., PFC2 refers to prefrontal cortex samples profiled in phase 2). Table 10 summarizes the number of samples in each category. All ...
example 3
[0066]Applicants used the log 10-ratio of the individual microarray intensities to the average intensities of all samples from the same brain region profiled in the same phase as a primary measure of gene expression. Quality control of gene expression data was performed by principal component analysis using MATLAB R2007a (Mathworks Inc. Natick, Mass.). Outlier samples (less than 2%) were removed from the data set based on extreme standardized values of the first, second, or third principal components, with absolute z-scores more than 3.
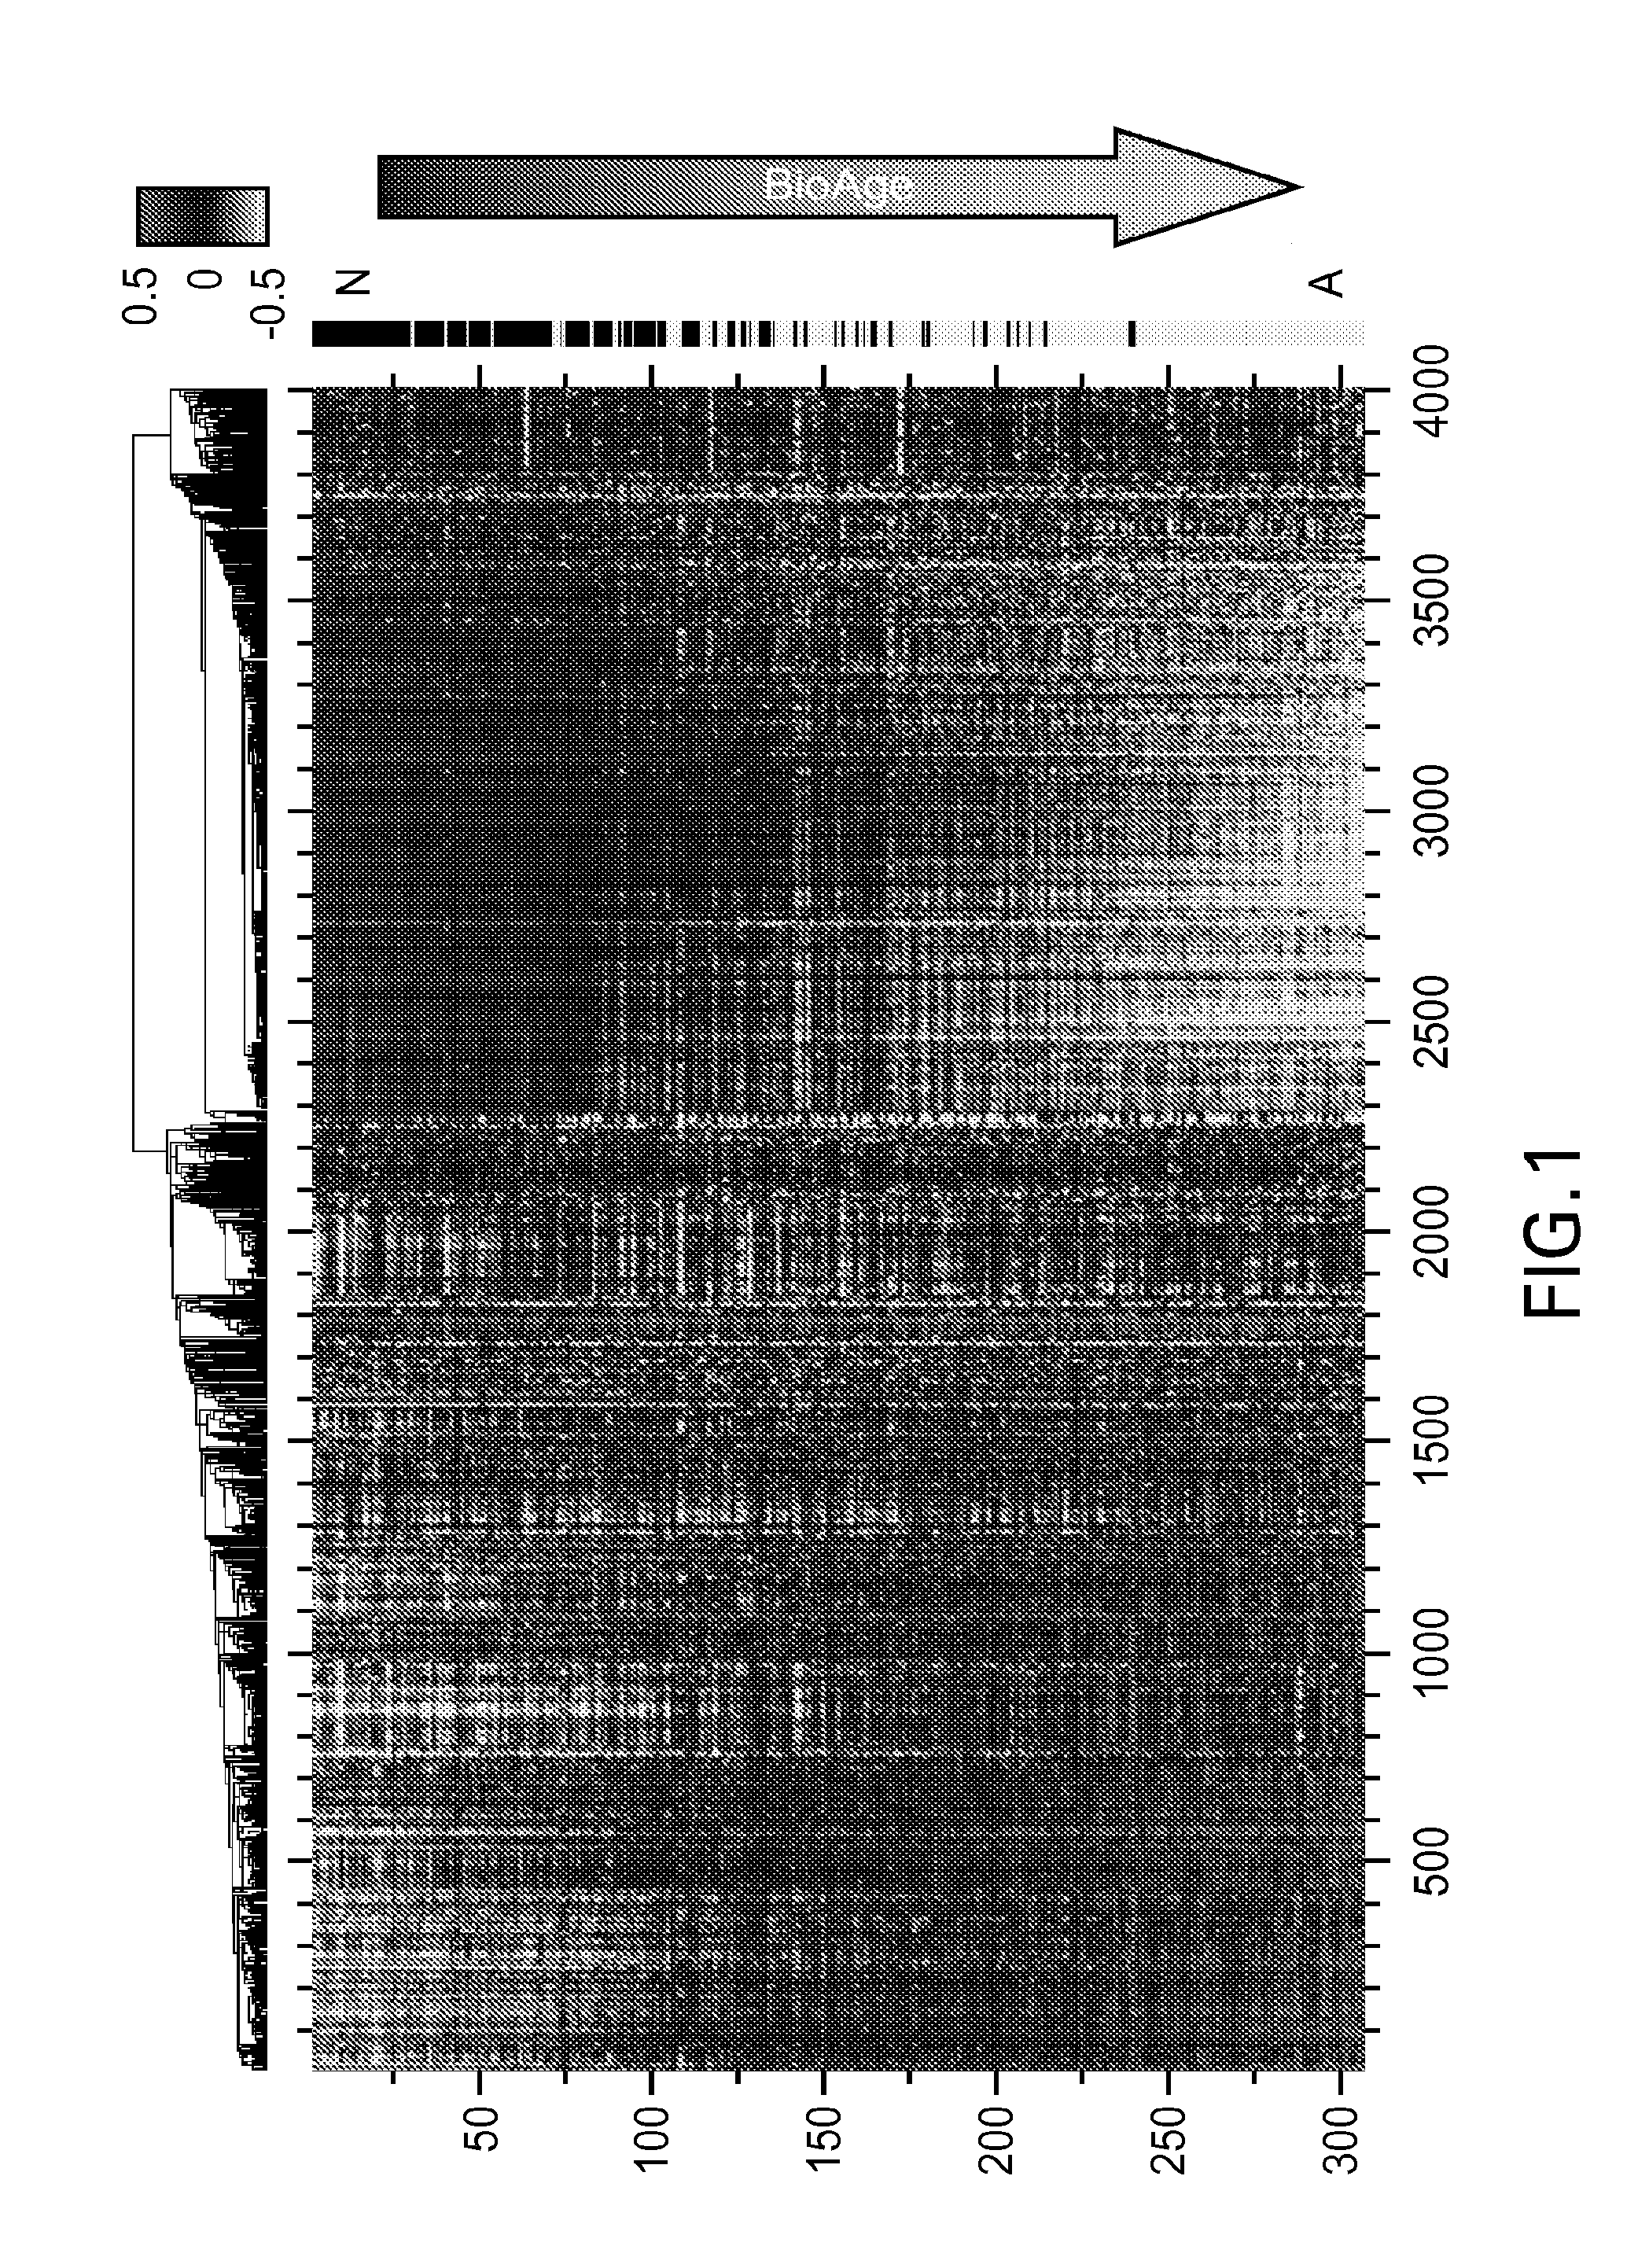
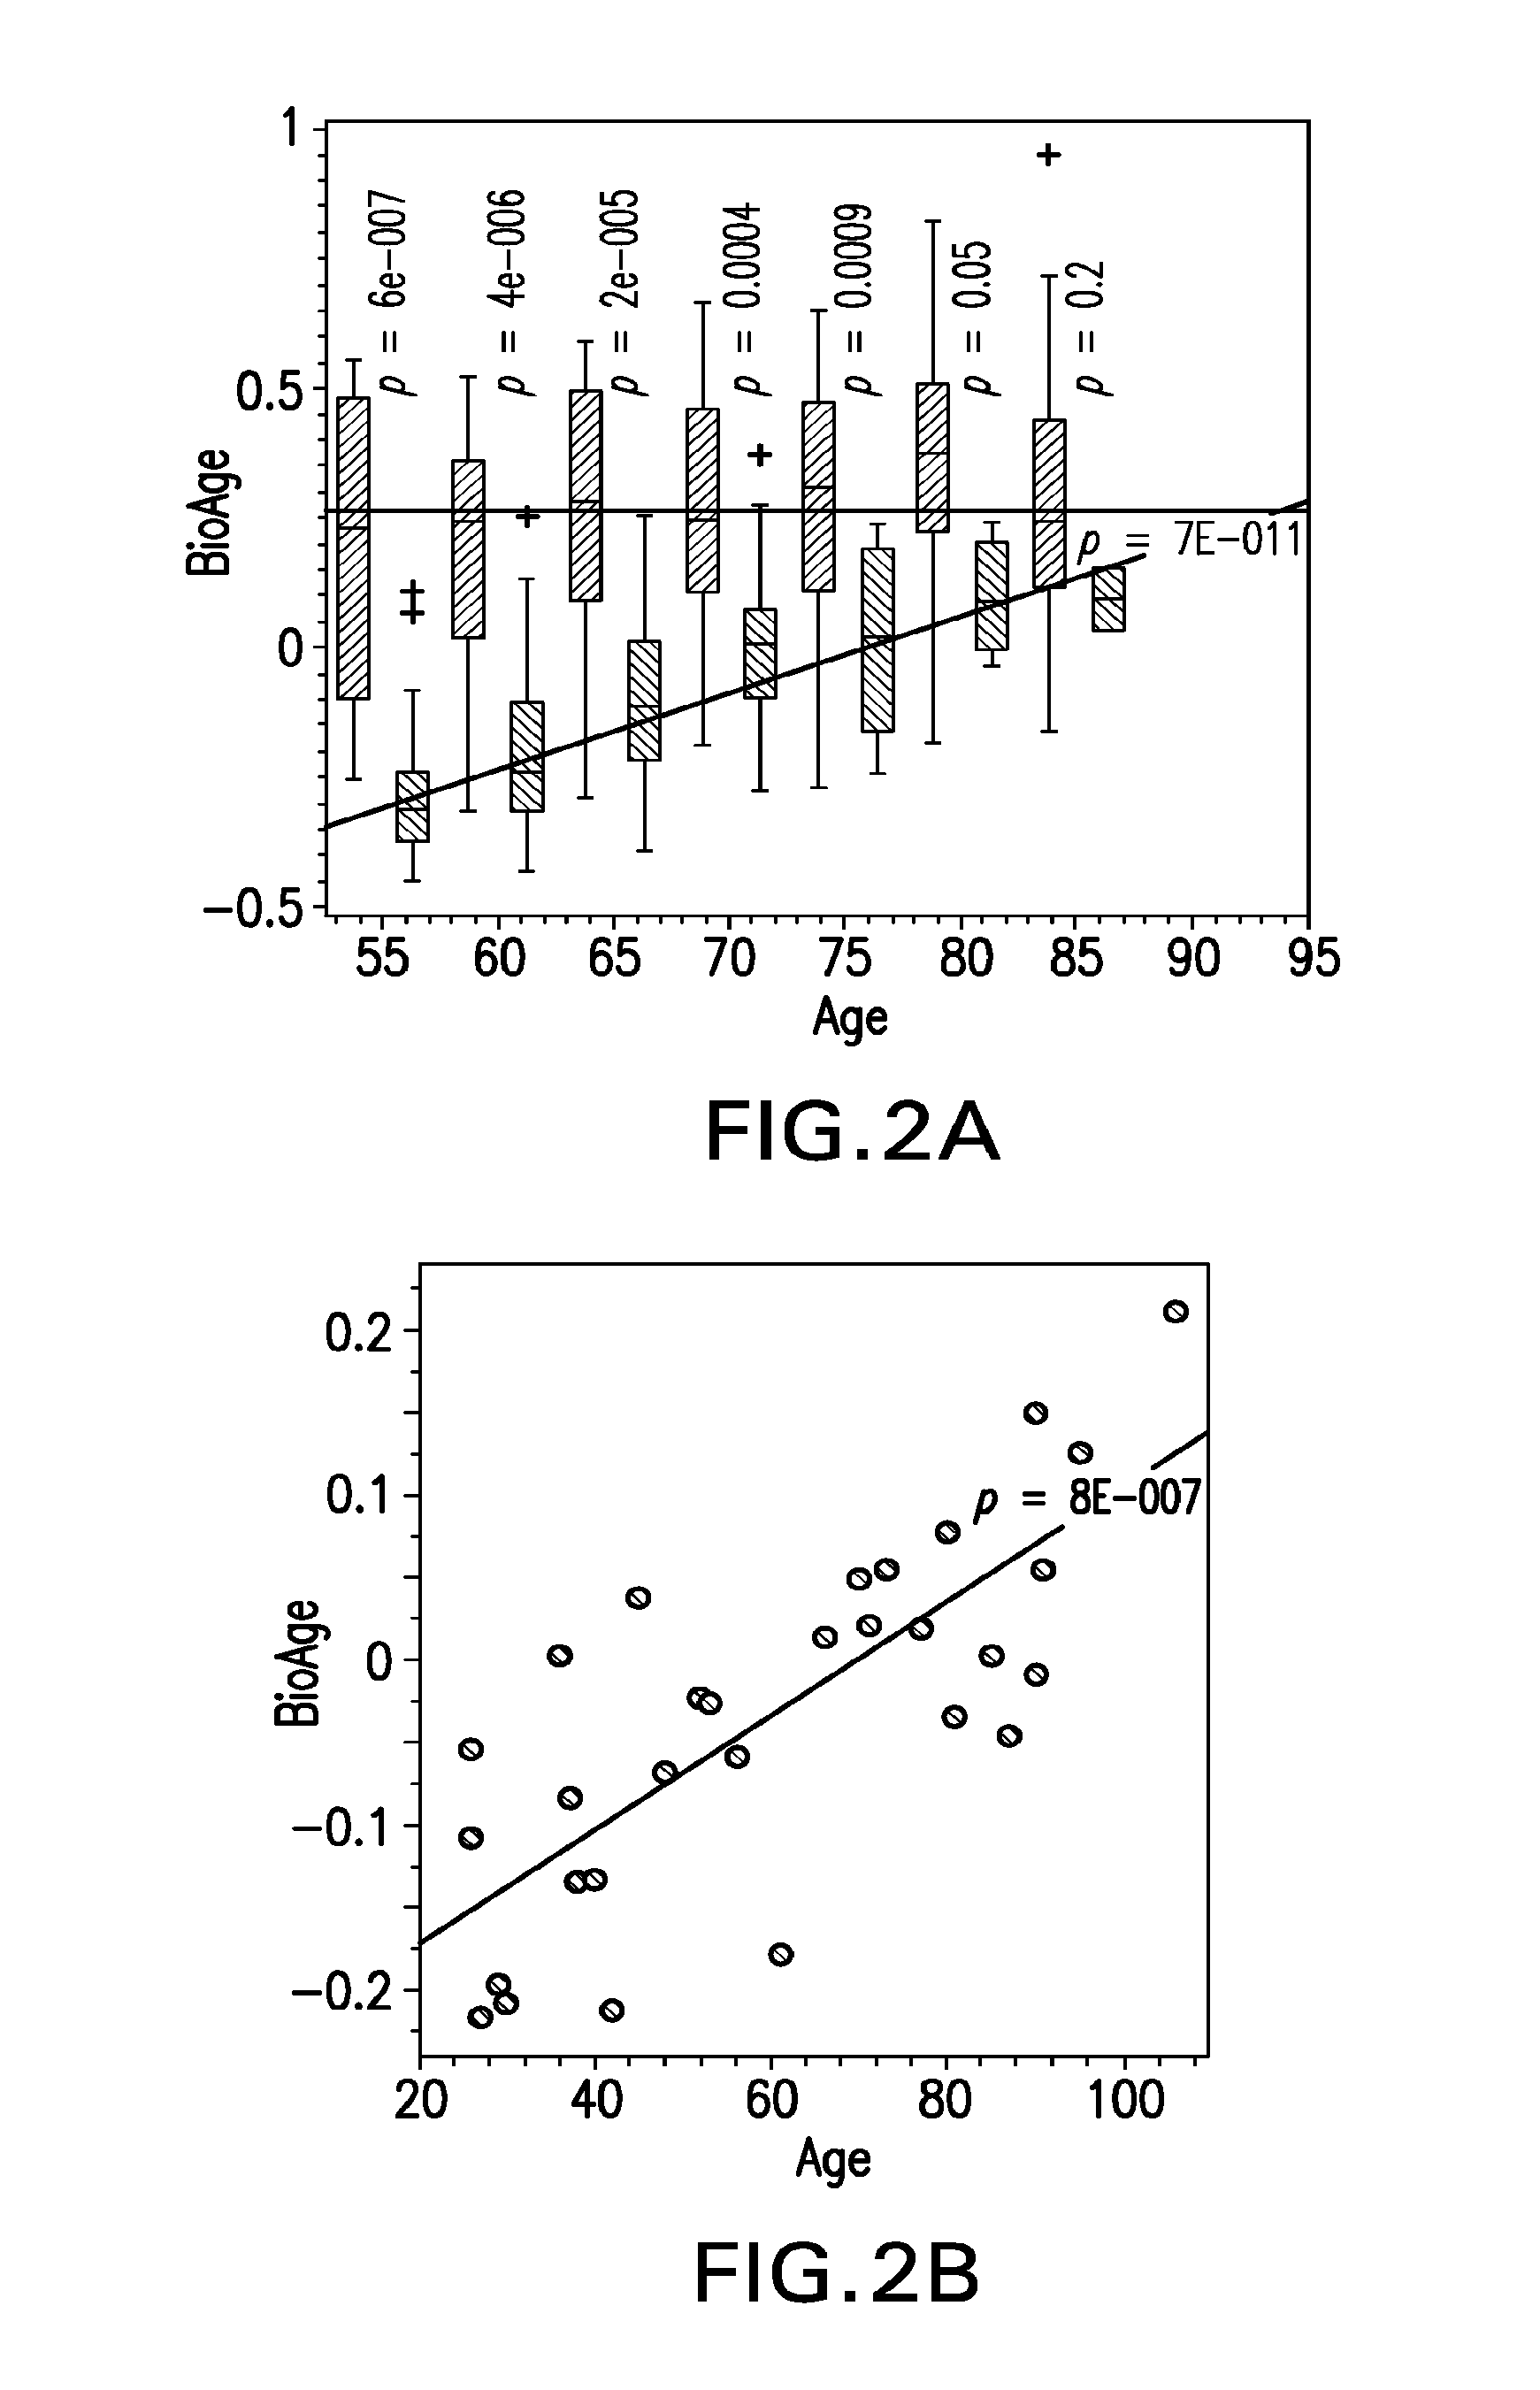
[0067]The first principal component (PC1) was used to assess the major pattern of gene expression variability in the dataset. Genes that were highly correlated with PC1 were used to build a surrogate biomarker. Throughout this work Applicants used Pearson correlation coefficients, ρ, and assessed their significance, p, assuming normal distribution for Fisher z-transformed values, atanh ρ (Rosner, 2010, Fundamentals of Biostatistics). Sign...
PUM
| Property | Measurement | Unit |
|---|---|---|
| resistance | aaaaa | aaaaa |
| adhesion | aaaaa | aaaaa |
| heat map | aaaaa | aaaaa |
Abstract
Description
Claims
Application Information
 - R&D
- Intellectual Property
- Life Sciences
- Materials
- Tech Scout
- Unparalleled Data Quality
- Higher Quality Content
- 60% Fewer Hallucinations
Browse by: Latest US Patents, China's latest patents, Technical Efficacy Thesaurus, Application Domain, Technology Topic, Popular Technical Reports.
© 2025 PatSnap. All rights reserved.Legal|Privacy policy|Modern Slavery Act Transparency Statement|Sitemap|About US| Contact US: help@patsnap.com


