
Digital Analysis of Molecular Analytes Using Electrical Methods

a technology of molecular analytes and electrical signals, applied in the field of digital analysis of molecular analytes using electrical methods, can solve the problems of insensitivity limitations of current methods, biases and inaccuracy of quantification of amplification techniques, and various limitations of current analyte analysis technologies

Inactive Publication Date: 2016-07-14
PACIFIC BIOSCIENCES
View PDF4 Cites 7 Cited by
  • Summary
  • Abstract
  • Description
  • Claims
  • Application Information

AI Technical Summary

Benefits of technology

The invention provides a composition that includes a probe region that specifically binds to a target analyte, a tail region that comprises a homopolymeric base region, and a linker region that connects the probe region and the tail region. The linker region can specifically bind to a portion of the tail region. The composition can be used to characterize the target analyte by contacting it with the probe region and detecting the output signals from the spatially separate regions of a substrate. The invention also provides methods for detecting the target analyte using the composition. The technical effect of the invention is to provide a more efficient and accurate method for identifying and characterizing target analytes.

Problems solved by technology

However, various limitations exist in current analyte analysis technologies.
For example, current methods have limitations of sensitivity, especially where analytes are present in biological samples at low copy numbers or in low concentrations.
However, amplification techniques introduce biases and inaccuracies into the quantification.
Moreover, amplification is not possible for protein and peptides.
Due to lack of sensitivity, approaches for detection and quantification often require relatively large sample volumes.
Current methods are also limited in their capacity for identification and quantification of a large number of analytes.
In addition, current technologies lack of capability to detect and quantify nucleic acids and proteins simultaneously.
Current methods often generate errors during analyte detection and quantification due to conditions such as weak signal detection, false positives, and other mistakes.
These errors may result in the misidentification and inaccurate quantification of analytes.

Method used


Image

  • Digital Analysis of Molecular Analytes Using Electrical Methods
  • Digital Analysis of Molecular Analytes Using Electrical Methods
  • Digital Analysis of Molecular Analytes Using Electrical Methods

Examples


example 1

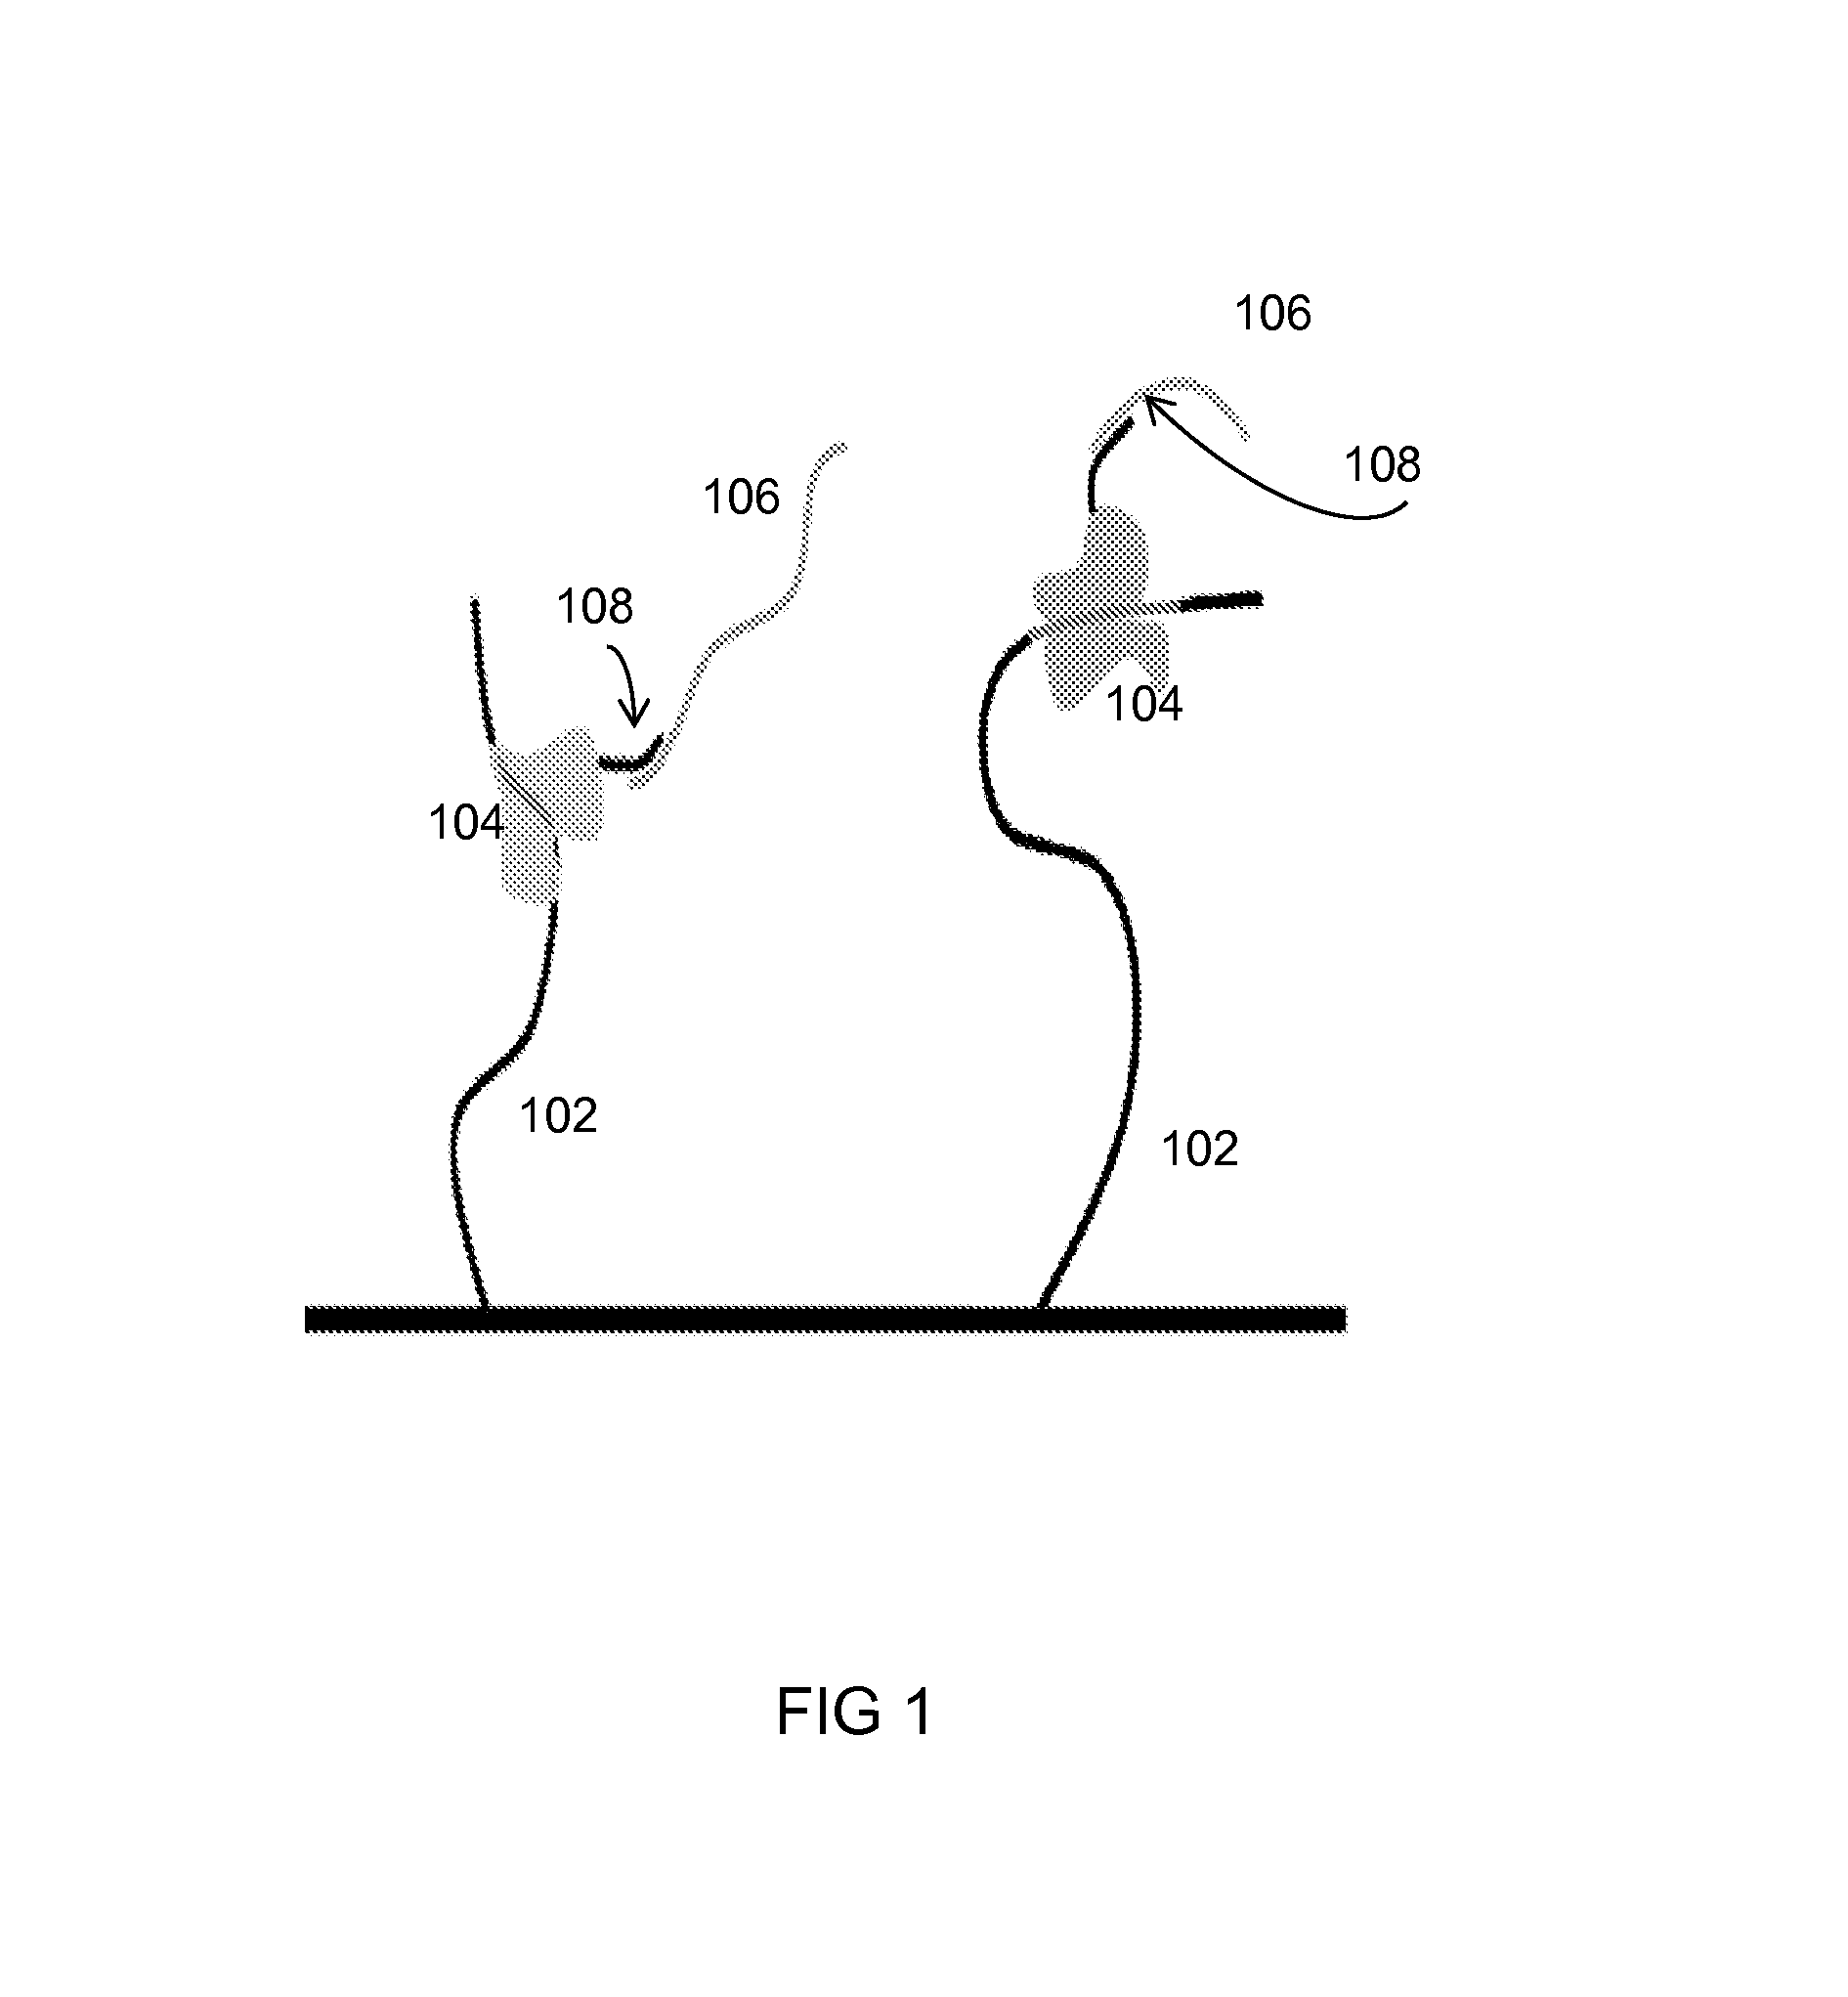
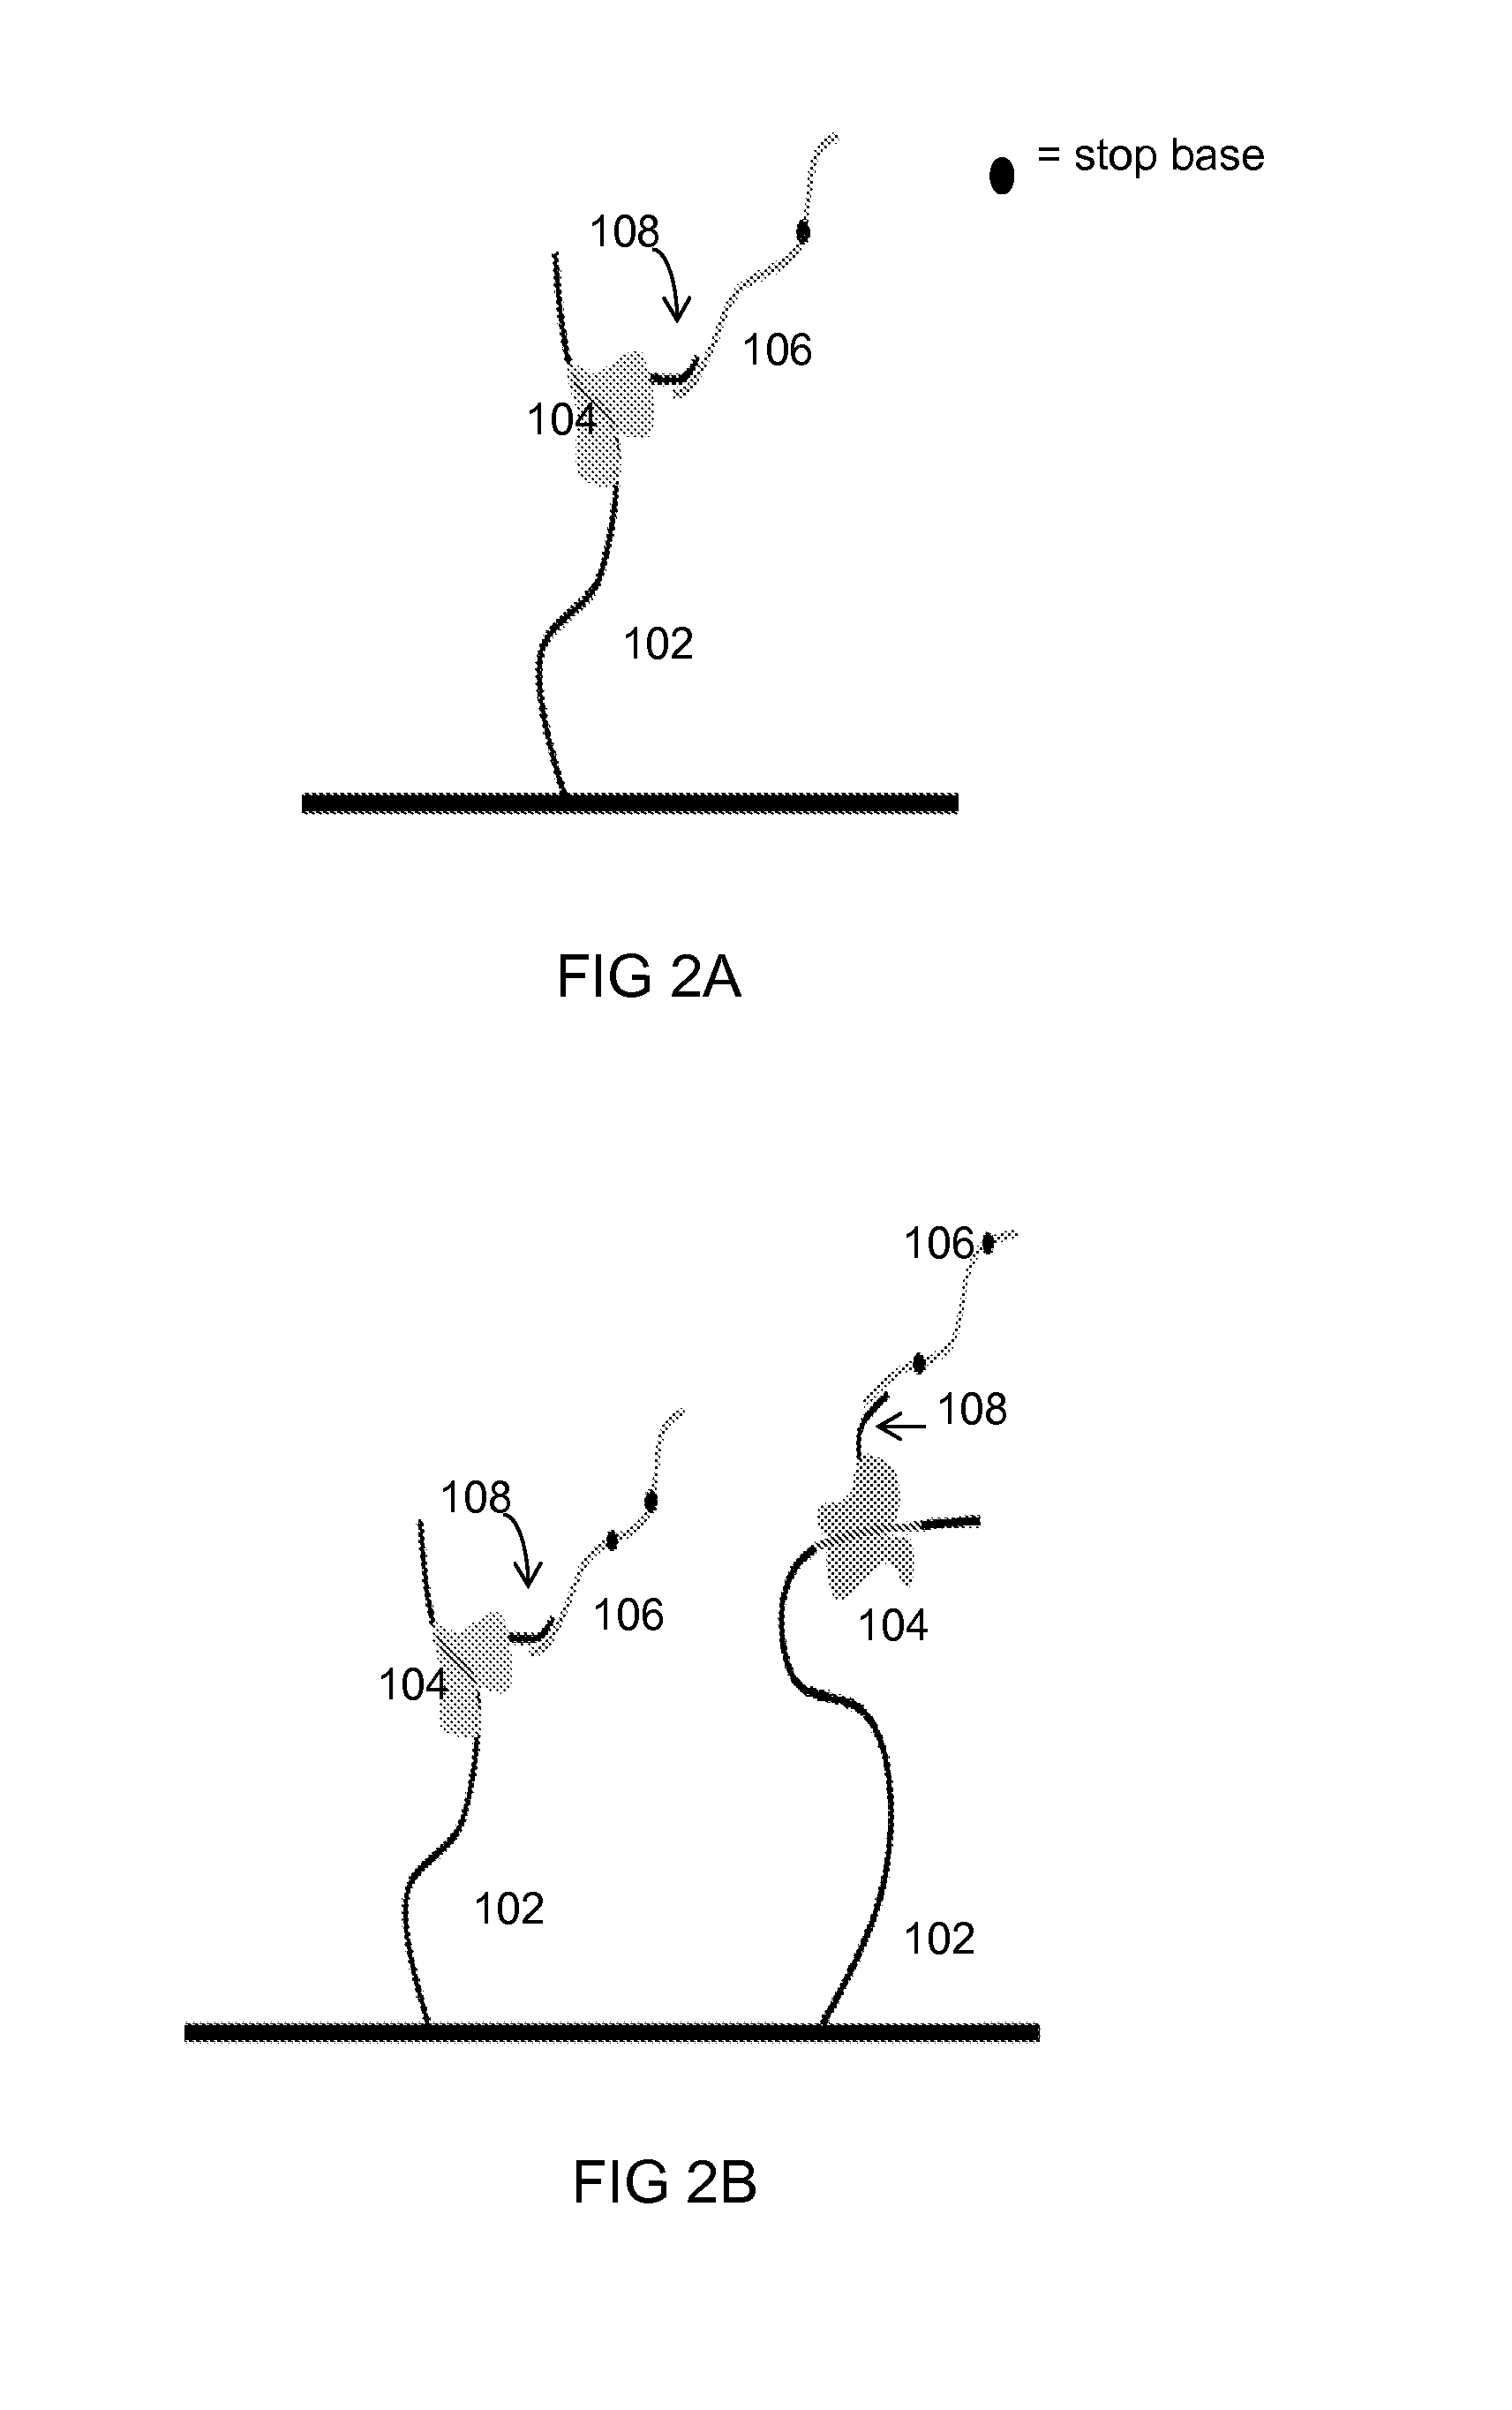
[0072]There are 8 distinct target analytes 102 immobilized on an integrated-circuit chip containing a plurality of transistors (i. e., ISFETs). Each target analyte 102 is specific for a distinct probe region 104 that includes one or more linker regions 108, each of which is specific for a particular tail region 106. 8 poly-A tail regions 106 are used in this Example, all having a length of 901 nucleotides. The identification length is 100 nucleotides, and one stop base of one stop base type (cytosine) is inserted within the tail. Table 1A shows the different tail regions 106 used, where “Leader length” represents the number of nucleotides upstream of the stop base, and “Trailer length” represents the number of nucleotides downstream of the stop base.

TABLE 1ATail regionLeaderStopTrailerNumberlengthBaselengthTail region #1100C800Tail region #2200C700Tail region #3300C600Tail region #4400C500Tail region #5500C400Tail region #6600C300Tail region #7700C200Tail region #8800C100

[0073]The n...

example 2

[0075]There are 16 distinct target analytes 102 immobilized on an integrated-circuit chip containing a plurality of transistors. Each target analyte 102 is specific for a distinct probe region 104 that includes one or more linker regions 108, each of which is specific for a particular tail region 106. 16 poly-A tail regions 106 are used in this Example, all having a length of 701 nucleotides. The identification length is 100, and one stop base of three stop base types (cytosine, guanine, or thymine) is inserted within the tail. Table 2A shows the different tail regions 106 used, where “Leader length” represents the number of nucleotides upstream of the stop base, and “Trailer length” represents the number of nucleotides downstream of the stop base.

TABLE 2ATail regionLeaderStopTrailerNumberlengthBaselengthTail region #1100C600Tail region #2200C500Tail region #3300C400Tail region #4400C300Tail region #5500C200Tail region #6600C100Tail region #7100G600Tail region #8200G500Tail region #...

example 3

[0078]There are 256 distinct target analytes 102 immobilized on an integrated-circuit chip containing a plurality of transistors. Each target analyte 102 is specific for a distinct probe region 104 that includes one or more linker regions 108, each of which is specific for a particular tail region 106. 16 poly-A tail regions 106 are used in this Example, all having a length of 402 nucleotides. The identification length is 100, and two stop bases of a combination of three stop base types (cytosine, guanine, or thymine) are inserted within the tail. Table 3A shows the different tail regions 106 used, where “Leader length” represents the number of nucleotides upstream of Stop base #1, “Mid length” represents the number of nucleotides upstream of Stop base #2, and “Trailer length” represents the number of nucleotides downstream of Stop base #2.

TABLE 3ATail region 106LeaderStopMidStopTrailernumberlengthbase #1Lengthbase #2lengthTail region #1100C100C200Tail region #2100C200C100Tail regio...


PUM

PropertyMeasurementUnit
lengthsaaaaaaaaaa
acidaaaaaaaaaa
mass spectrometryaaaaaaaaaa

Abstract

Electrical detection methods are used to identify and further characterize single-molecule target analytes such as proteins and nucleic acids. A composition including a probe region and a tail region is contacted with a target analyte. The probe region specifically binds to the target analyte. The tail region is coupled to the probe region, and includes a nucleic acid template for polynucleotide synthesis. When conditions are such that polynucleotide synthesis occurs along the tail region, one hydrogen ion is released for every nucleotide that is incorporated into the tail region. A transistor such as an ISFET detects and measures changes in ion concentration, and these measurements can be used to identify the tail region and thus characterize the corresponding target analyte.

Description

CROSS-REFERENCE TO RELATED APPLICATIONS[0001]This application claims priority to U.S. Provisional Application No. 61 / 868,988, filed on Aug. 22, 2013, which is incorporated by reference herein in its entirety. This application also incorporates by reference in their entirety U.S. Provisional Application No. 61 / 728,067 and International Pat. Application No. PCT / US2013 / 070797.BACKGROUND[0002]1. Technical Field[0003]This disclosure relates compositions and methods useful for the electrical detection of molecules, and more specifically, to the use of digitized electrical signals and the use of error correction protocols to characterize complex mixtures of target analytes.[0004]2. Description of the Related Art[0005]Multiple molecular and biochemical approaches are available for molecular analyte identification and quantification. Examples include commonly used nucleic acid-based assays such as qPCR (quantitative polymerase chain reaction) and DNA microarray, and protein-based approaches ...

Claims


Application Information

Patent Timeline
Patent Type & Authority Applications(United States)
IPC IPC(8): C12Q1/68G01N27/414
CPCC12Q1/6825C12Q1/6837G01N27/4145C40B20/04G01N33/58G01N2458/10C12Q1/6804C12Q2525/161C12Q2525/173C12Q2525/197C12Q2525/204C12Q2565/607
Inventor STAKER, BRYANLIU, NIANDONGMCLAUGHLIN, BART LEE
Owner PACIFIC BIOSCIENCES
Learn More