Methods and systems of proteome analysis and imaging

a proteome and proteome technology, applied in the field of proteome highthroughput analysis and/or imaging, can solve the problems of limiting the ability to analyze small samples and resolve microheterogeneity within tissues, the inability to effectively prepare and deliver such trace samples to the analytical platform, and the lack of effective analytical tools for performing high-throughput proteome analysis and/or probing the spatial distribution. , to achieve the effect of reducing the total processing volume and minimizing losses

Active Publication Date: 2018-10-18
BATTELLE MEMORIAL INST
View PDF5 Cites 5 Cited by
  • Summary
  • Abstract
  • Description
  • Claims
  • Application Information

AI Technical Summary

Benefits of technology

[0007]Provided herein, inter alia, are compositions and methods for processing and analysis of small cell populations and biological samples (e.g., a robotically controlled chip-based nanodroplet platform). In particular aspects, the methods described herein can reduce total processing volumes from conventional volumes to nanoliter volumes within a single reactor vessel (e.g., within a single droplet reactor) while minimizing losses, such as due to sample evaporation.
[0008]Embodiments described herein can provide advantages over existing methods, which can require samples including a minimum of thousands of cells to provide in-depth proteome profiling. As described herein, embodiments of the disclosure can dramatically enhance the efficiency and recovery of sample processing through downscaling total processing volumes to the nanoliter range, while substantially avoiding sample loss.
[0023]In embodiments, the platform further includes a membrane interposed between the spacer and the cover, the membrane configured to form a gas-tight seal between the spacer and the cover to minimize evaporation. The platform may be formed from a material that is substantially optically transparent (e.g., glass). In further embodiments, the platform may include at least one hydrophobic surface surrounding the at least one reactor vessel.
[0025]Also provided herein, inter alia, are methods and systems for proteome analysis that are at least partially automated and / or performed robotically. In particular aspects, the methods and systems described herein can rapidly and efficiently provide protein identification of each of the proteins from a proteome or a complement of proteins obtained from extremely small amounts of biological samples. In some embodiments, the identified proteins can be imaged quantitatively over a spatial region. Automation and robotics facilitates the throughput of the methods and systems, which enables proteome analysis and imaging. However, the small sample size poses a challenge to automation that is overcome by the embodiments described herein. In one example, dilution of a processed sample with buffer yields a diluted sample having sufficient volume to be handled by a MS-based analytical instrument autosampler. Unexpectedly, the dilution of the processed sample still yields sufficient signal-to-noise ratio for analysis.

Problems solved by technology

Mass spectrometry (MS)-based proteomic analyses can require samples comprising thousands to millions of cells to provide an in-depth profile of protein expression, which can severely limit the ability to analyze small samples and resolve microheterogeneity within tissues.
While MS sensitivity has steadily improved, the inability to effectively prepare and deliver such trace samples to the analytical platform has proven limiting.
Furthermore, there is an absence of effective analytical tools for performing high-throughput proteome analysis and / or probing the spatial distribution of the proteome without the use of labels and / or antibodies.
The use of labels and / or antibodies requires a priori knowledge of the protein targets, long / expensive lead times, and introduction of undesirable artefacts.
While mass spectrometry imaging (MSI) has emerged as a powerful tool for mapping the spatial distribution of metabolites and lipids across tissue surfaces, significant technical hurdles have limited the effective application of MSI techniques to the analysis of proteomes.

Method used


Image

  • Methods and systems of proteome analysis and imaging
  • Methods and systems of proteome analysis and imaging
  • Methods and systems of proteome analysis and imaging

Examples


example 1

et

NanoPOTS Platform Design and Operation

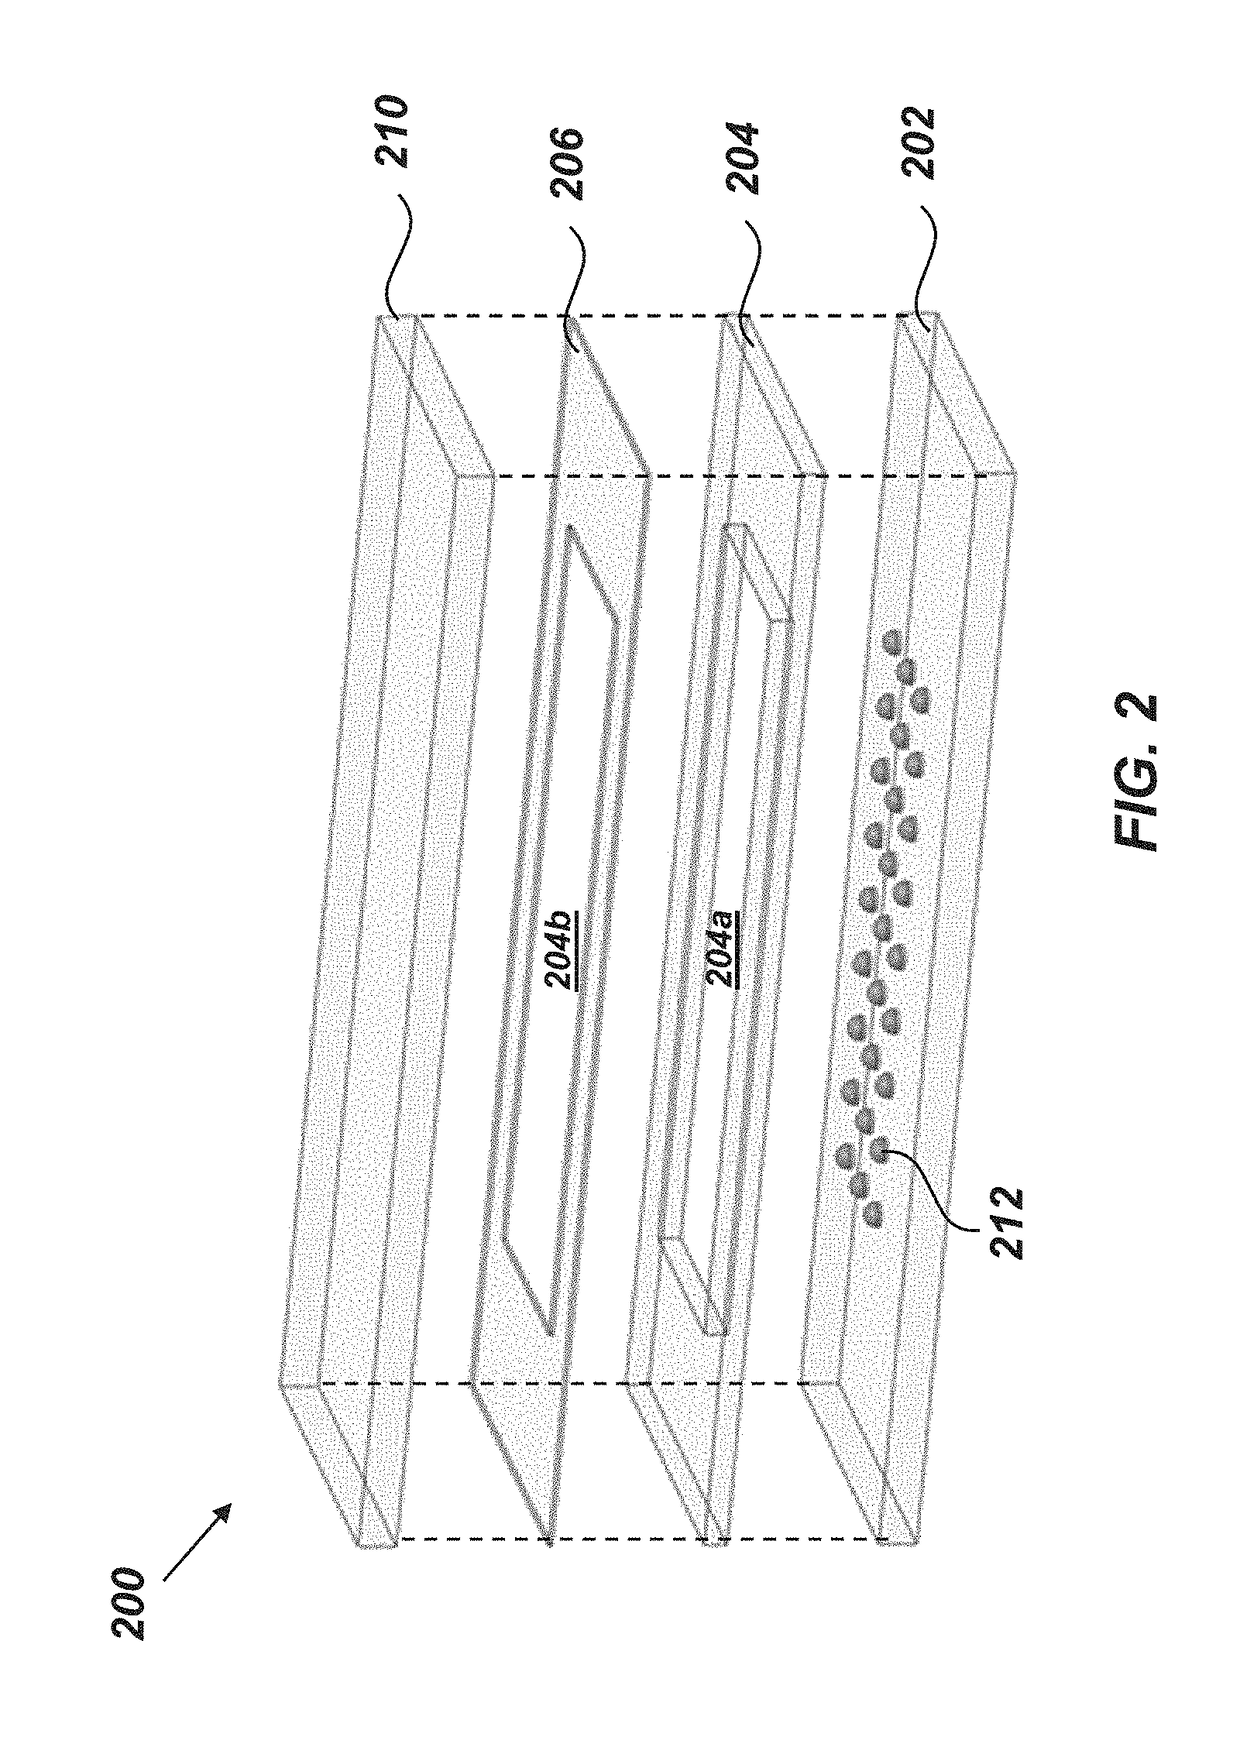
[0135]An exemplary embodiment of a nanoPOTS chip, also referred to as a platform or chip 200, is illustrated in FIG. 2. The chip 200 can include a substrate 202, a spacer 204, one or more sealing membrane 206, and a cover 210. When the chip is assembled, the spacer 204 can overlie the substrate 202, the sealing membrane 206 can overlie the spacer 204, and the cover 210 can overlie the sealing membrane 206.

[0136]In certain embodiments, the substrate 202, the spacer 204, and the cover 210 can be formed from a material that is transparent to optical light (e.g., glass). Forming the substrate 202 from glass can facilitate microscopic imaging of samples and minimize protein and peptide adsorption relative to many other materials due to its hydrophilicity and reduced surface charge at low pH (Zhu, Y, et al.).

[0137]As discussed in greater detail below, the substrate 202 can include a physical and / or chemical pattern 212 that defines at least one reac...

example 2

Interface with FACS

[0172]Additionally, experiments showed that the nanoPOTS chip directly interfaced with fluorescence-activated cell sorting (FACS) for cell isolation. With the photolithography-based microfabrication technique, the nanodroplet array size and density can be easily scaled for increased preparation throughput.

[0173]While the current demonstrated limit is to analyze of as few as 10 cells, nanoPOTS represented a highly promising platform towards single mammalian cell proteomics with optimized processing volumes and further refinements to the LC-MS platform. To maximize the overall sensitivity of nanoPOTS for single cells, the total processing volume could be reduced to the low-nanoliter range to further minimize sample loss. FACS or other cell isolation techniques should be used to isolate single cells into nanowells without the minimal exogenous contamination from, e.g., secreted proteins or lysed cells. NanoLC columns with narrower bore (Shen, Y. et al. 2004, and Shen...

example 3

with LCM and Capture Liquid

[0174]Nanowells are prepopulated with DMSO droplets to serve as a sacrificial capture medium for small tissue samples in the nanoPOTS chip (FIGS. 29A-29E) as described below in detail.

[0175]Reagents and chemicals. Deionized water (18.2 MΩ) generated from a Barnstead Nanopure Infinity system (Los Angeles, Calif.) was used throughout. Dithiothreitol (DTT) and iodoacetamide (IAA) were from ThermoFisher Scientific (St. Louis, Mo.), and their working solutions were freshly prepared in 50 mM ammonium bicarbonate buffer before use. n-dodecyl-β-D-maltoside (DDM), Mayer's hematoxylin, eosin Y (alcoholic solution), Scott's Tap Water Substitute, DMSO were purchased from Sigma-Aldrich. Trypsin (MS grade) and Lys-C (MS grade) were from Promega (Madison, Wis.). Other unmentioned reagents were obtained from ThermoFisher.

[0176]Nanowell chip fabrication. The nanowell chip consisted of three parts including a nanowell-containing substrate, a spacer, and a cover plate. The n...


PUM

PropertyMeasurementUnit
areaaaaaaaaaaa
total surface areaaaaaaaaaaa
surface areaaaaaaaaaaa

Abstract

Provided herein are methods and systems for proteome analysis that are at least partially automated and / or performed robotically. In some aspects, the methods and systems described herein can rapidly and efficiently provide protein identification of each of the proteins from a proteome, or a complement of proteins, obtained from extremely small amounts of biological samples. The identified proteins can be imaged quantitatively over a spatial region. Automation and robotics facilitates the throughput of the methods and systems, which enables protein imaging and / or rapid proteome analysis.

Description

CROSS-REFERENCE TO RELATED APPLICATIONS[0001]This application is a continuation-in-part of U.S. application Ser. No. 15 / 897,022, filed Feb. 14, 2018, which is a continuation-in-part of International Application No. PCT / US2017 / 060399, filed Nov. 7, 2017, which claims the benefit of priority to U.S. Provisional Application No. 62 / 418,544, filed Nov. 7, 2016, all of which are hereby incorporated in their entirety.STATEMENT UNDER FEDERALLY SPONSORED RESEARCH AND DEVELOPMENT[0002]This invention was made with Government support under grant nos. R21EB020976, P41GM103493, R33CA225248, and R21HD084788 awarded by the National Institutes of Health and under contract number DE-AC05-76RL01830 awarded by the Department of Energy. The government has certain rights in the invention.FIELD[0003]Embodiments of the disclosure relate generally to systems and methods for proteome analysis and particularly to proteome high-throughput analysis and / or imaging.BACKGROUND[0004]Human tissues are often highly h...

Claims


Application Information

Patent Timeline
Patent Type & Authority Applications(United States)
IPC IPC(8): G01N33/68G06F19/26G16B45/00
CPCG01N33/6842G01N33/6848G06F19/26G01N2570/00G01N2333/4716G16B45/00
Inventor PIEHOWSKI, PAUL D.ZHU, YINGKELLY, RYAN T.BURNUM-JOHNSON, KRISTIN E.MOORE, RONALD J.
Owner BATTELLE MEMORIAL INST
Why Eureka
Try Eureka