
Methods for analysis of single molecule localization microscopy to define molecular architecture

a localization microscopy and molecular architecture technology, applied in the field of superresolution microscopy, can solve the problems of inability of second-order statistics to deal with localized shape and size properties of homogenous clusters, computational intensive ripley's function calculation, and inability to handle millions of points

Pending Publication Date: 2020-09-24
SIMON FRASER UNIVERSITY +1
View PDF4 Cites 4 Cited by
  • Summary
  • Abstract
  • Description
  • Claims
  • Application Information

AI Technical Summary

Benefits of technology

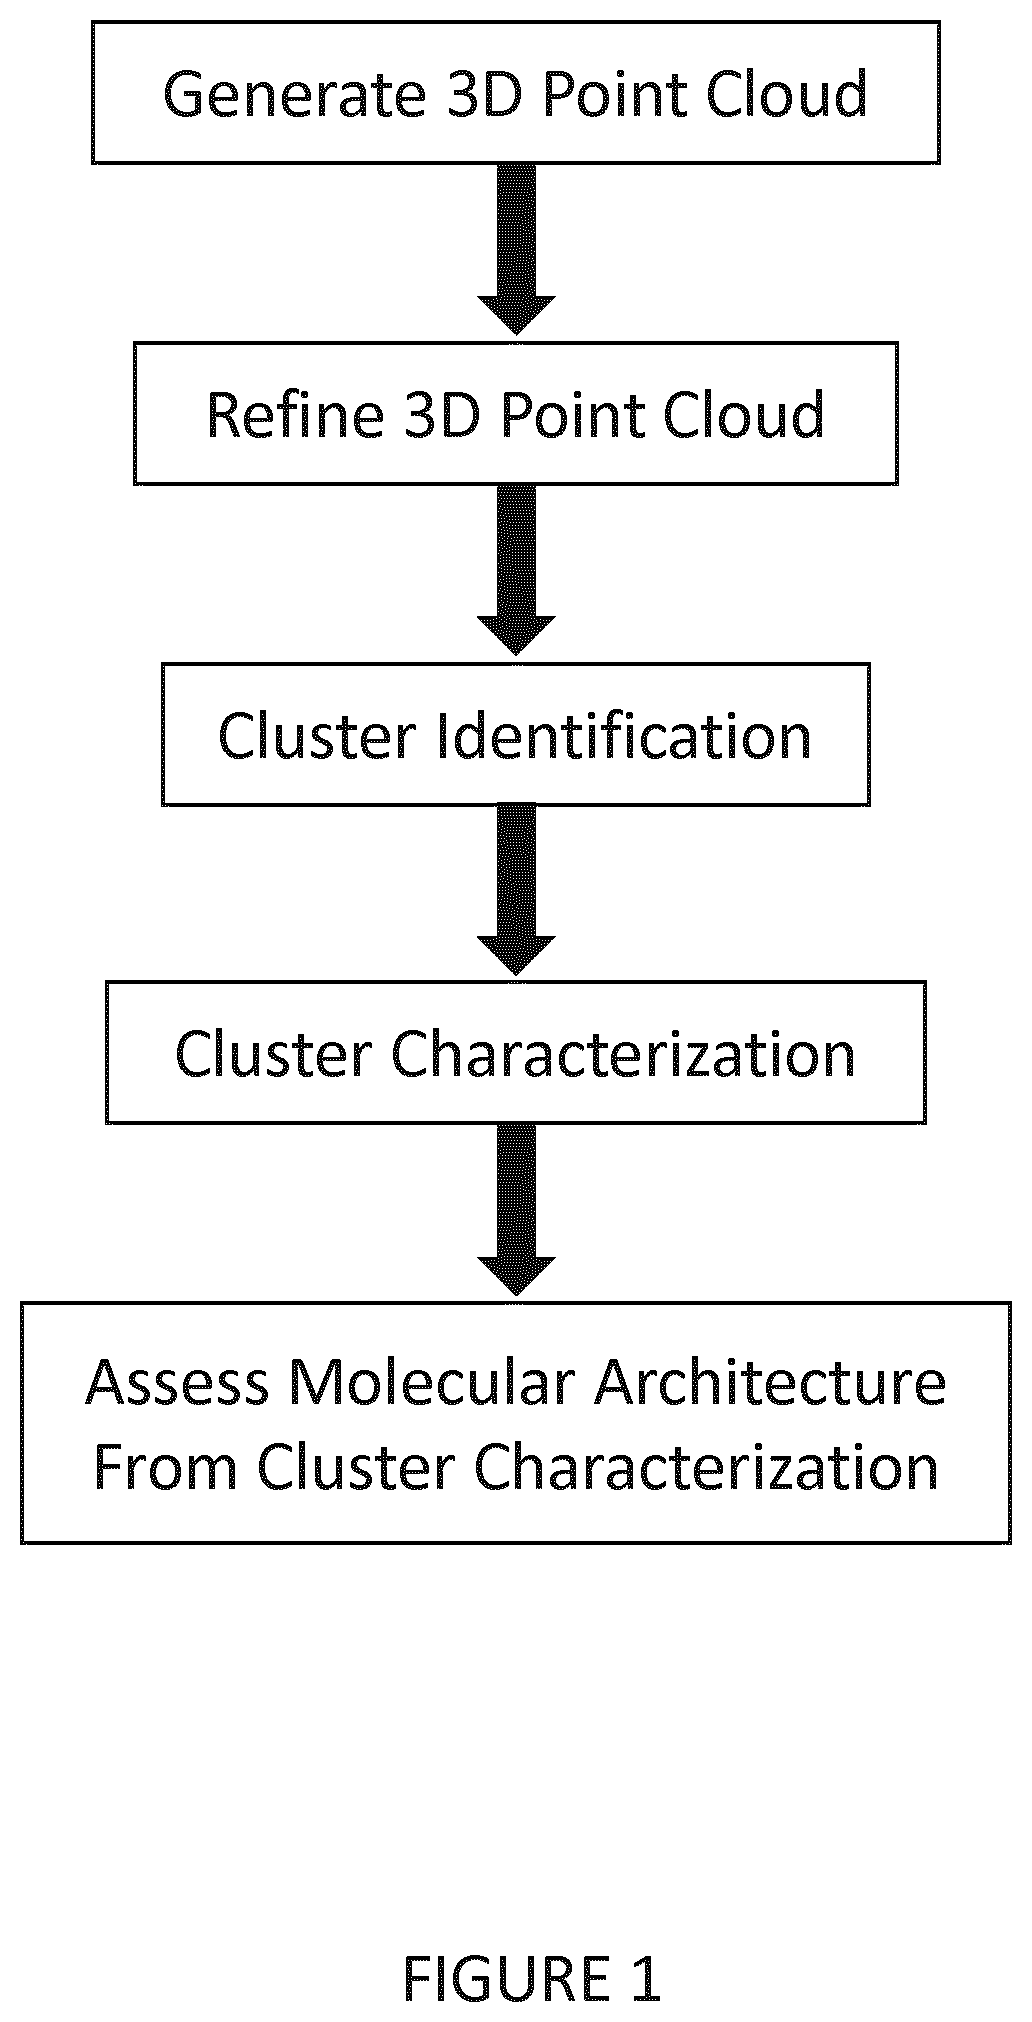
The present invention provides methods for analyzing single molecule localization microscopy to define molecular architecture. The methods involve mapping the three-dimensional location of each single emission event in a plurality of single emission events from a series of optical images of a sample to create a point cloud, and refining the point cloud. The refining can include merging two or more single emission events, removing one or more single emission events, and adding one or more single emission events. The method can also identify clusters within the point cloud and characterize the individual clusters by determining their geometrical, topological, and / or physical properties. The present invention also provides a non-transitory computer readable medium containing program instructions for implementing the methods. Additionally, the invention provides a method of identifying assessing a candidate drug, which involves comparing the molecular architecture of a control sample and a sample treated with the drug using super-resolution microscopy.

Problems solved by technology

While useful for global cluster analysis, these second-order statistics have limited ability to deal with localized shape and size properties of homogenous clusters.
Moreover, calculating the Ripley's function is computationally intensive making it impractical for handling millions of points (Levet et al., 2015).
Several correction methods were proposed to solve the edge effect problem but at the expense of even further increase in computational complexity making it unfeasible to scale to SMLM big-data.

Method used


Image

  • Methods for analysis of single molecule localization microscopy to define molecular architecture
  • Methods for analysis of single molecule localization microscopy to define molecular architecture
  • Methods for analysis of single molecule localization microscopy to define molecular architecture

Examples


example 1

Introduction

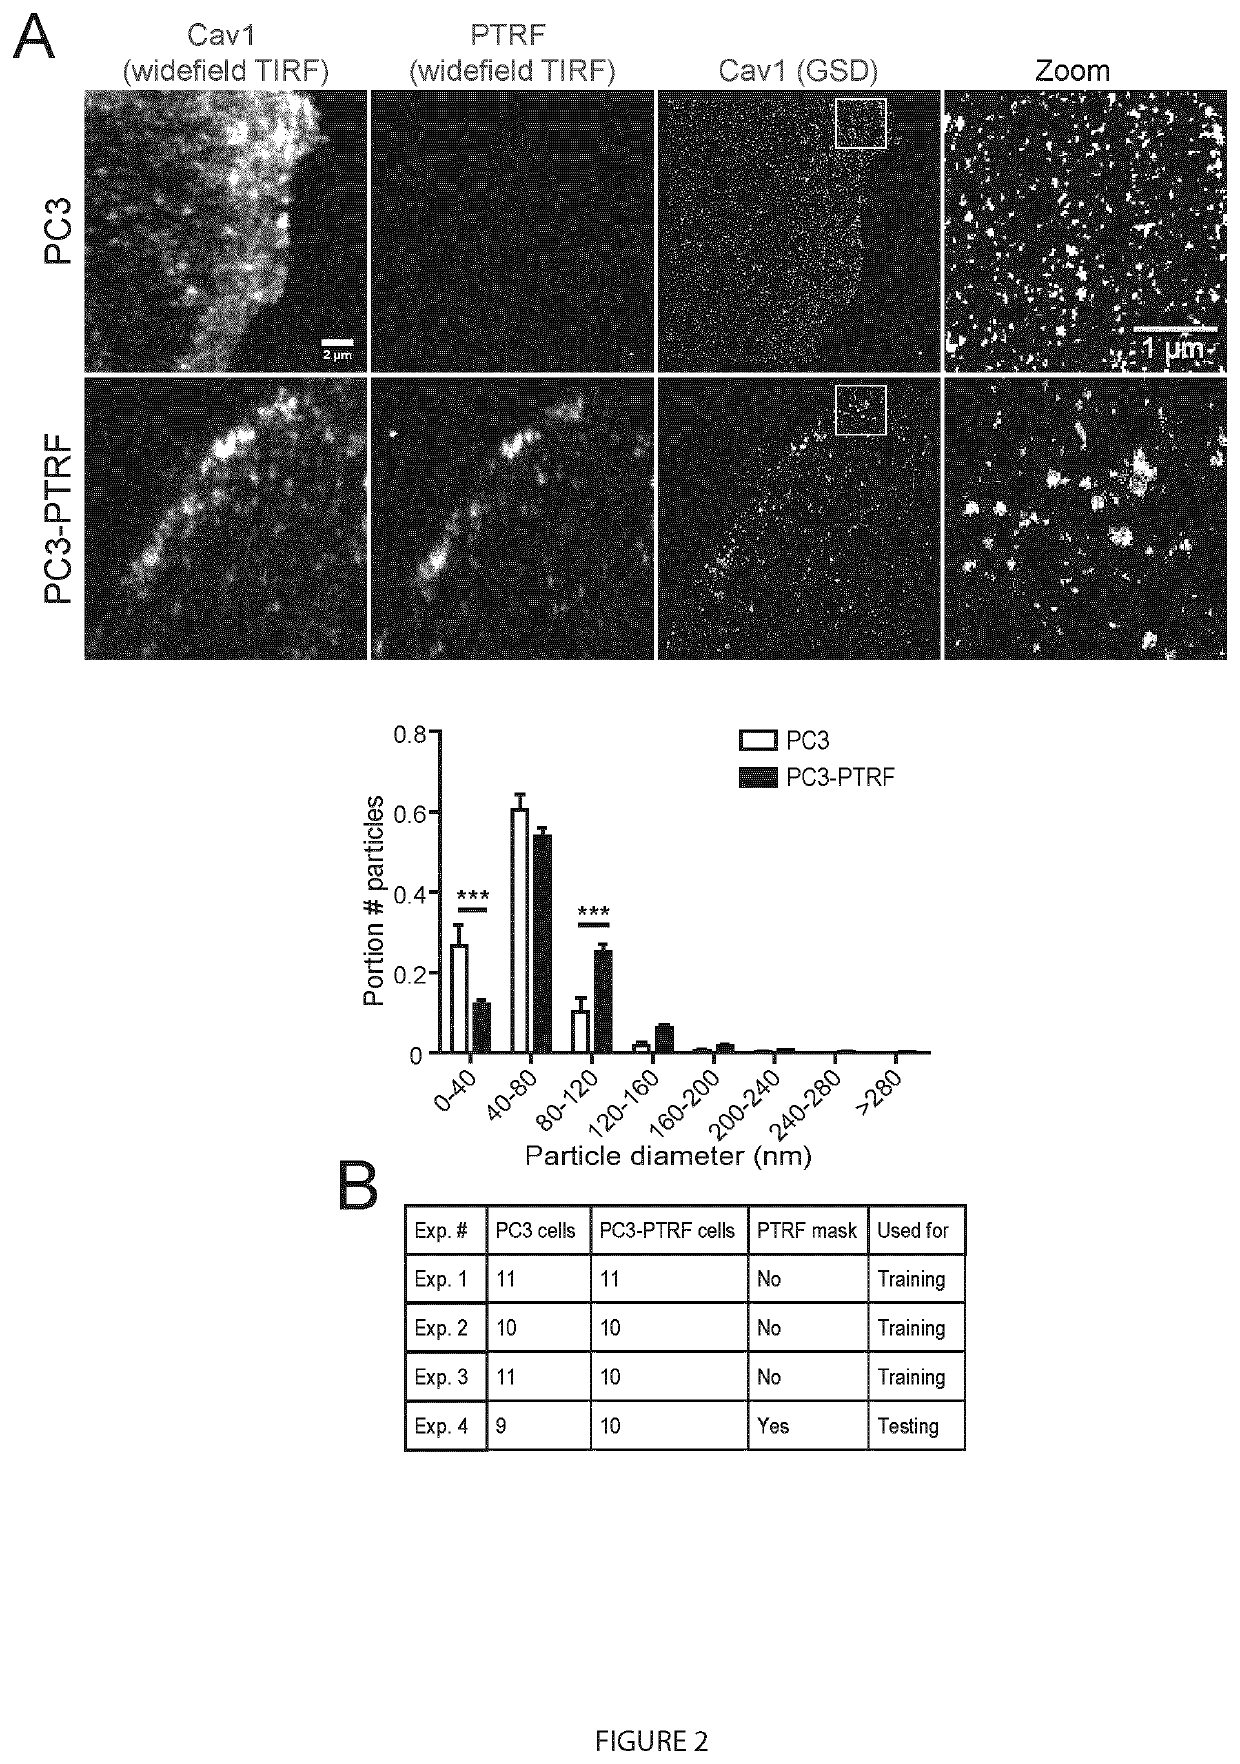
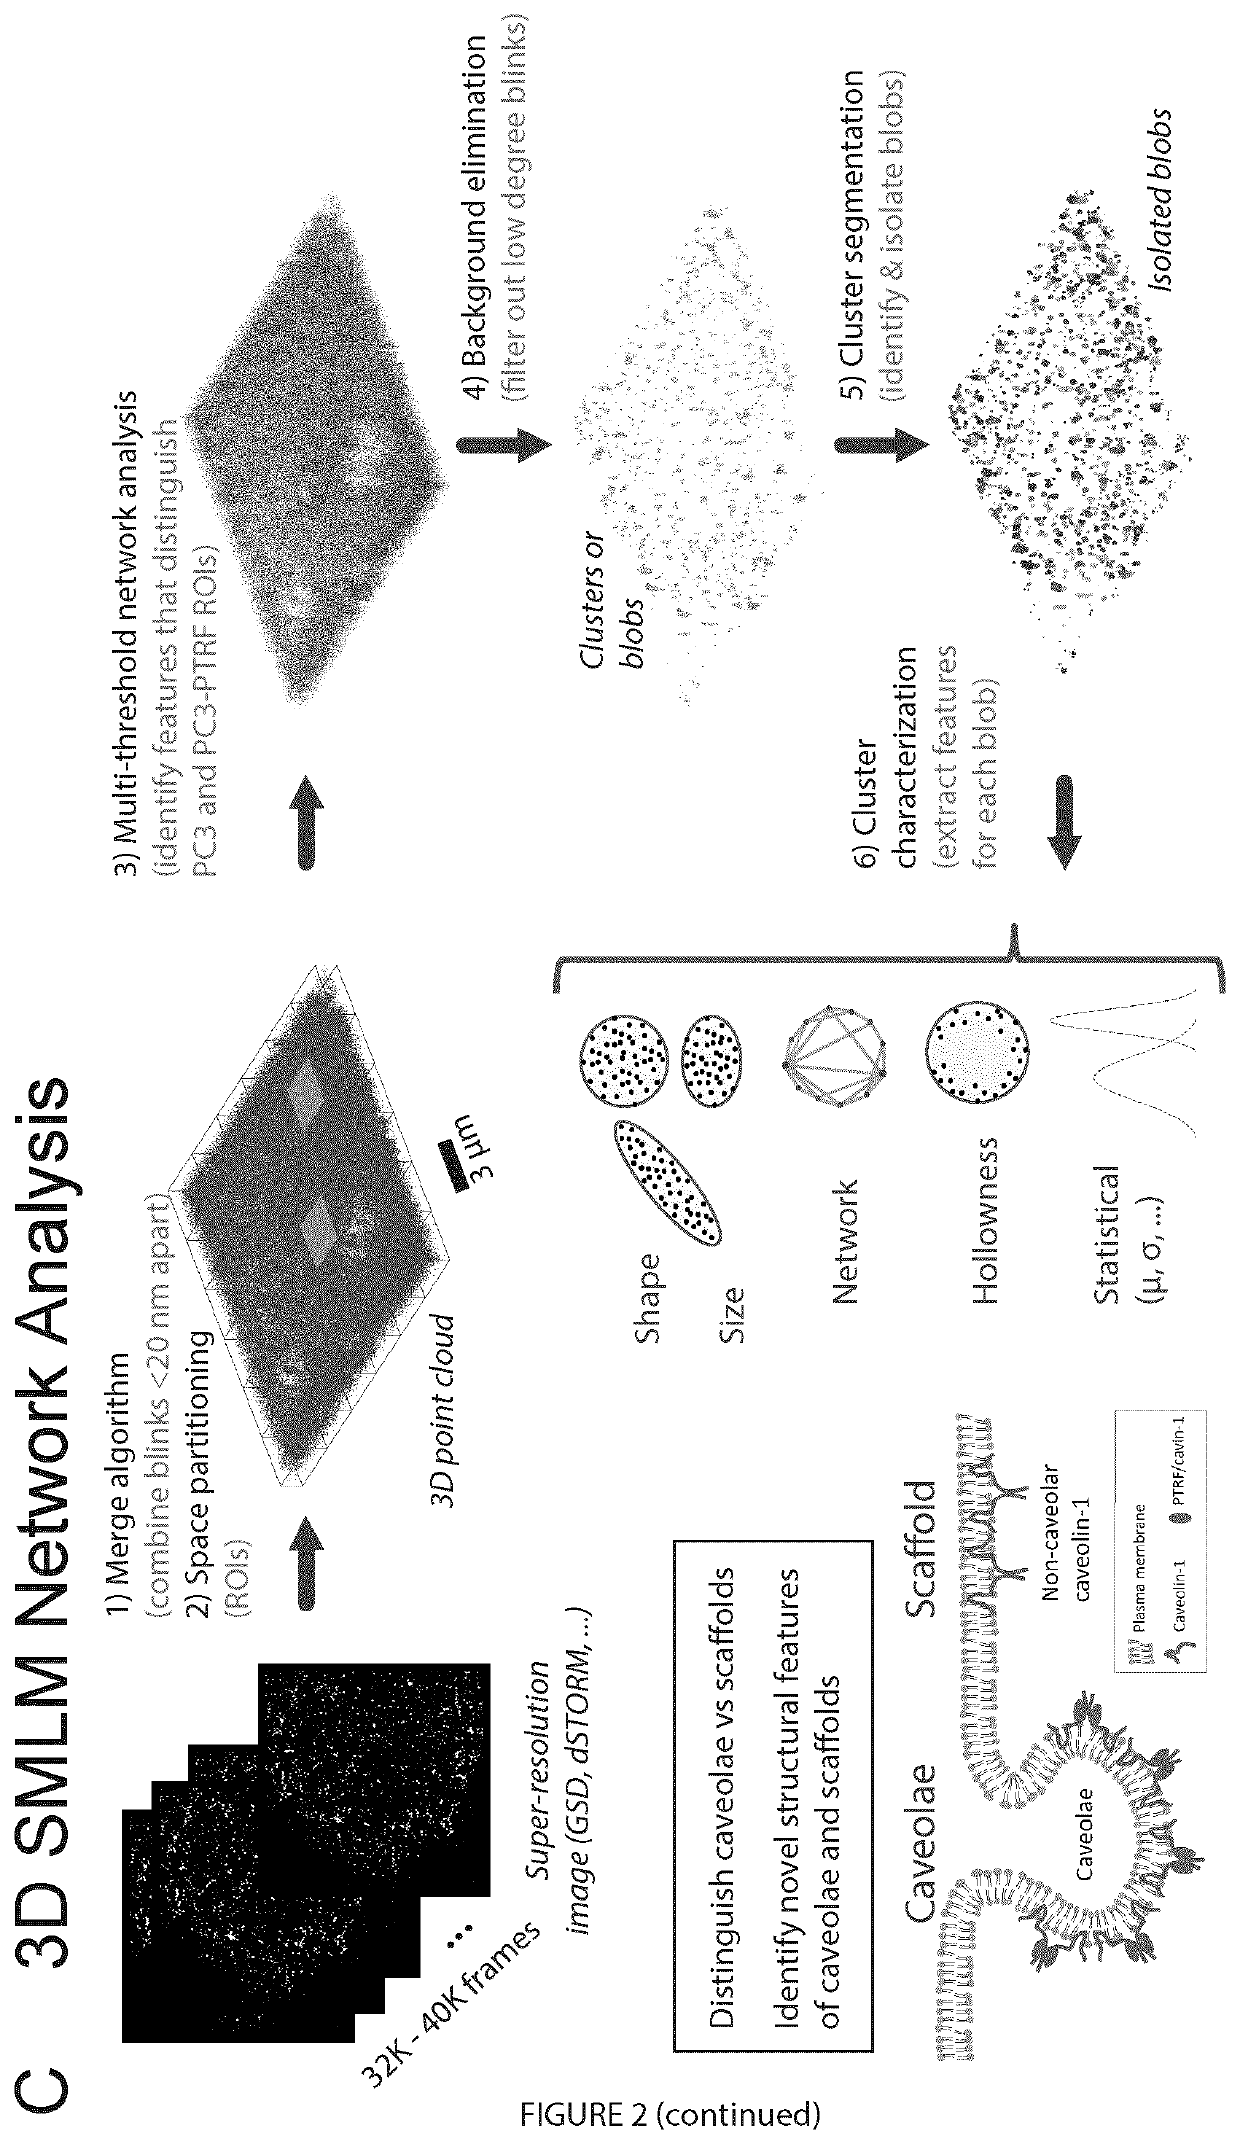
[0086]In this example, a 3D point cloud (Botsch et al., 2010; Aldoma et al., 2012; Berger et al., 2014) was used to model SMLM data. Virtual connections between points transform the point cloud into a network modeled computationally as a graph with nodes (or vertices); edges are connections between nodes (points) that weight the distance between nodes. Such network representations have been widely and successfully adopted for analysis of brain, social and computer networks (Barabasi and Oltvai, 2004; Newman, 2010; Baronchelli et al., 2013; Sporns, 2013; Brown et al., 2014). Using machine learning approaches, features that distinguish networks were identified and used to understand the underlying organization or architecture of the network. Here point cloud network analysis was applied to SMLM data sets to define the molecular architecture of plasma membrane associated caveolae and caveolin-1 (Cav1) scaffolds.

[0087]Formation of caveolae, 50-100 nm plasma membrane invagina...

example 2

olution Modularity Analysis Shows that Polyhedral Caveolin-1 Oligomers Combine to Form Scaffolds and Caveolae

Introduction

[0114]Of the various super-resolution microscopy approaches, the best resolution is obtained using single-molecule localization microscopy (SMLM), based on the repeated activation (blinking) of small numbers of discrete fluorophores, usually through dSTORM. Precise localization of these blinks is determined from a Gaussian fit of the point-spread function (PSF) providing ˜20 nm X-Y (lateral) resolution and ˜25-50 nm Z (axial) resolution for astigmatic lens 3D SMLM (Huang et al., 2008; Shroff et al., 2008). SMLM generates point coordinates in 3D space that can then be

[0115]used to reconstruct localizations with significantly improved resolutions. An alternate approach to study point distributions is to visualize them as a graph or network. Graphs are mathematical structures used to model interactions between entities for many systems, with the entities represented ...

example 3

ation of Caveolin-1 Domain Signatures Via Graphlet Analysis of Single Molecule Super-Resolution Data

Introduction

[0134]Graphs are ubiquitous and powerful mathematical structures used for modeling objects and their interactions. Graph-based network analysis have been used in many fields of study and helped in understanding the behavior of many systems. The network is a set of items known as nodes, with connections between them, known as edges (Newman, 2003). There are many successful realworld examples of leveraging network in analyzing social, computer, brain, and biological networks (Newman, 2003, Bassett and Sporns, 2017, Krivitsky et al., 2009, Costa et al., 2008, Zitnik and Leskovec, 2017, Brown et al., 2014). Recently, a graph-based complex network analysis clustering method (Khater et al., 2018) was used to analyze the 3D point cloud of single molecule localization microscopy (SMLM) super resolution microscopy data. The method consists of an integrated pipeline that can be used...


PUM


Abstract

A method of super-resolution microscopy is provided. The method includes mapping three-dimensional location of each single emission event in a plurality of single emission events from a series of optical images of a sample to create a point cloud. The point cloud is filtered or refined. Clusters within the point cloud are identified and characterized allowing for an assessment of molecular architecture.

Description

FIELD OF THE INVENTION[0001]This invention pertains to the field of super-resolution microscopy and in particular, to methods for analysis of single molecule localization microscopy to define molecular architecture.BACKGROUND OF THE INVENTION[0002]Understanding the structure of macromolecular complexes is critical to understanding the function of subcellular structures and organelles. Mutations in protein folding and trafficking resulting in defective macromolecular complexes and / or macromolecule location within subcellular structures and organelles have been observed in diseases including cystic fibrosis and inherited kidney diseases. Pharmacological chaperones are a promising therapeutic strategy for the treatment of a number of diseases including cystic fibrosis, Alzheimer's disease, inherited glaucoma amongst others.[0003]X ray crystallography and nuclear magnetic resonance spectroscopy report on protein structure at the atomic level; recent technical advances in cryoelectron mi...

Claims


Application Information

Patent Timeline
IPC IPC(8): G01N21/64G01N33/58G01N33/50G01N33/68
CPCG01N33/6803G01N21/6428G01N2201/12G01N21/6458G01N33/5005G01N2021/6439G01N33/582G01N15/10G06T2207/10028G06T2207/10061G01N2015/0038G06T7/30G02B27/58G02B21/367G06T3/4053G02B21/0076
Inventor KHATER, ISMAIL M.HAMARNEH, GHASSANNABI, IVAN ROBERTMENG, FANRUI
Owner SIMON FRASER UNIVERSITY
Learn More