
Apparatus and method and techniques for measuring and correlating characteristics of fruit with visible/near infra-red spectrum

a technology of infra-red spectrum and applicator, which is applied in the direction of optical radiation measurement, instruments, corona discharge, etc., can solve the problems of unsatisfactory signal-to-noise ratio, inability to gain additional information, and difficulty in gaining additional information, so as to improve brix prediction accuracy, short exposure time, and good signal-to-noise ratio

Inactive Publication Date: 2005-01-25
FPS FOOD PROCESSING SYST BV
View PDF4 Cites 111 Cited by
  • Summary
  • Abstract
  • Description
  • Claims
  • Application Information

AI Technical Summary

Benefits of technology

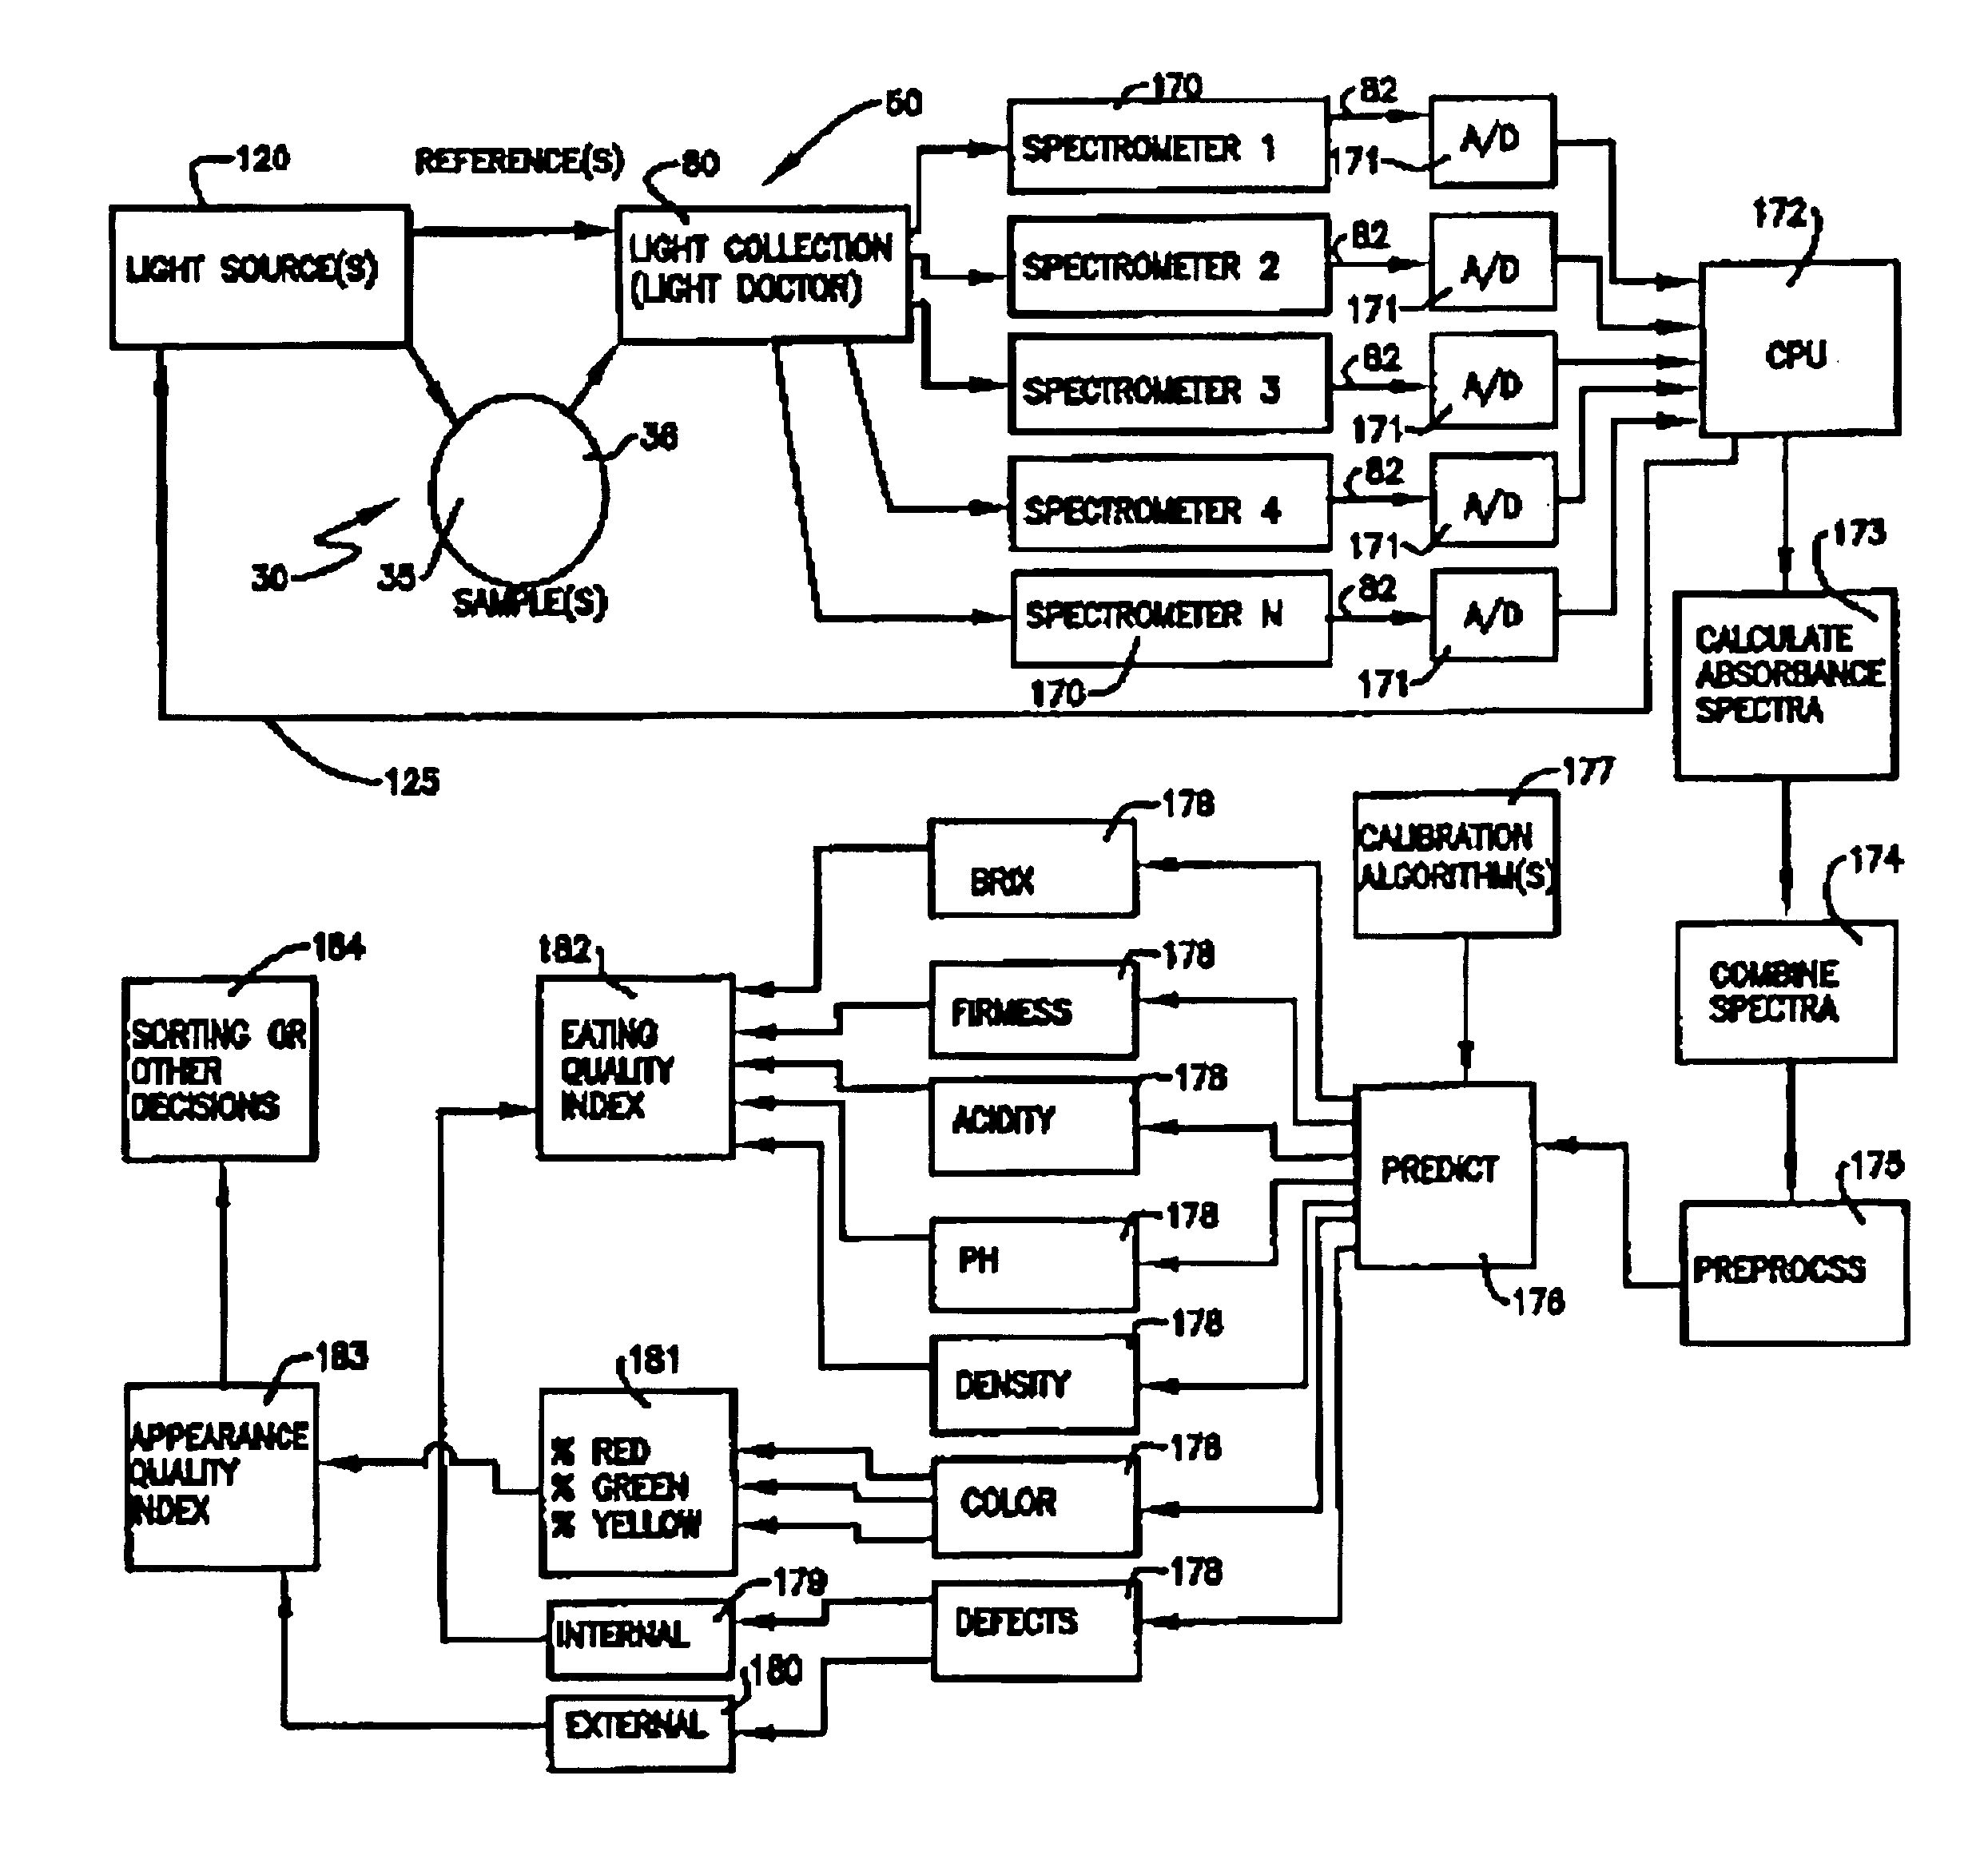
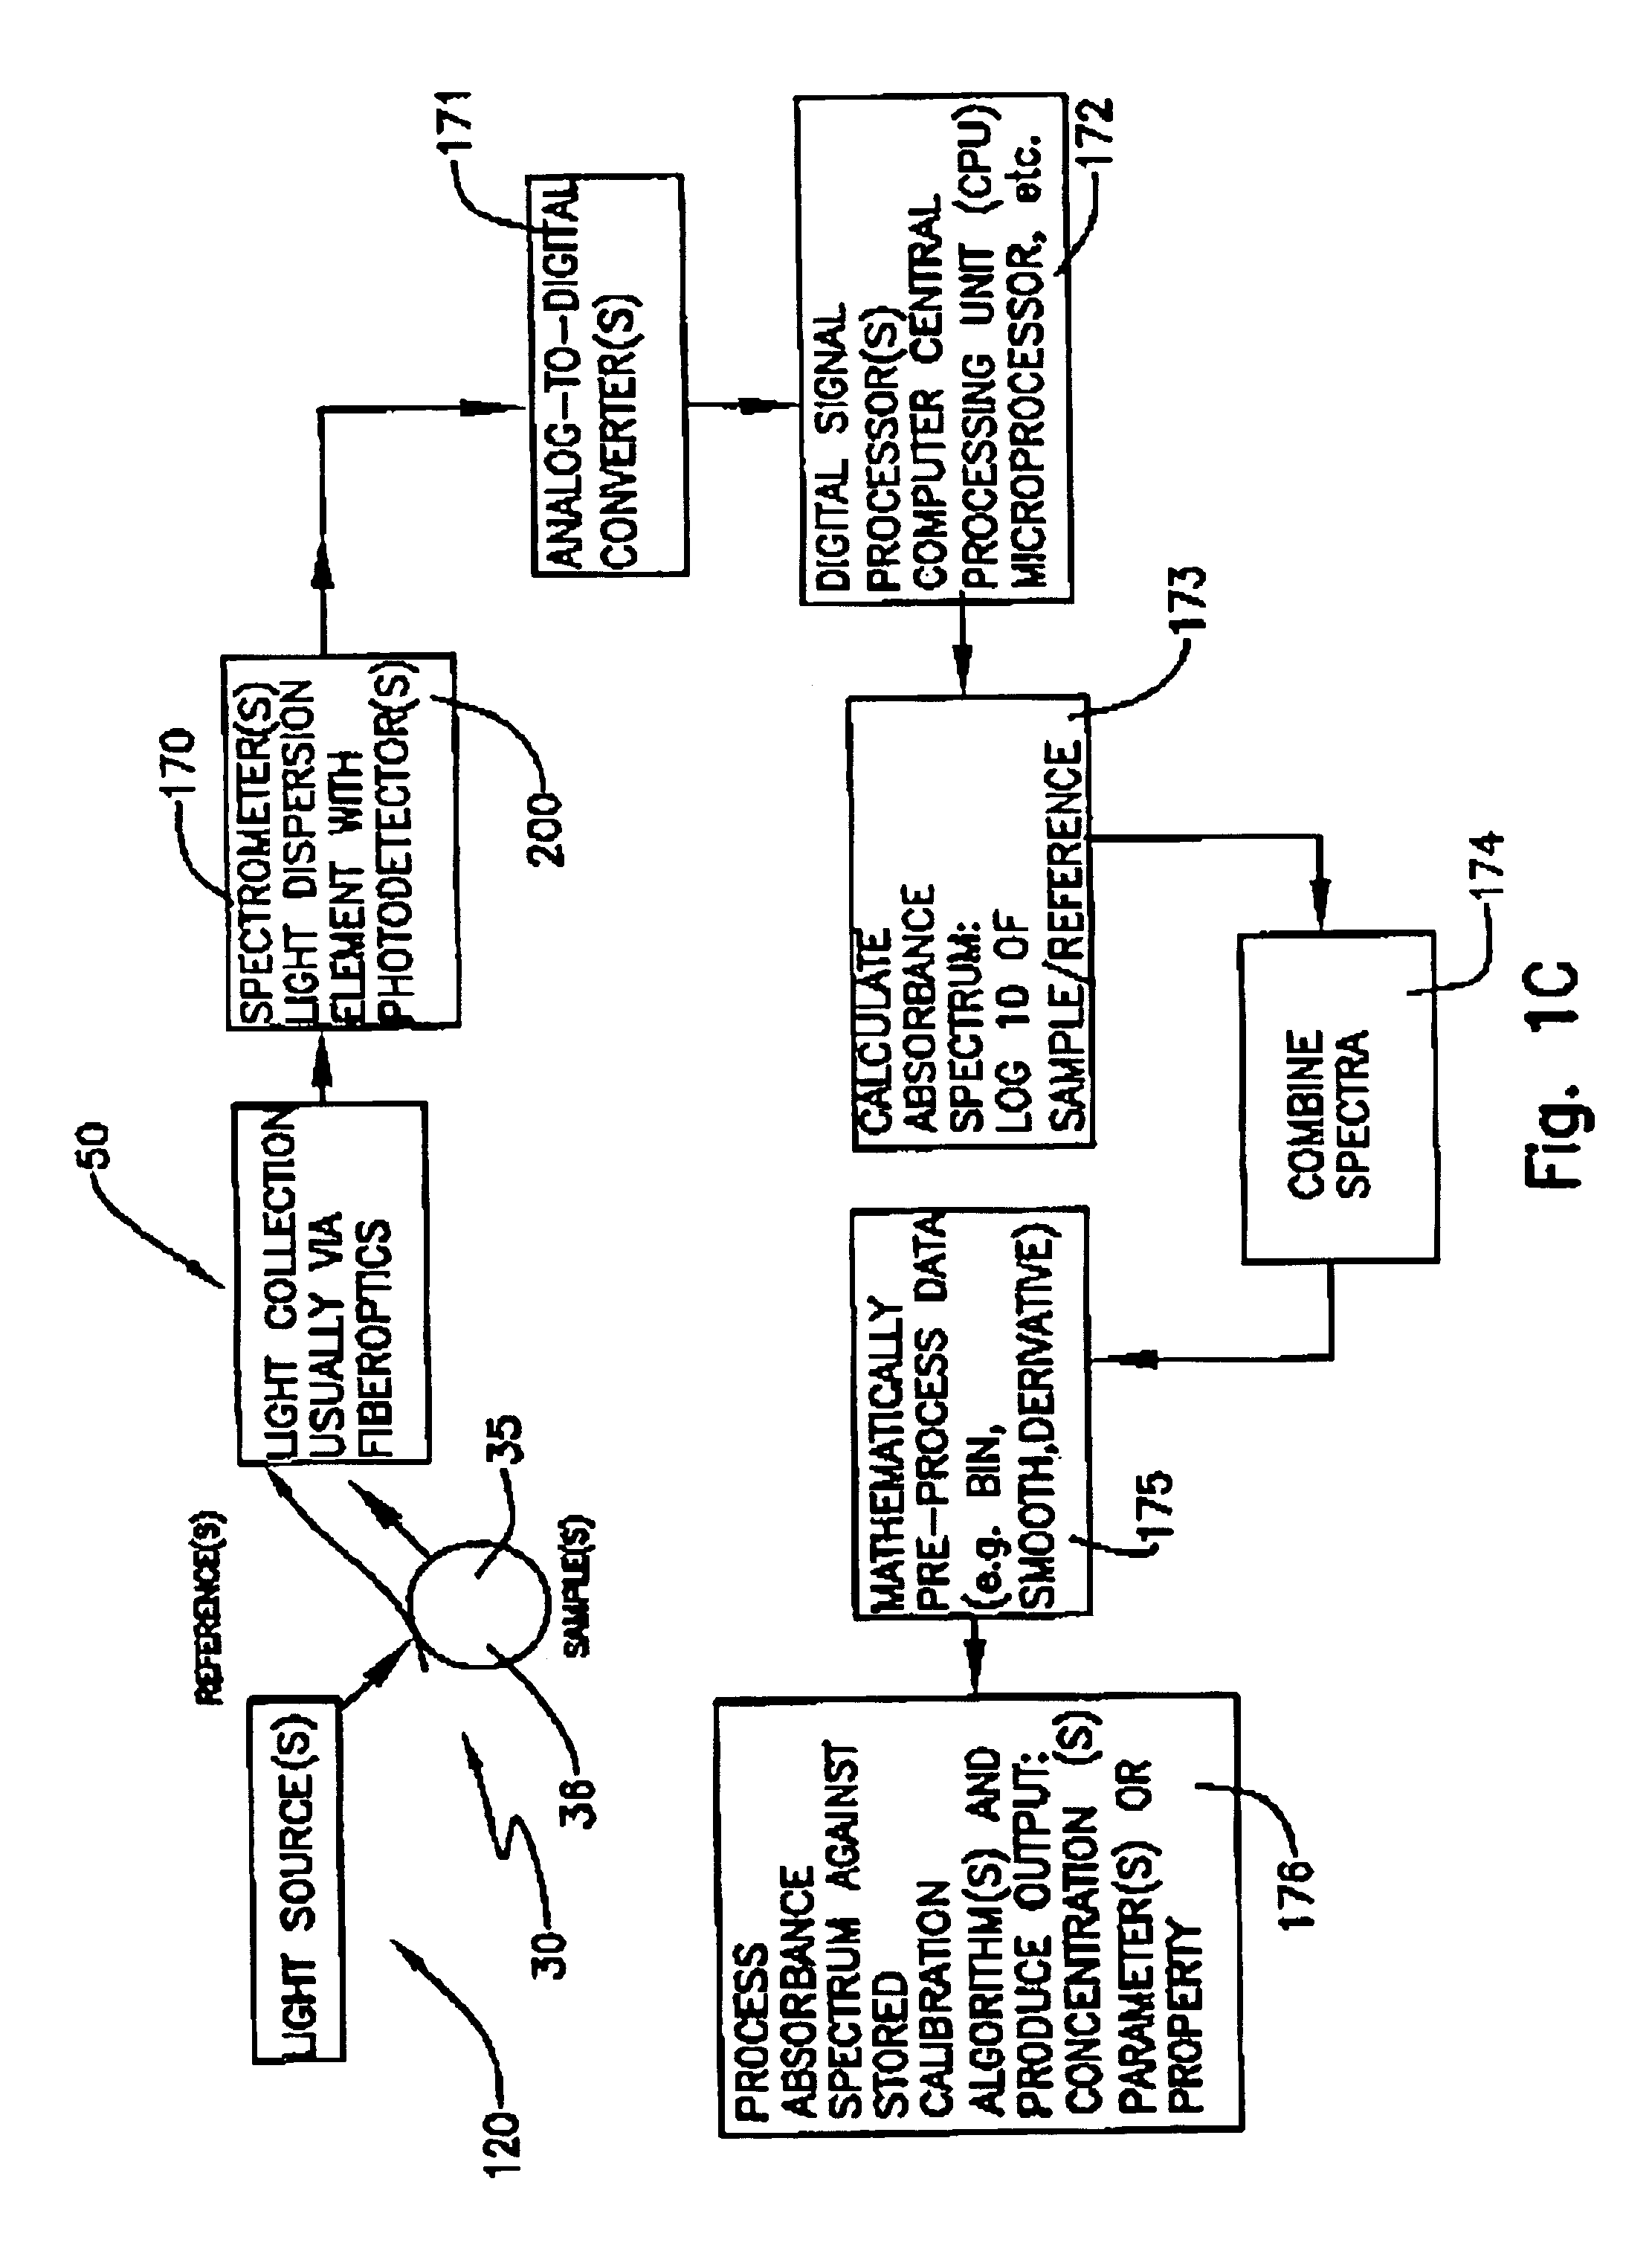
[0024]Prior art has only examined spectrum from fruit for the prediction of Brix. This disclosure is of the examination of a greater spectrum using the combined visible and near infrared wavelength regions for the prediction of the above stated characteristics. The apparatus and method disclosed eliminates the problem of saturation of light spectrum detectors within particular spectrum regions while gaining data within other regions in the examination, in particular, of fruit. That is, spectrometers with CCD (charge coupled device) array or PDA (photodiode array) detectors will detect light within the 250 to 1150 nm region, but when detecting spectrum out of fruit will saturate in regions, e.g., 700 to 925 nm, or the signal to noise (S / N) ratio will be unsatisfactory and not useful for quantitation in other regions, e.g., 250 to 699 nm and greater than 925 nm, thus precluding the gaining of additional information regarding the parameters above stated. Thus disclosed herein is an apparatus and method permitting 1) the automated measurement of multiple spectra with a single pass or single measurement activity by detecting more than one spectrum range during a single pass or single measurement activity, 2) combining the more than one spectrum range detected, 3) comparing the combined spectrum with a stored calibration algorithm to 4) predicting the parameters above stated.
[0025]In each instance in the method and apparatus disclosed herein there will be a dual or plural spectrum acquisition from a sample from different spectrum regions. This is accomplished by 1) serially acquiring data from different spectrum regions using different light source intensities or different detector / spectrometer exposure times using a single spectrometer; 2) acquiring data in parallel with multiple spectrometers using different light intensities, e.g., by varying the voltage input to a lamp, or different exposure times to the spectrometers; however, different exposure times leads to sampling errors particularly where a sample is moving, e.g., in a processing line, due to viewing different regions on a sample; and 3) with multiple spectrometers using the same exposure time, constant lamp intensity with dual or a plurality of light detectors including neutral density filtered light detectors (where filtered light detectors giving the same effect as using a shorter exposure time). This approach provides dual or plural spectra with good signal to noise ratio for all wavelengths intensities using a single light source intensity and the same exposure time on all spectrometer detectors. This approach uses at least one filtered light detector using filtered input 82 to the spectrometer 170 rather than different exposure times. A filter can be any material that absorbs light with equal strength over the range of wavelengths used by the spectrometer including but not limited to neutral density filters, Spectralon, Teflon, opal coated glass, screen. The dual intensity approach using two different lamp voltages proves problematic because the high and low intensity spectra are not easily combined together due to slope differences in the spectra. The dual exposure approach yields excellent combined spectra, which are necessary for firmness and other characteristic prediction and also improves Brix prediction accuracy.

Problems solved by technology

That is, spectrometers with CCD (charge coupled device) array or PDA (photodiode array) detectors will detect light within the 250 to 1150 nm region, but when detecting spectrum out of fruit will saturate in regions, e.g., 700 to 925 nm, or the signal to noise (S / N) ratio will be unsatisfactory and not useful for quantitation in other regions, e.g., 250 to 699 nm and greater than 925 nm, thus precluding the gaining of additional information regarding the parameters above stated.
The dual intensity approach using two different lamp voltages proves problematic because the high and low intensity spectra are not easily combined together due to slope differences in the spectra.

Method used


Image

  • Apparatus and method and techniques for measuring and correlating characteristics of fruit with visible/near infra-red spectrum
  • Apparatus and method and techniques for measuring and correlating characteristics of fruit with visible/near infra-red spectrum
  • Apparatus and method and techniques for measuring and correlating characteristics of fruit with visible/near infra-red spectrum

Examples


Embodiment Construction

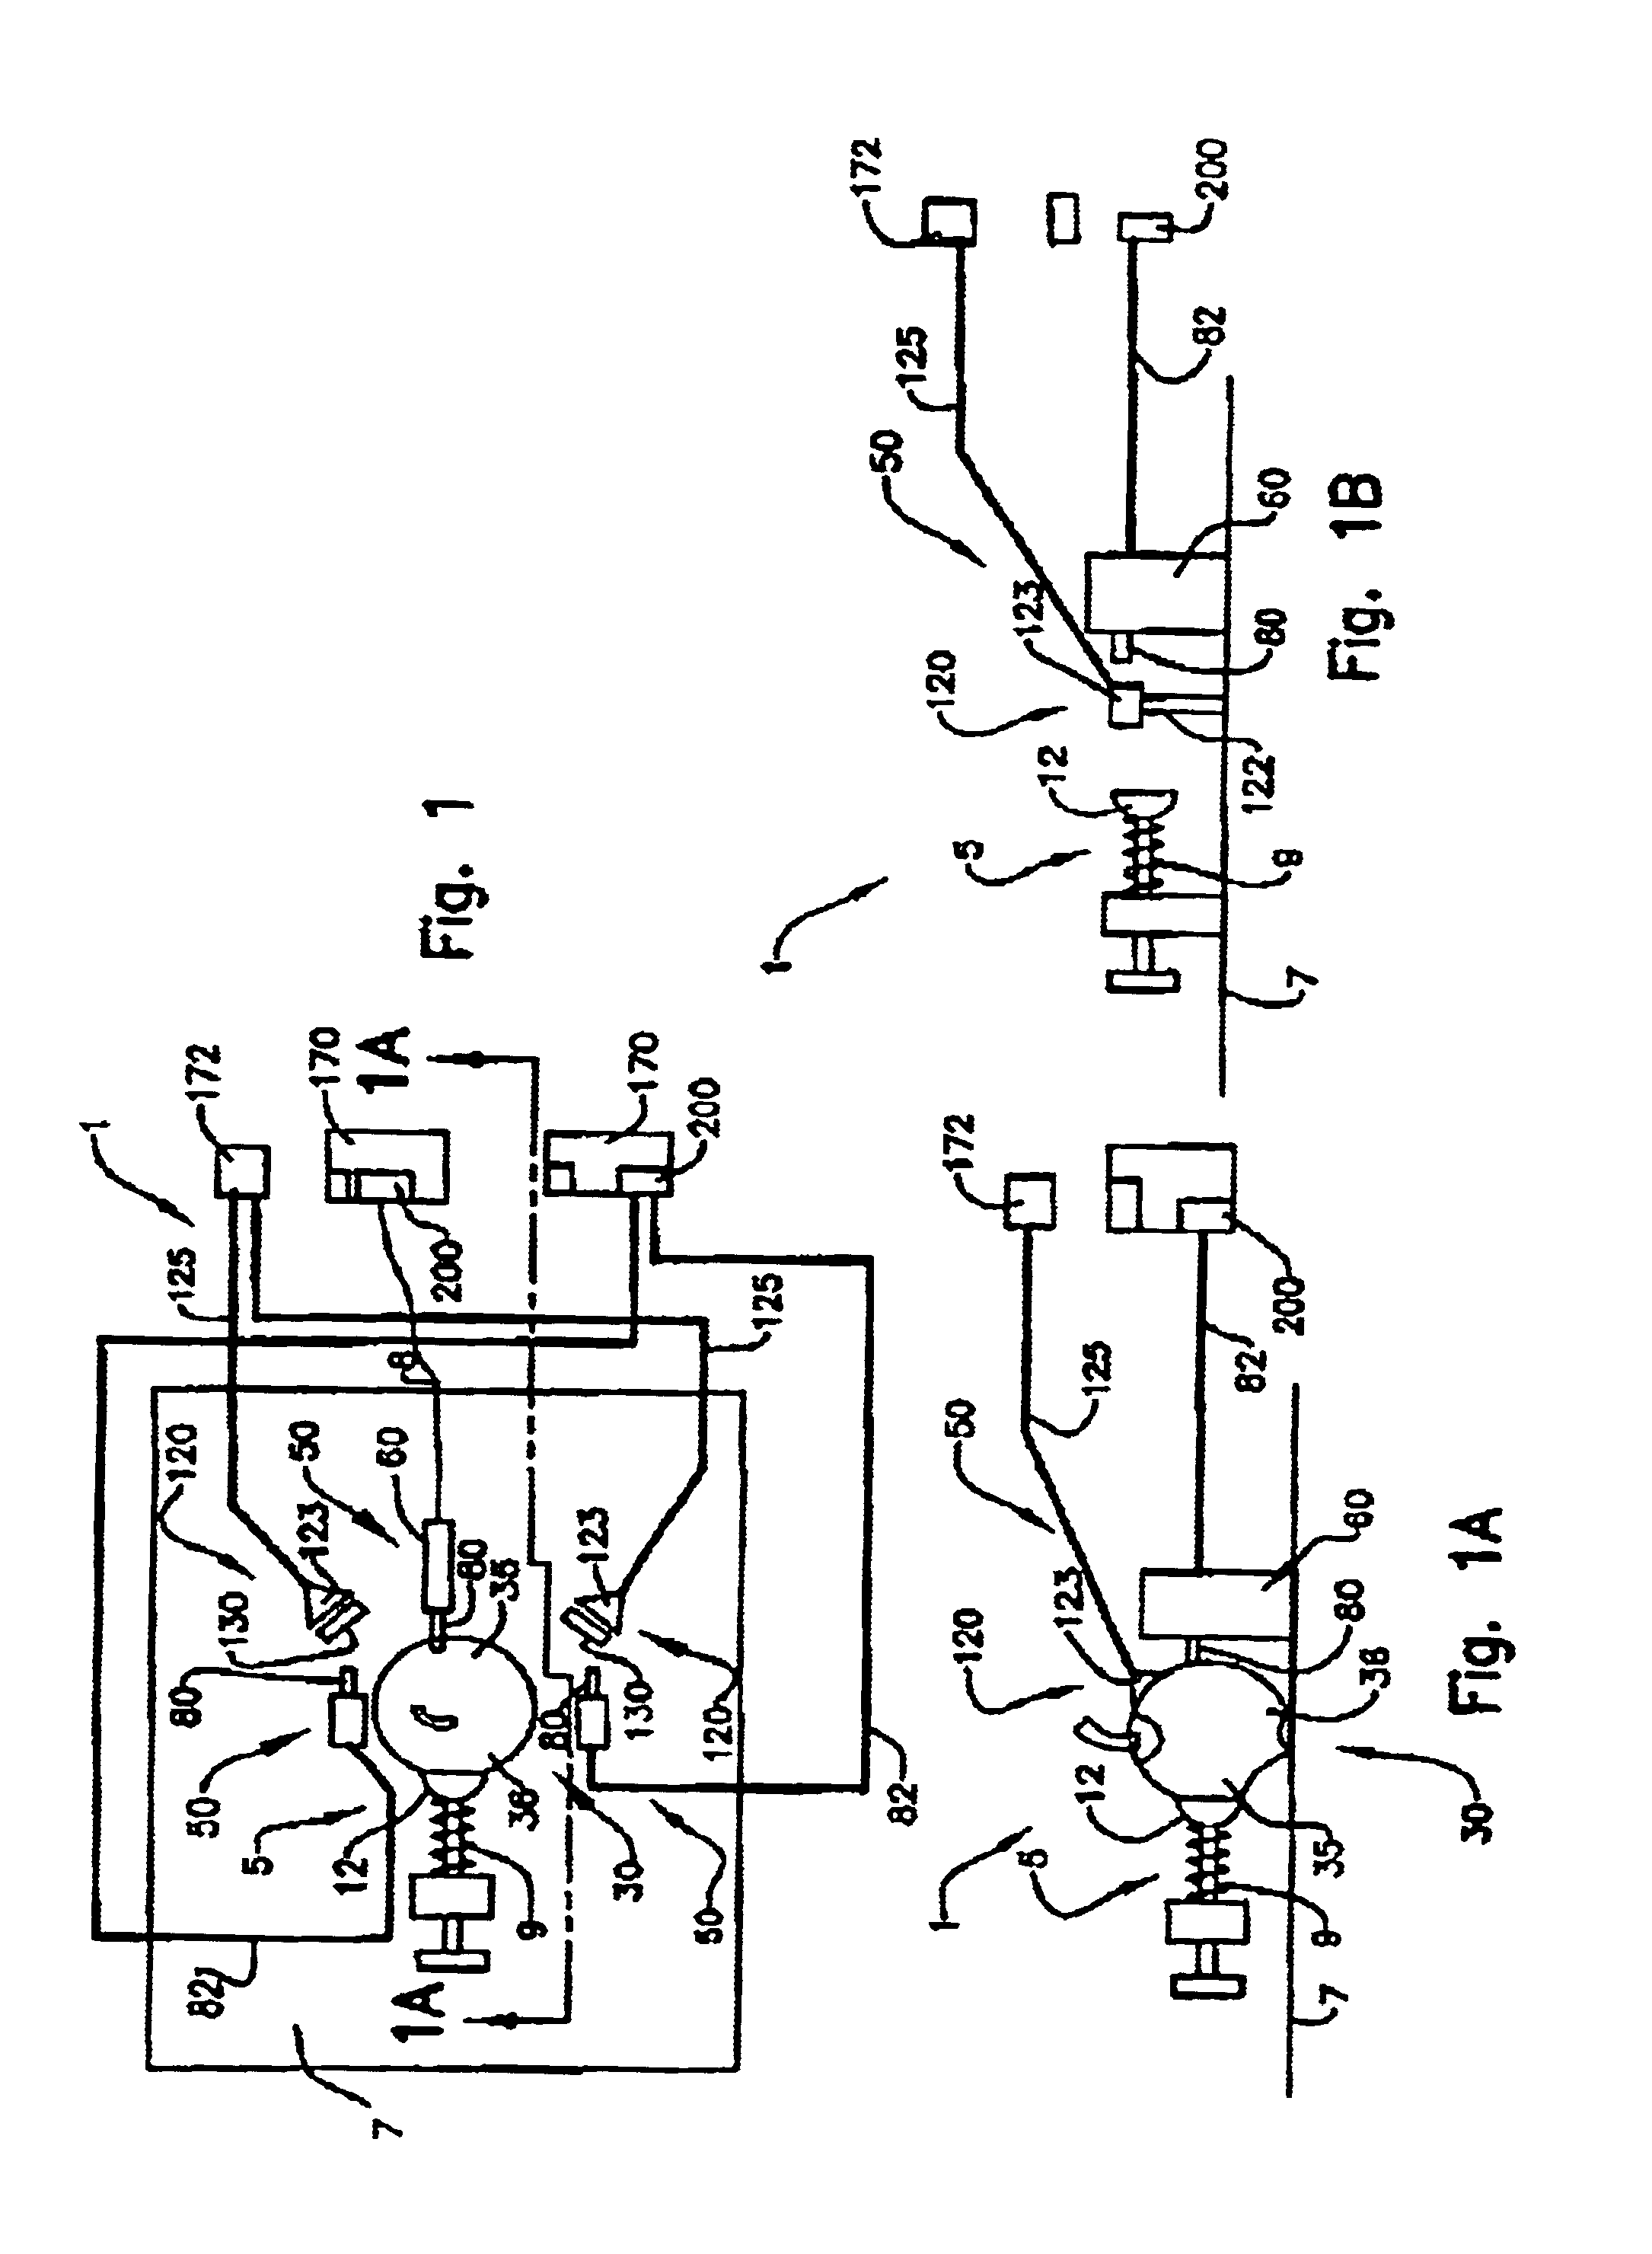
>[0072]FIG. 9 is an elevation depicting an additional embodiment of the invention demonstrating at least one light detector 80 having an output 82 to a spectrometer 170 having a detector 200.

[0073]FIG. 10 illustrates using spectroscopic sensors for measuring fruits and vegetables while in motion on a sample conveyor 295. Shown is a sample 30 with proximity sensing means 340. Demonstrated is the sample conveyor 295, a case 250, collimating lens 78.

[0074]FIG. 10A is a section from FIG. 10 illustrating the proximity sensing means 340 in the form of reflectance means.

[0075]FIG. 11 illustrates the manner of taking a reference measurement of the light source 120 lamp(s) 123 where intensity vs. wavelength output can also be obtained using reflecting means 360.

[0076]FIGS. 12 and 13 illustrate the mechanical insertion of reference means 430 in or near the location where actual sample 30 is normally measured. Insertion is by insertion means including but not limited to an actuator system 400....


PUM


Abstract

This disclosure is of 1) the utilization of the spectrum from 250 nm to 1150 nm for measurement of prediction of one or more parameters, e.g., brix, firmness, acidity, density, pH, color and external and internal defects and disorders including, for example, surface and subsurface braises, scarring, sun scald, punctures, in N—H, C—H and O—H samples including fruit; 2) an apparatus and method of detecting emitted light from samples exposed to the above spectrum in at least one spectrum range and, in the preferred embodiment, in at least two spectrum ranges of 250 to 499 nm and 500 nm; 3) the use of the chlorophyl band, peaking at 690 nm, in combination with the spectrum from 700 nm and above to predict one or more of the above parameters; 4) the use of the visible pigment region, including xanthophyll, from approximately 250 nm to 499 nm and anthocyanin from approximately 500 to 550 nm, in combination with the chlorophyl band and the spectrum from 700 nm and above to predict the all of the above parameters.

Description

CONTINUATION IN PART APPLICATION[0002]This is a Continuation In Part Application from the nonprovisional parent application Ser. No. 09 / 524,329 entitled AN APPARATUS AND METHOD FOR MEASURING AND CORRELATING CHARACTERISTICS OF FRUIT WITH VISIBLE / NEAR INFRA-RED SPECTRUM to Ozanich as filed Mar. 13, 2000, now U.S. Pat. No. 6,512,577. The applicant requests prosecution pursuant to 37 C.F.R. 1.53(b) and 1.78 and 35 U.S.C. 120. New matter herein is added, for examination convenience, commencing with page 56 which follows the last line of the Detailed Description of the original application and precedes the claims.FIELD OF THE INVENTION[0003]The present disclosure relates generally to the use of the combined visible and near infra red spectrum in an apparatus and method for measuring physical parameters, e.g., firmness, density and internal and external disorders, and chemical parameters, e.g., molecules containing O—H, N—H and C—H chemical bonds, in fruit and correlating the resulting mea...

Claims


Application Information

Patent Timeline
IPC IPC(8): G01N21/31G01N33/02G01N21/35G01J3/51G01J3/30G01J3/36G01J3/28G01J3/42G01J3/02G01J3/00
CPCG01J3/02G01J3/0224G01J3/28G01J3/36G01J3/42G01J3/51G01J3/513G01J3/524G01N21/3563G01N33/025G01J3/0218G01N2021/8466G01J3/501G01N21/359G01N2021/3155Y10S250/91G01N2201/129
Inventor OZANICH, RICHARD M.
Owner FPS FOOD PROCESSING SYST BV
Learn More