Methods to view and analyze the results from diffraction-based diagnostics

a diffraction-based diagnostic and image technology, applied in the field of detecting analytes in a medium, can solve the problems of complex visualization apparatus, high cost of these systems and devices, and inability to view any diffraction image, etc., to achieve quick and easy operation, enhance the effectiveness and/or usefulness of these devices, and improve the accuracy and/or simplicity

Inactive Publication Date: 2006-08-29
KIMBERLY-CLARK WORLDWIDE INC
View PDF232 Cites 69 Cited by
  • Summary
  • Abstract
  • Description
  • Claims
  • Application Information

AI Technical Summary

Benefits of technology

[0016]The present invention provides a system and method for viewing and / or analyzing the results from diffraction-based diagnostic systems that are quicker, more accurate and / or simpler to use than methods and systems requiring complex visualization devices. The present invention may be used with a variety of different diagnostic systems and methods to enhance the effectiveness and / or usefulness of these devices in detecting smaller analytes that may not have been detected using the diagnostic system alone.
[0020]Additionally, the present invention desirably provides a method of viewing and / or analyzing results from a diffraction-based diagnostic system that provides accurate results in a timely manner and reduces error.
[0022]Desirably, the present invention also provides a system of viewing and / or analyzing results from a diffraction-based diagnostic system using an analyzer that is able to store past results in memory, thereby permitting the user to recall the results of the more recent samples.

Problems solved by technology

Most of these systems and devices are relatively expensive and require a trained technician to perform the test.
Sandstrom et al., go on to indicate that slides formed from metal oxides on metal have certain drawbacks, and that the presence of metal ions can also be harmful in many biochemical applications.
One disadvantage is that a complex visualization apparatus is needed to view any diffraction image.
One disadvantage is the high cost of the device.
Another problem with the device is the difficulty in controlling the various layers that are placed on the wafer so that one obtains a reliable reading.
Therefore, one disadvantage of the method and system described by Bogdanski et al. is that a more complex apparatus is needed to detect changes in the diffraction pattern.
Another disadvantage is the more complex methods required to prepare the probe, which involve multiple steps with photoresist and / or etching steps conducted on a brittle, silicon dioxide surface; these methods are not amenable for a full-scale manufacturing process due to high scale capital costs.
Thus, this patent has similar disadvantages as the Bogdanski patent since it uses a method based on detecting changes in a diffraction pattern, rather than formation of one, due to binding.
This makes analysis more complex, since these changes are more subtle than a simple yes / no of a diffraction image being formed in the presence of an analyte.
Thus, as with the previous two patents, this patent also involves a more complex detection method since it must detect changes in a diffraction pattern, rather than simple formation of a pattern due to the analyte.
However, these systems lack the requisite sensitivity to test for many analytes, since a much larger number of latex beads must bind in the capture zone to be visible to the naked eye than that required to cause diffraction in the same size zone.

Method used


Image

  • Methods to view and analyze the results from diffraction-based diagnostics
  • Methods to view and analyze the results from diffraction-based diagnostics
  • Methods to view and analyze the results from diffraction-based diagnostics

Examples


examples 1 – 3

Examples 1–3

[0102]In Examples 1–3, an algorithm and method were determined for providing a yes / no answer through direct measurement(s) of the intensity of the diffracted beams.

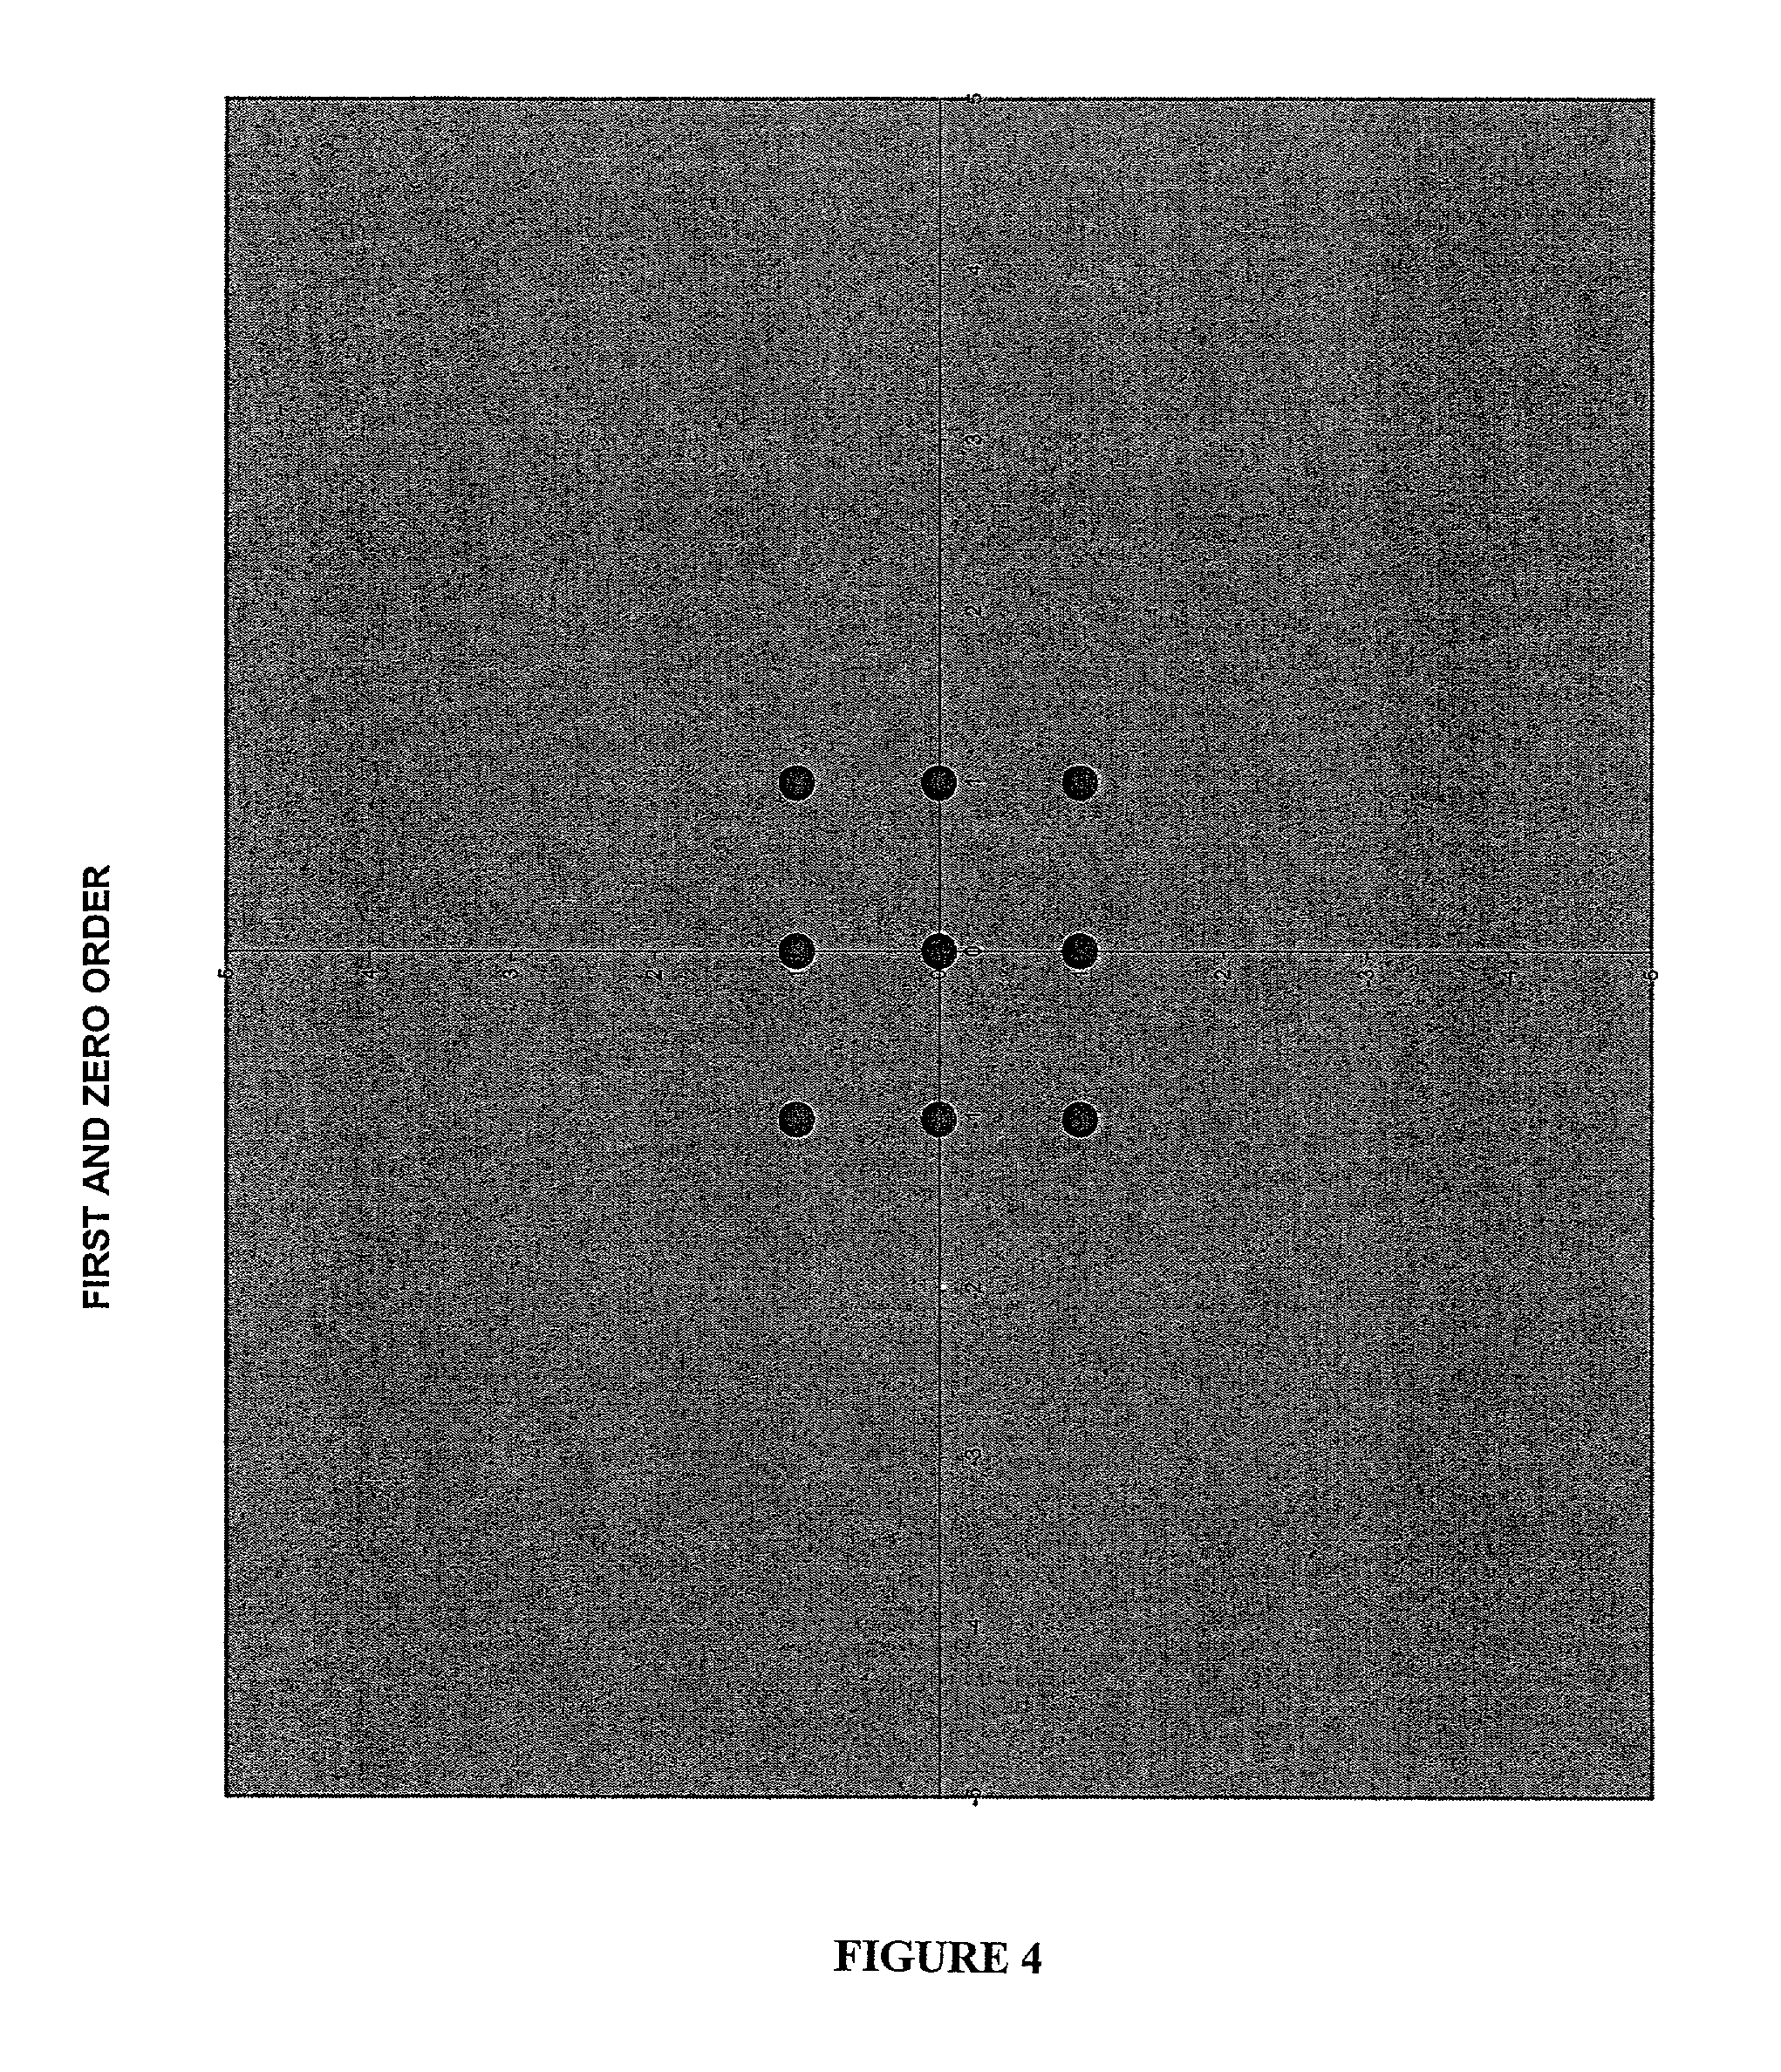
[0103]The experimental setup included the following: a laser beam as the light source, a diffraction-based sensing sample, a mask, a photodiode, and several lenses. When the sample fulfilled the necessary conditions for diffraction (e.g., analyte was present), the orders of diffracted light beams were transmitted through the mask in its 0° (unrotated) position and the intensity was measured using the photodiode. Then the mask was rotated to block the diffracted beams by the mask, so they did not get registered by the photodiode; in this way, diffused or scattered light was measured. Measuring the intensity of the light in both positions of the mask allowed the portion of the diffused light and scattered beams to be excluded by accounting for these values.

[0104]Various algorithms were evaluated for accuracy wit...

example 4

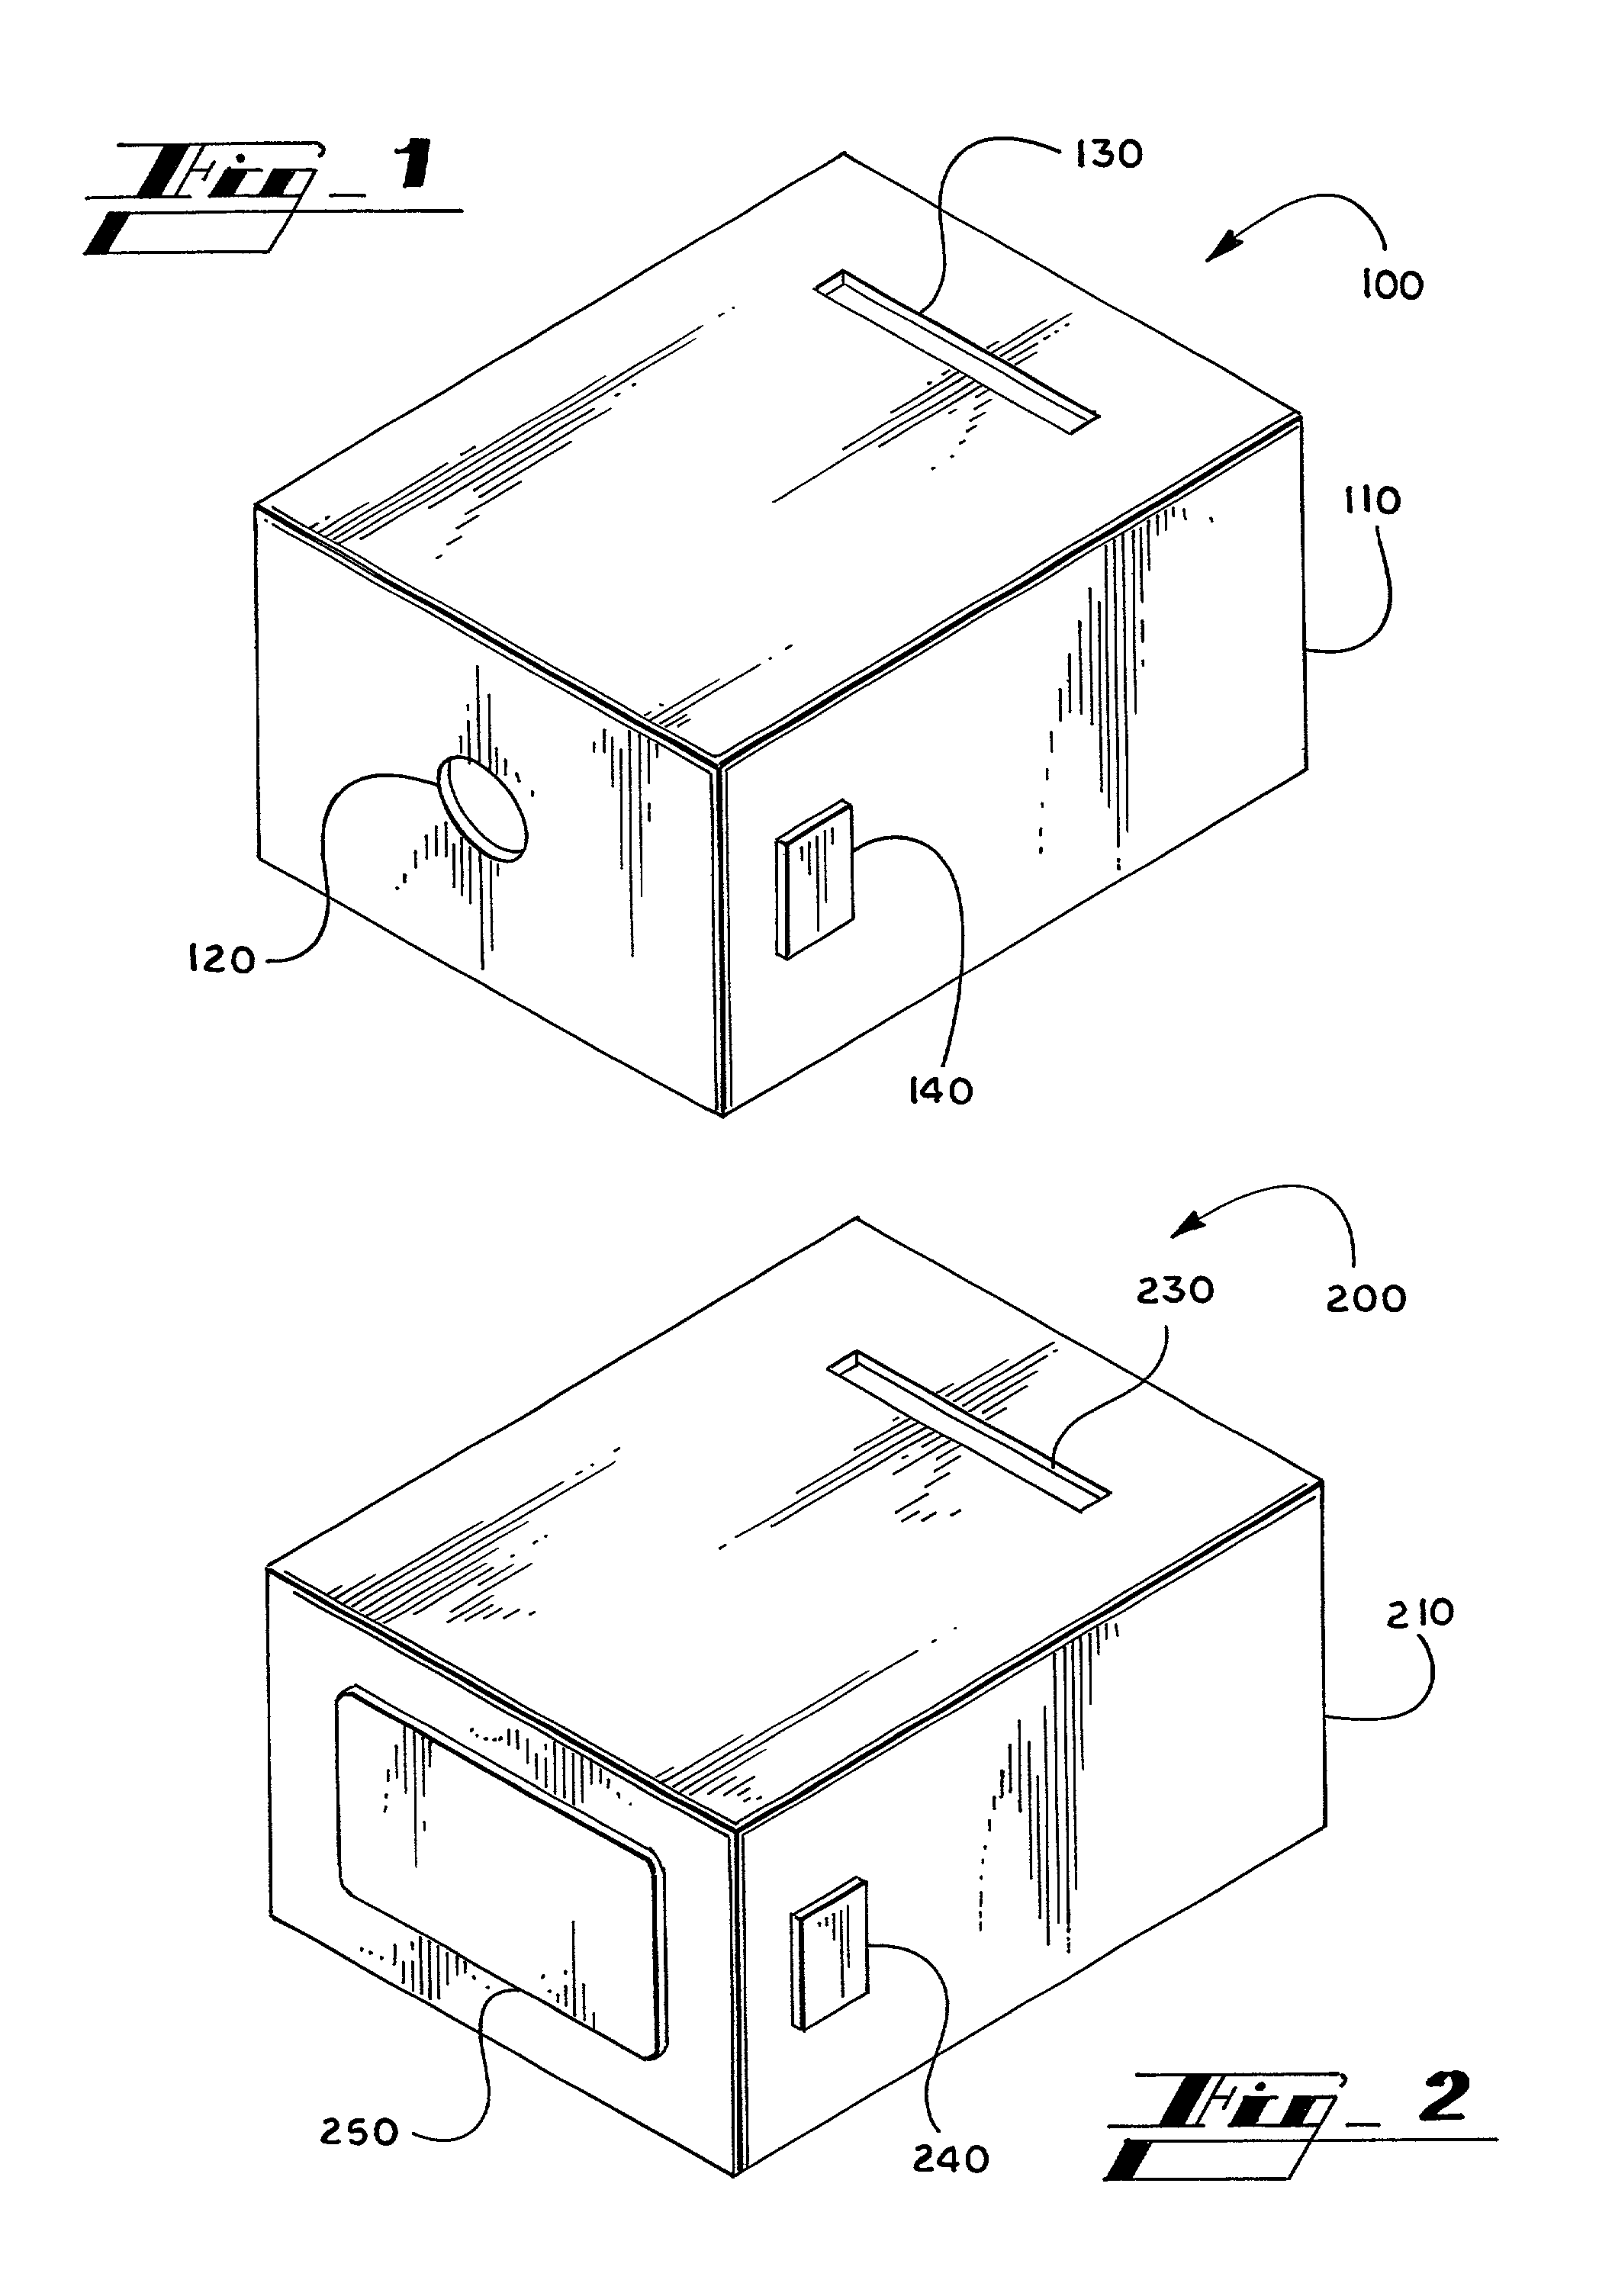
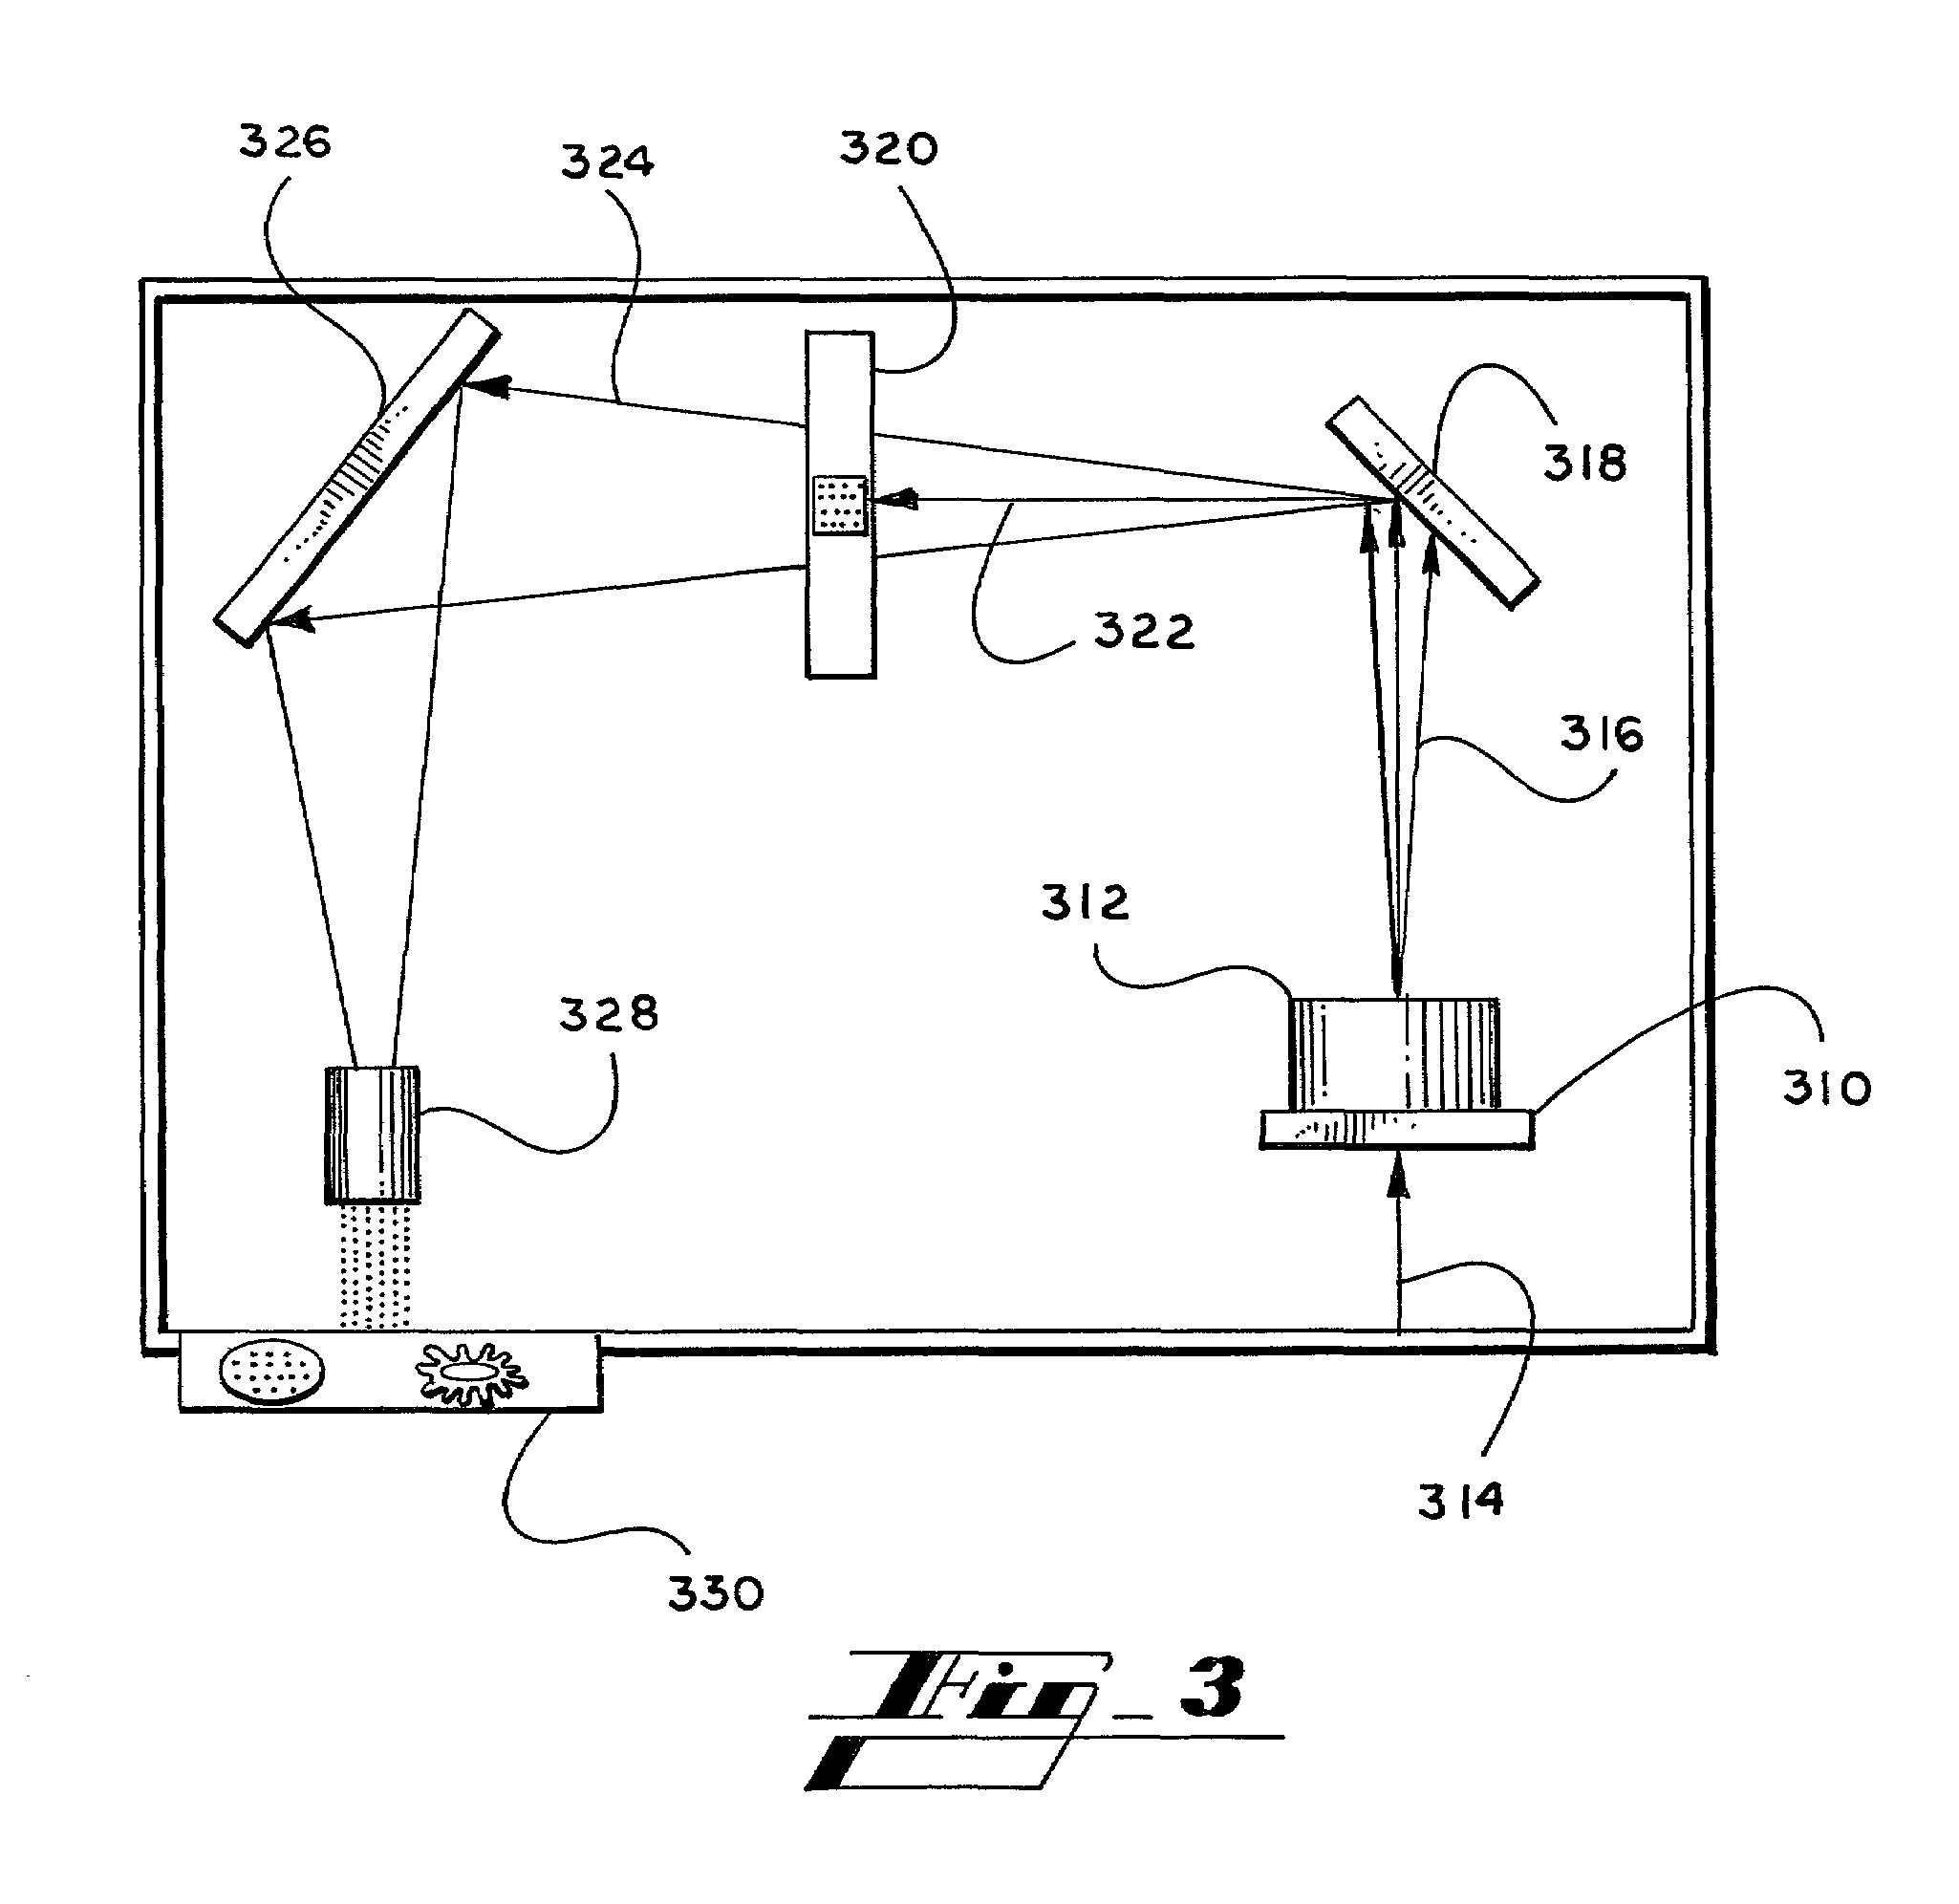
[0110]As shown in FIG. 3, a hand-held analyzer was prepared with the following components: a laser diode as the light source; a means to hold a diffraction-based sensing sample such that light is transmitted through it; a mask that blocked all light except for the 1st, 2nd, 3rd, and 4th diffraction orders; a photodiode; lenses and / or mirrors to direct the light; a microprocessor with memory capability; set of lights to indicate results; and LCD. All of these components were contained within a small, hand-held housing.

[0111]As soon as the analyzer is turned on, the LCD prompts the user for the necessary steps, such as “Insert Sample” then “Hit Test Button”. If a diffracting sample was inserted into the sample holder, then the diffracted light intensity was collected by the photodiode, and a microprocessor converted the result as a “positive”.

[0112]The microprocessor was programmed with the following algorithm:

A=Channel 1 reading / Channel 2 reading

wherein channel 1 measured the intensi...


PUM

PropertyMeasurementUnit
optical transparencyaaaaaaaaaa
thicknessaaaaaaaaaa
thicknessaaaaaaaaaa

Abstract

An analyzer useful in determining the presence of an analyte using a diffraction based sensing device and methods and systems using this device. The present invention may be used with a variety of different diffraction-based diagnostic methods and systems. The analyzer enhances the accuracy and / or usefulness of these devices in detecting analytes, while providing more ease-of-use and convenience to the user. The analyzer may include a light source, a photodiode, a microprocessor and a display system for informing the user of the result. Other features include mirrors, lenses, a sample holder, and a mask for blocking out some light. The analyzer and related method and system may be used in a large number of environments, including commercial, professional, and individual.

Description

FIELD OF THE INVENTION[0001]The present invention is generally in the field of detecting analytes in a medium and, more particularly, the present invention relates to the methods of viewing and / or analyzing diffraction-based diagnostic devices that are capable of indicating the presence of the analyte in a medium.BACKGROUND OF THE INVENTION[0002]There are many systems and devices available for detecting a wide variety of analytes in various media. Most of these systems and devices are relatively expensive and require a trained technician to perform the test. There are many cases where it would be advantageous to be able to rapidly and inexpensively determine if an analyte were present. What is needed is a system that is easy and inexpensive to manufacture and is capable of reliable and sensitive detection of analytes.[0003]Sandstrom et al., 24 Applied Optics 472, 1985, describe use of an optical substrate of silicon with a layer of silicon monoxide and a layer of silicon formed as d...

Claims


Application Information

Patent Timeline
Patent Type & Authority Patents(United States)
IPC IPC(8): G01N33/543G01N21/41G01N21/47G01N33/02G01N33/493
CPCB82Y15/00B82Y30/00G01N21/4788G01N33/54373Y10S436/805G01N33/493Y10S435/808G01N33/02G01N21/47G01N33/543
Inventor KAYLOR, ROSANN MARIEYANG, DIFEIATANASSOV, ZDRAVKO SAVOVKNOTTS, MICHAEL EUGENE
Owner KIMBERLY-CLARK WORLDWIDE INC
Why Eureka
Try Eureka