Spatiotemporal and geometric optimization of sensor arrays for detecting analytes fluids
- Summary
- Abstract
- Description
- Claims
- Application Information
AI Technical Summary
Benefits of technology
Problems solved by technology
Method used
Image
Examples
example 1
Spectral Noise Measurements
[0144]For measurements of the noise properties of the detector films, glass microscope slides were coated with a 50 nm thick layer of Au on top of a 15–30 nm thick layer of Cr, in a pattern that produced rectangular gaps between two parallel metal contact regions. The ratio of the rectangular edge length to the gap length was 8:1, and this aspect ratio was held constant as the area of the gap was varied. After film deposition, this procedure resulted in detector films of similar resistance values that had systematically varying film volumes. Carbon black composite films containing either PEVA or PCL, and having areas of 0.080, 0.30, 1.2, 1.3, 5.0, 33.0, and 132 mm2, with resistance values ranging from 70 to 160 kΩ, were then deposited onto these substrates. The resulting detector film thicknesses, which were between 180 and 300 nm for the PEVA films and between 60 and 120 nm for the PCL films, were measured with a Sloan Dektak model 3030 profilometer.
[0145...
example 2
Determination of Polymer / Gas Partition Coefficients
[0151]Quartz crystal microbalance (QCM) measurements were performed on pure films of both PEVA and PCL at 294 K using 10 MHz resonant frequency quartz crystals and a measurement apparatus as described in Severin, et al., Anal. Chem. 2000, 72, 2008–2015. Twenty vapor presentations, each 120 s in duration and separated in time by 15 min, were performed at each of 4 concentrations (P / Po=0.010, 0.030, 0.050, 0.10) of n-hexane and of methanol. The order of vapor presentation was randomized with respect to analyte identity, analyte concentration, and repetition of conditions. The frequency shifts of the polymer-coated QCM crystals arising from deposition of the polymer film, Δfpolymer, were recorded as the difference in the resonant frequency of the crystal before and after deposition of the polymer film. The frequency change upon exposure toe analyte vapor, Δfanalyte, was calculated as the difference in the resonant frequency of the film...
example 3
Vapor Response of Linear Arrays of Chemically Equivalent, Spatially Nonequivalent Detectors
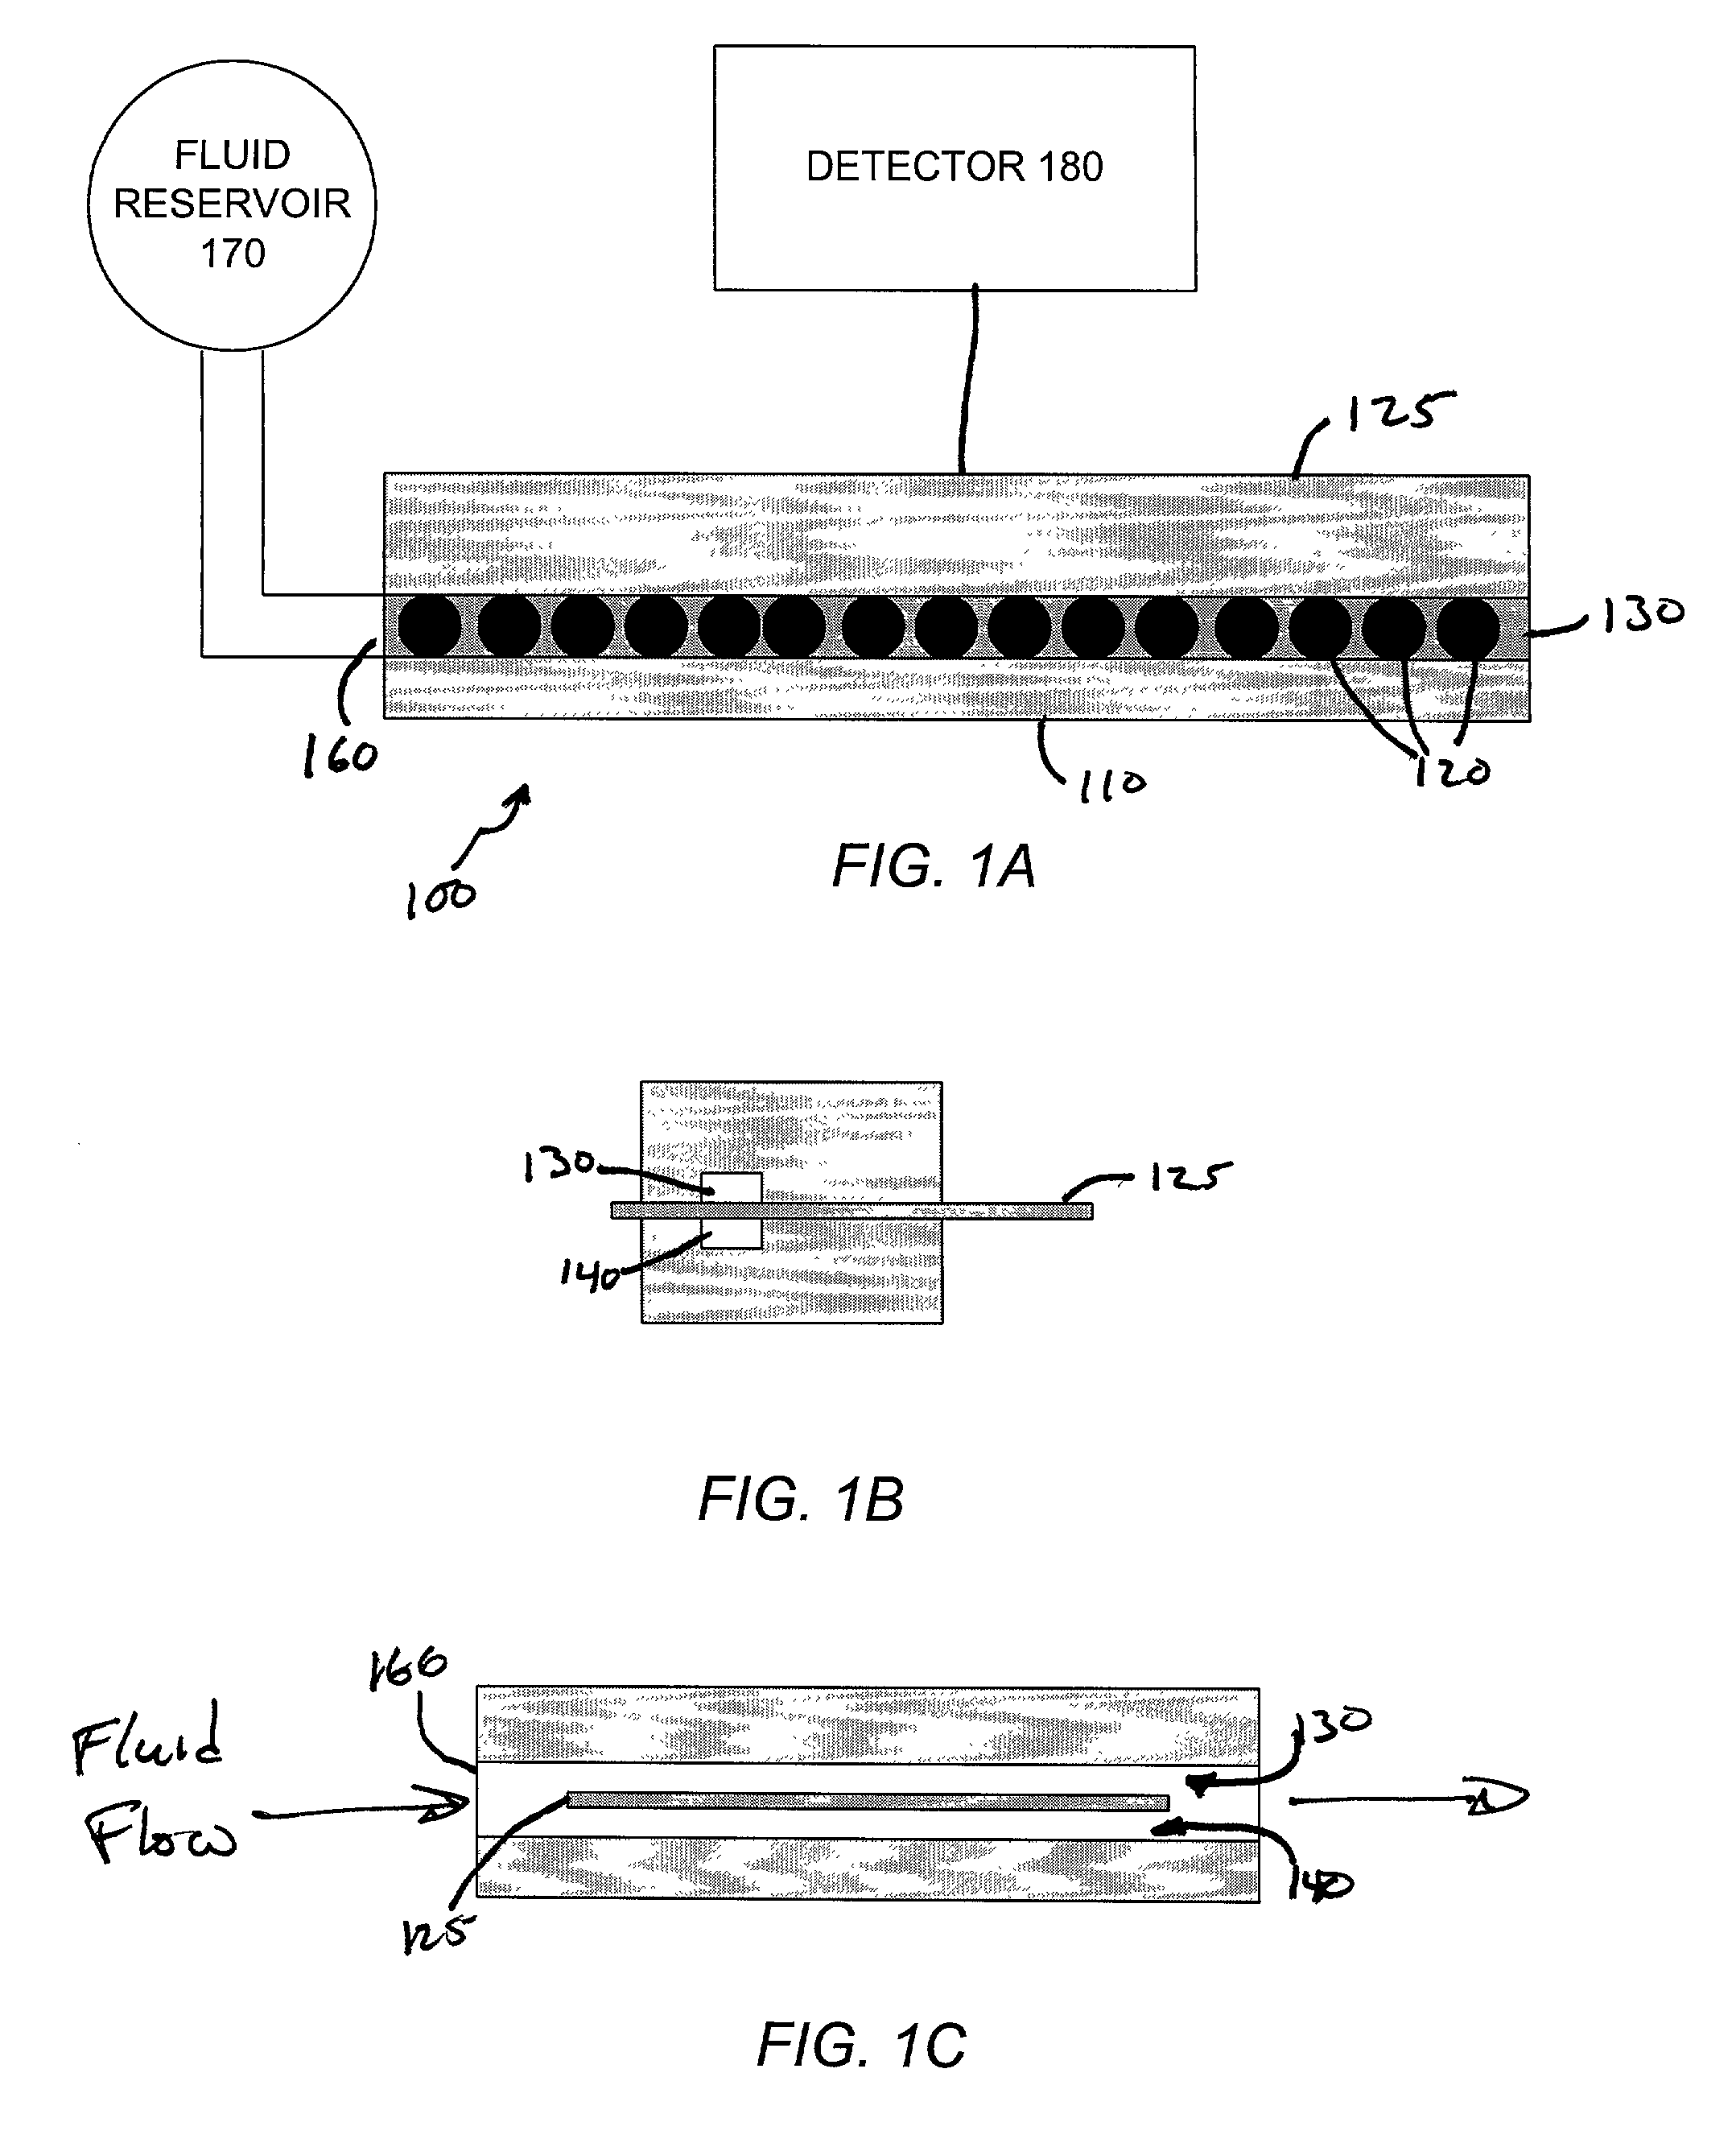
[0156]To investigate the spatiotemporal and geometric aspects of the chemiresistive vapor detectors, a linear array of detectors having a defined headspace and analyte flow configuration was constructed similar to the design illustrated in FIGS. 1A, 1B and 1C. A series of parallel Cr / Au contacts was formed on each side of 75 mm×25 mm glass slides. These contact electrodes were 1.8 mm long and were separated by a gap of 0.4 mm. Each pair of electrodes, which defined the contacts for an individual detector, was spaced 5 mm apart, permitting formation of 15 individual detectors on each side of the glass slide. The area surrounding the electrodes was coated with a thin layer of Teflon.
[0157]Both sides of the substrate were masked, with the exception of a 5 mm by 75 mm rectangular region on each side of the substrate that was centered on the row of electrical contacts used to form the detectors. Th...
PUM
| Property | Measurement | Unit |
|---|---|---|
| Time | aaaaa | aaaaa |
| Fraction | aaaaa | aaaaa |
| Fraction | aaaaa | aaaaa |
Abstract
Description
Claims
Application Information
 - R&D
- Intellectual Property
- Life Sciences
- Materials
- Tech Scout
- Unparalleled Data Quality
- Higher Quality Content
- 60% Fewer Hallucinations
Browse by: Latest US Patents, China's latest patents, Technical Efficacy Thesaurus, Application Domain, Technology Topic, Popular Technical Reports.
© 2025 PatSnap. All rights reserved.Legal|Privacy policy|Modern Slavery Act Transparency Statement|Sitemap|About US| Contact US: help@patsnap.com


