Method of biomedical signal analysis including improved automatic segmentation

a biomedical signal and automatic segmentation technology, applied in the field of biomedical signal analysis, can solve the problems of time-consuming and expensive expert analysis, complex and highly variable signals, and difficult automated analysis

Inactive Publication Date: 2012-12-11
OBS MEDICAL
View PDF10 Cites 50 Cited by
  • Summary
  • Abstract
  • Description
  • Claims
  • Application Information

AI Technical Summary

Benefits of technology

[0076]FIG. 4 illustrates an example of the detection of the QT interval on a noisy ECG signal. Despite the high noise content and base line shifts in the ECG, the Q onset locations occur at regular intervals indicating that the correct locations have been found. This is an advantage of the present invention because beats can be correctly identified on the basis of the R peak which can be robustly detected, and the Hidden Markov Models are only applied to limited subsections of the ECG meaning that they are unaffected by noise outside those sections. This allows the present invention to segment heart beats with greater confidence than other techniques.
[0077]FIG. 5 illustrates a graphical example of QT interval lengthening for a volunteer in a clinical trial of a pharmacological substance. FIGS. 5a and b illustrate respectively the corrected QT interval and heart rate values for each two minute intervals of lead II for a volunteer on protocol one of a clinical trial of a drug. Values for baseline day (no drug or placebo) are plotted in blue and drug or placebo day are plotted in red. FIGS. 5c and d show corresponding values for the same patient on protocol 2 of the clinical trial. FIGS. 5e and f show protocol 1 results from lead V2 of the ECG of the same patient and FIGS. 5g and h values for ECG lead V2 for protocol 2. It can be seen that for protocol 1 on both leads the red, corrected QT interval values for drug or placebo day are systematically greater than the corrected QT interval values for baseline day. This effect is not visible in protocol 2. The results for protocol 1 give mean delta QTc values of 7.58 ms and 6.27 ms for leads 11 and V2 respectively. The results for protocol 2 show mean delta QTc values of −2.58 ms and 1.12 ms for leads 11 and V2 respectively. Thus these plots successfully detect the administration of the drug lengthening QT interval on drug / placebo day of protocol 1 in this clinical trial.Beat Matching
[0078]In the specific example above the median corrected QT intervals derived from step S (optionally filtered in step 5a) are used to calculate and plot an average corrected QT interval for each successive two minute section of the data. However, the activities of the subject (patient or volunteer) and indeed the start time of the recordings, varies from day-to-day. To allow for this variability the current practice for comparing ECG data from day-to-day is to look at specific time windows at the same time of day on each of the days being compared. For example ten minute windows of data may be inspected at a defined start time each day and at 30 minutes, 60 minutes, 90 minutes, etc. thereafter. In the case of a clinical trial the start point may be the time of administration of a drug or control, or a set time before administration, and the spacing between the time windows may increase through the day. Because of the variability and noisy nature of the data, however, such comparisons may be inaccurate.
[0079]To alleviate this problem, in one embodiment of the present invention time windows (e.g. of a few minutes) are defined spanning each standard time point during the day and within these windows pairs of matching beats are found. This is illustrated in FIG. 8. Thus the corrected QT intervals will be compared of two beats which match as closely as possible in some other aspect. The two beats may not occur at precisely the same time of day, but will be within the same time window. Two possible ways of finding the matching beats are:
[0080](1) Consider all the high confidence beats from the corresponding time segment (for

Problems solved by technology

Such expert analysis is, however, time consuming and expensive.
Such signals are often noisy, complex and highly variable in time and from individual to individual.
Automated analysis is therefore difficult, and the large amount of data which can be generated by signal recordings from even one individual over an extended period can make it impractical to analyse all of the data even using computers with fast processors.
This hugely increases the amount of ECG data.
This makes existing methods of expert analysis, and indeed many methods of automated analysis, impractical.
An additional problem which occurs in analysis of ECGs is that the QT interval varies with heart rate.
This correction is not, however, particularly accurate.
Again, though, this is not particularly accurate.

Method used


Image

  • Method of biomedical signal analysis including improved automatic segmentation
  • Method of biomedical signal analysis including improved automatic segmentation
  • Method of biomedical signal analysis including improved automatic segmentation

Examples


Embodiment Construction

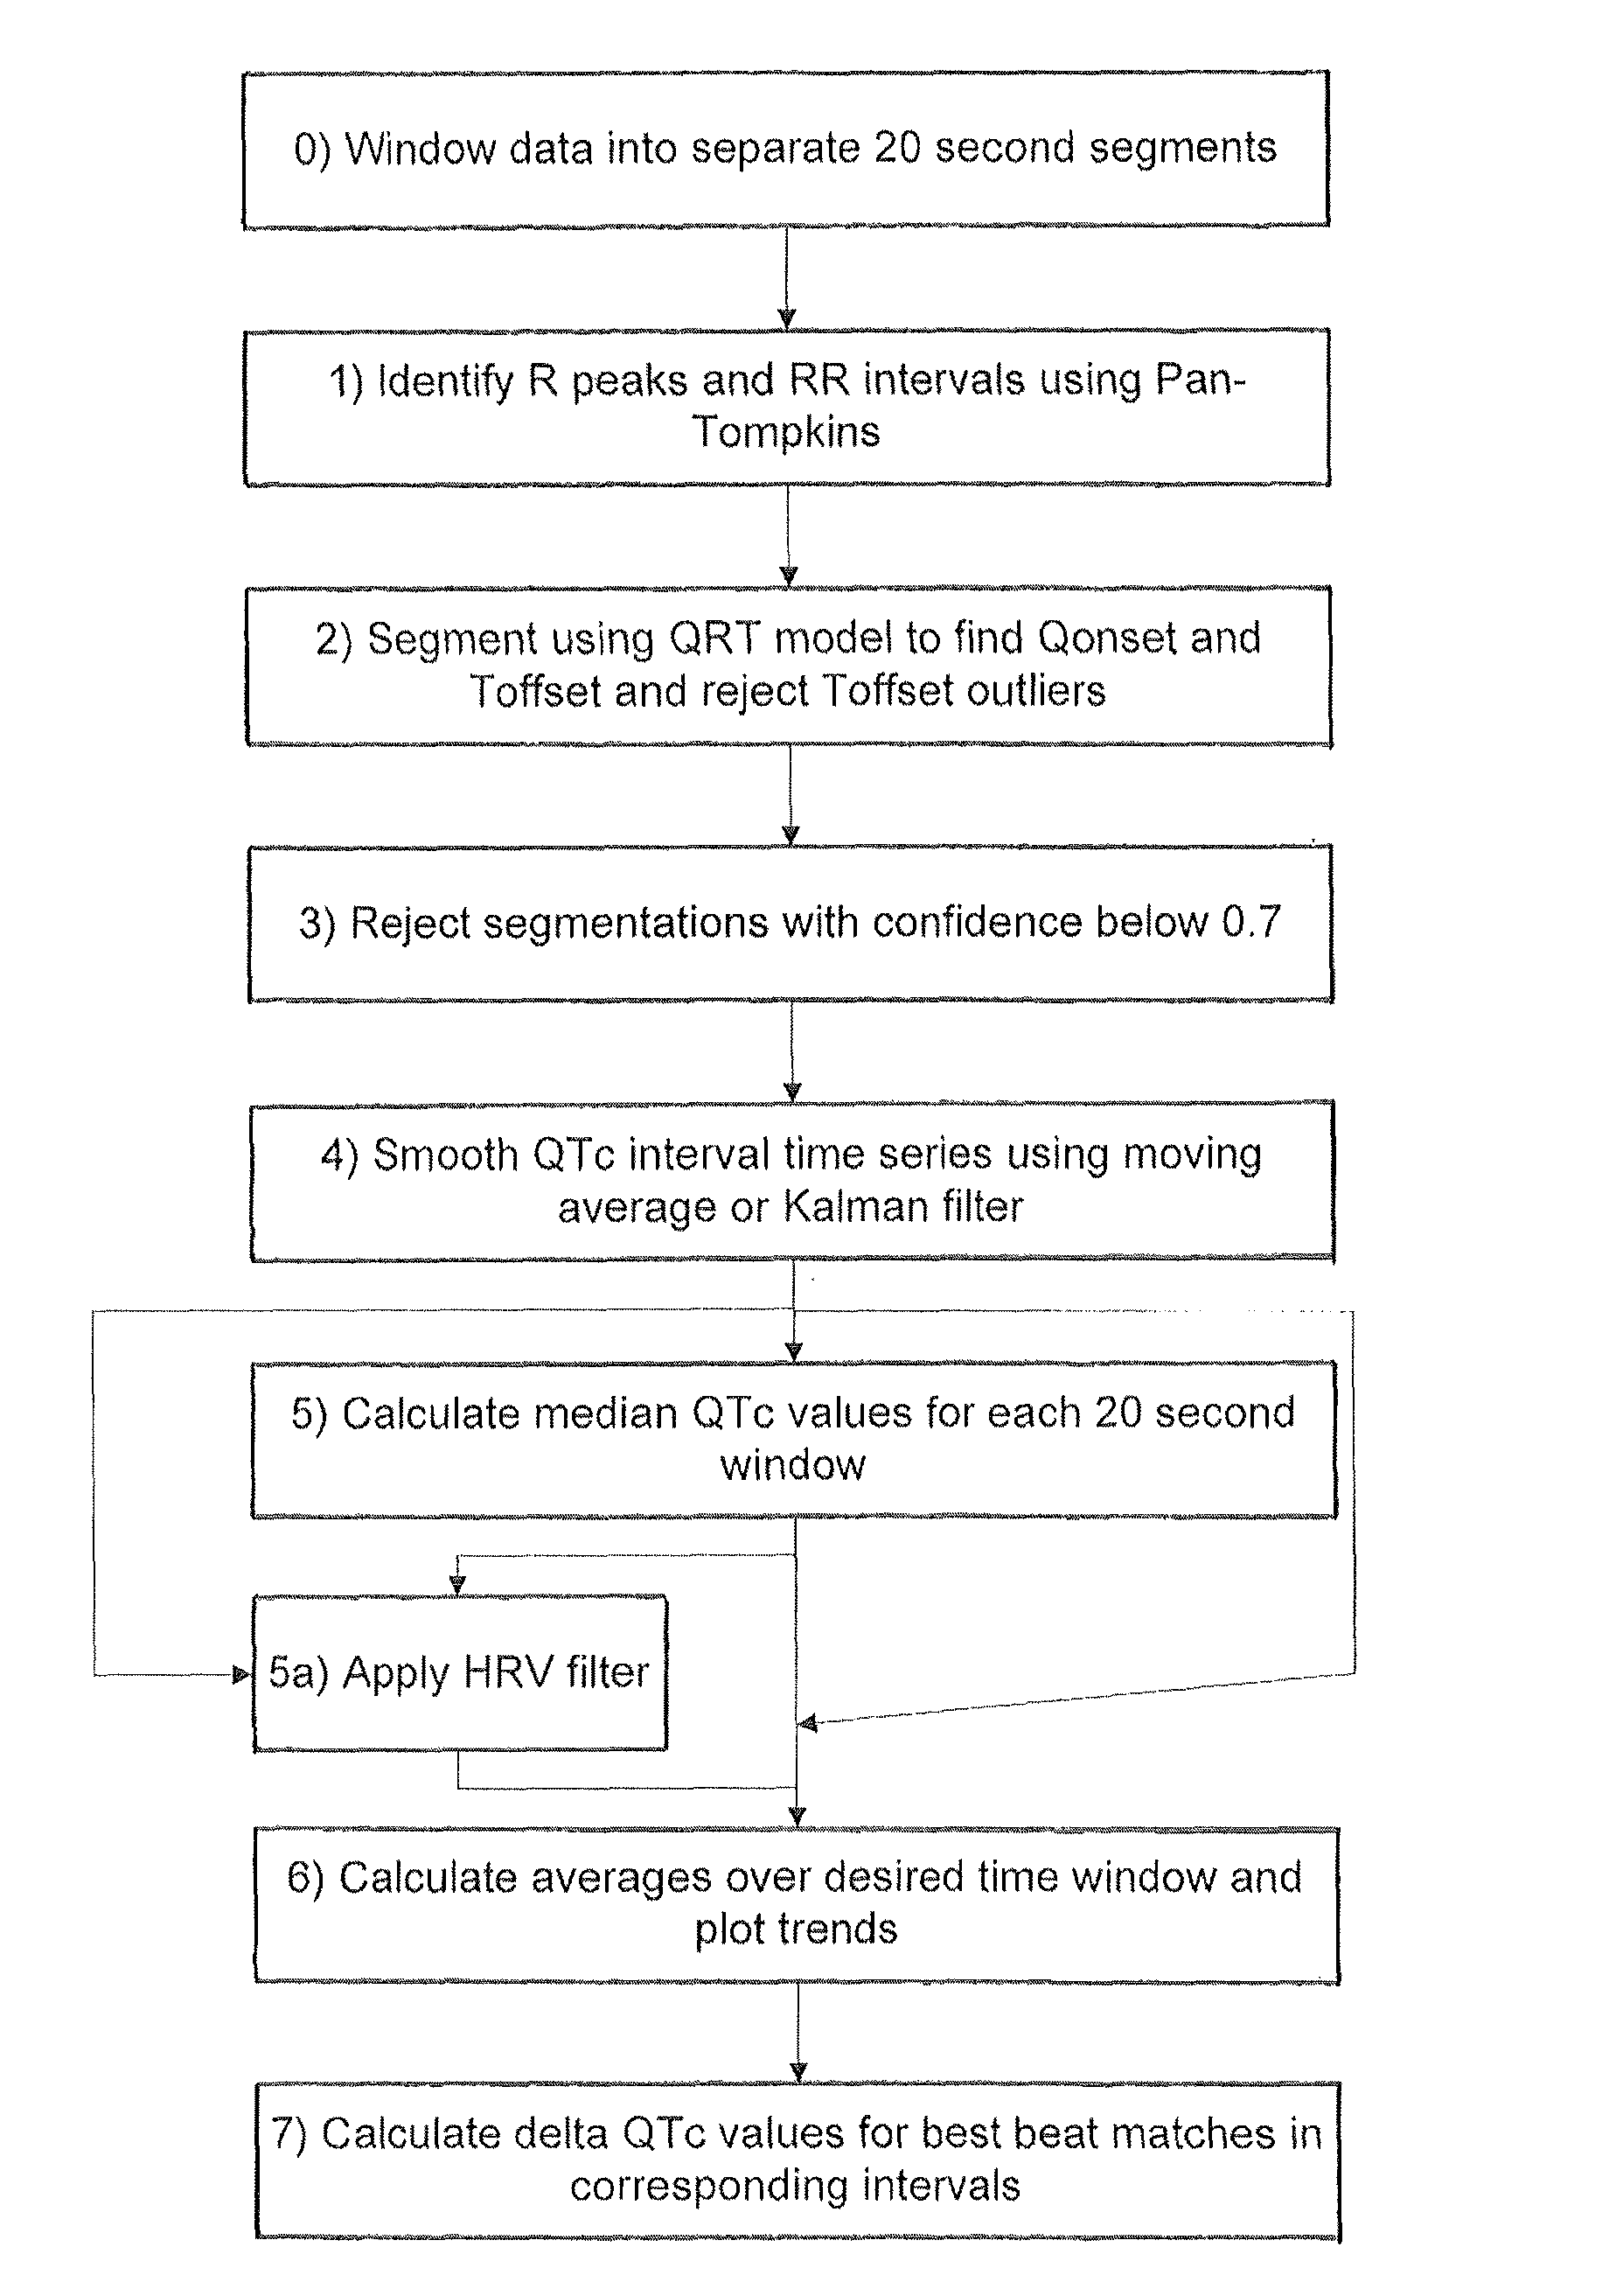
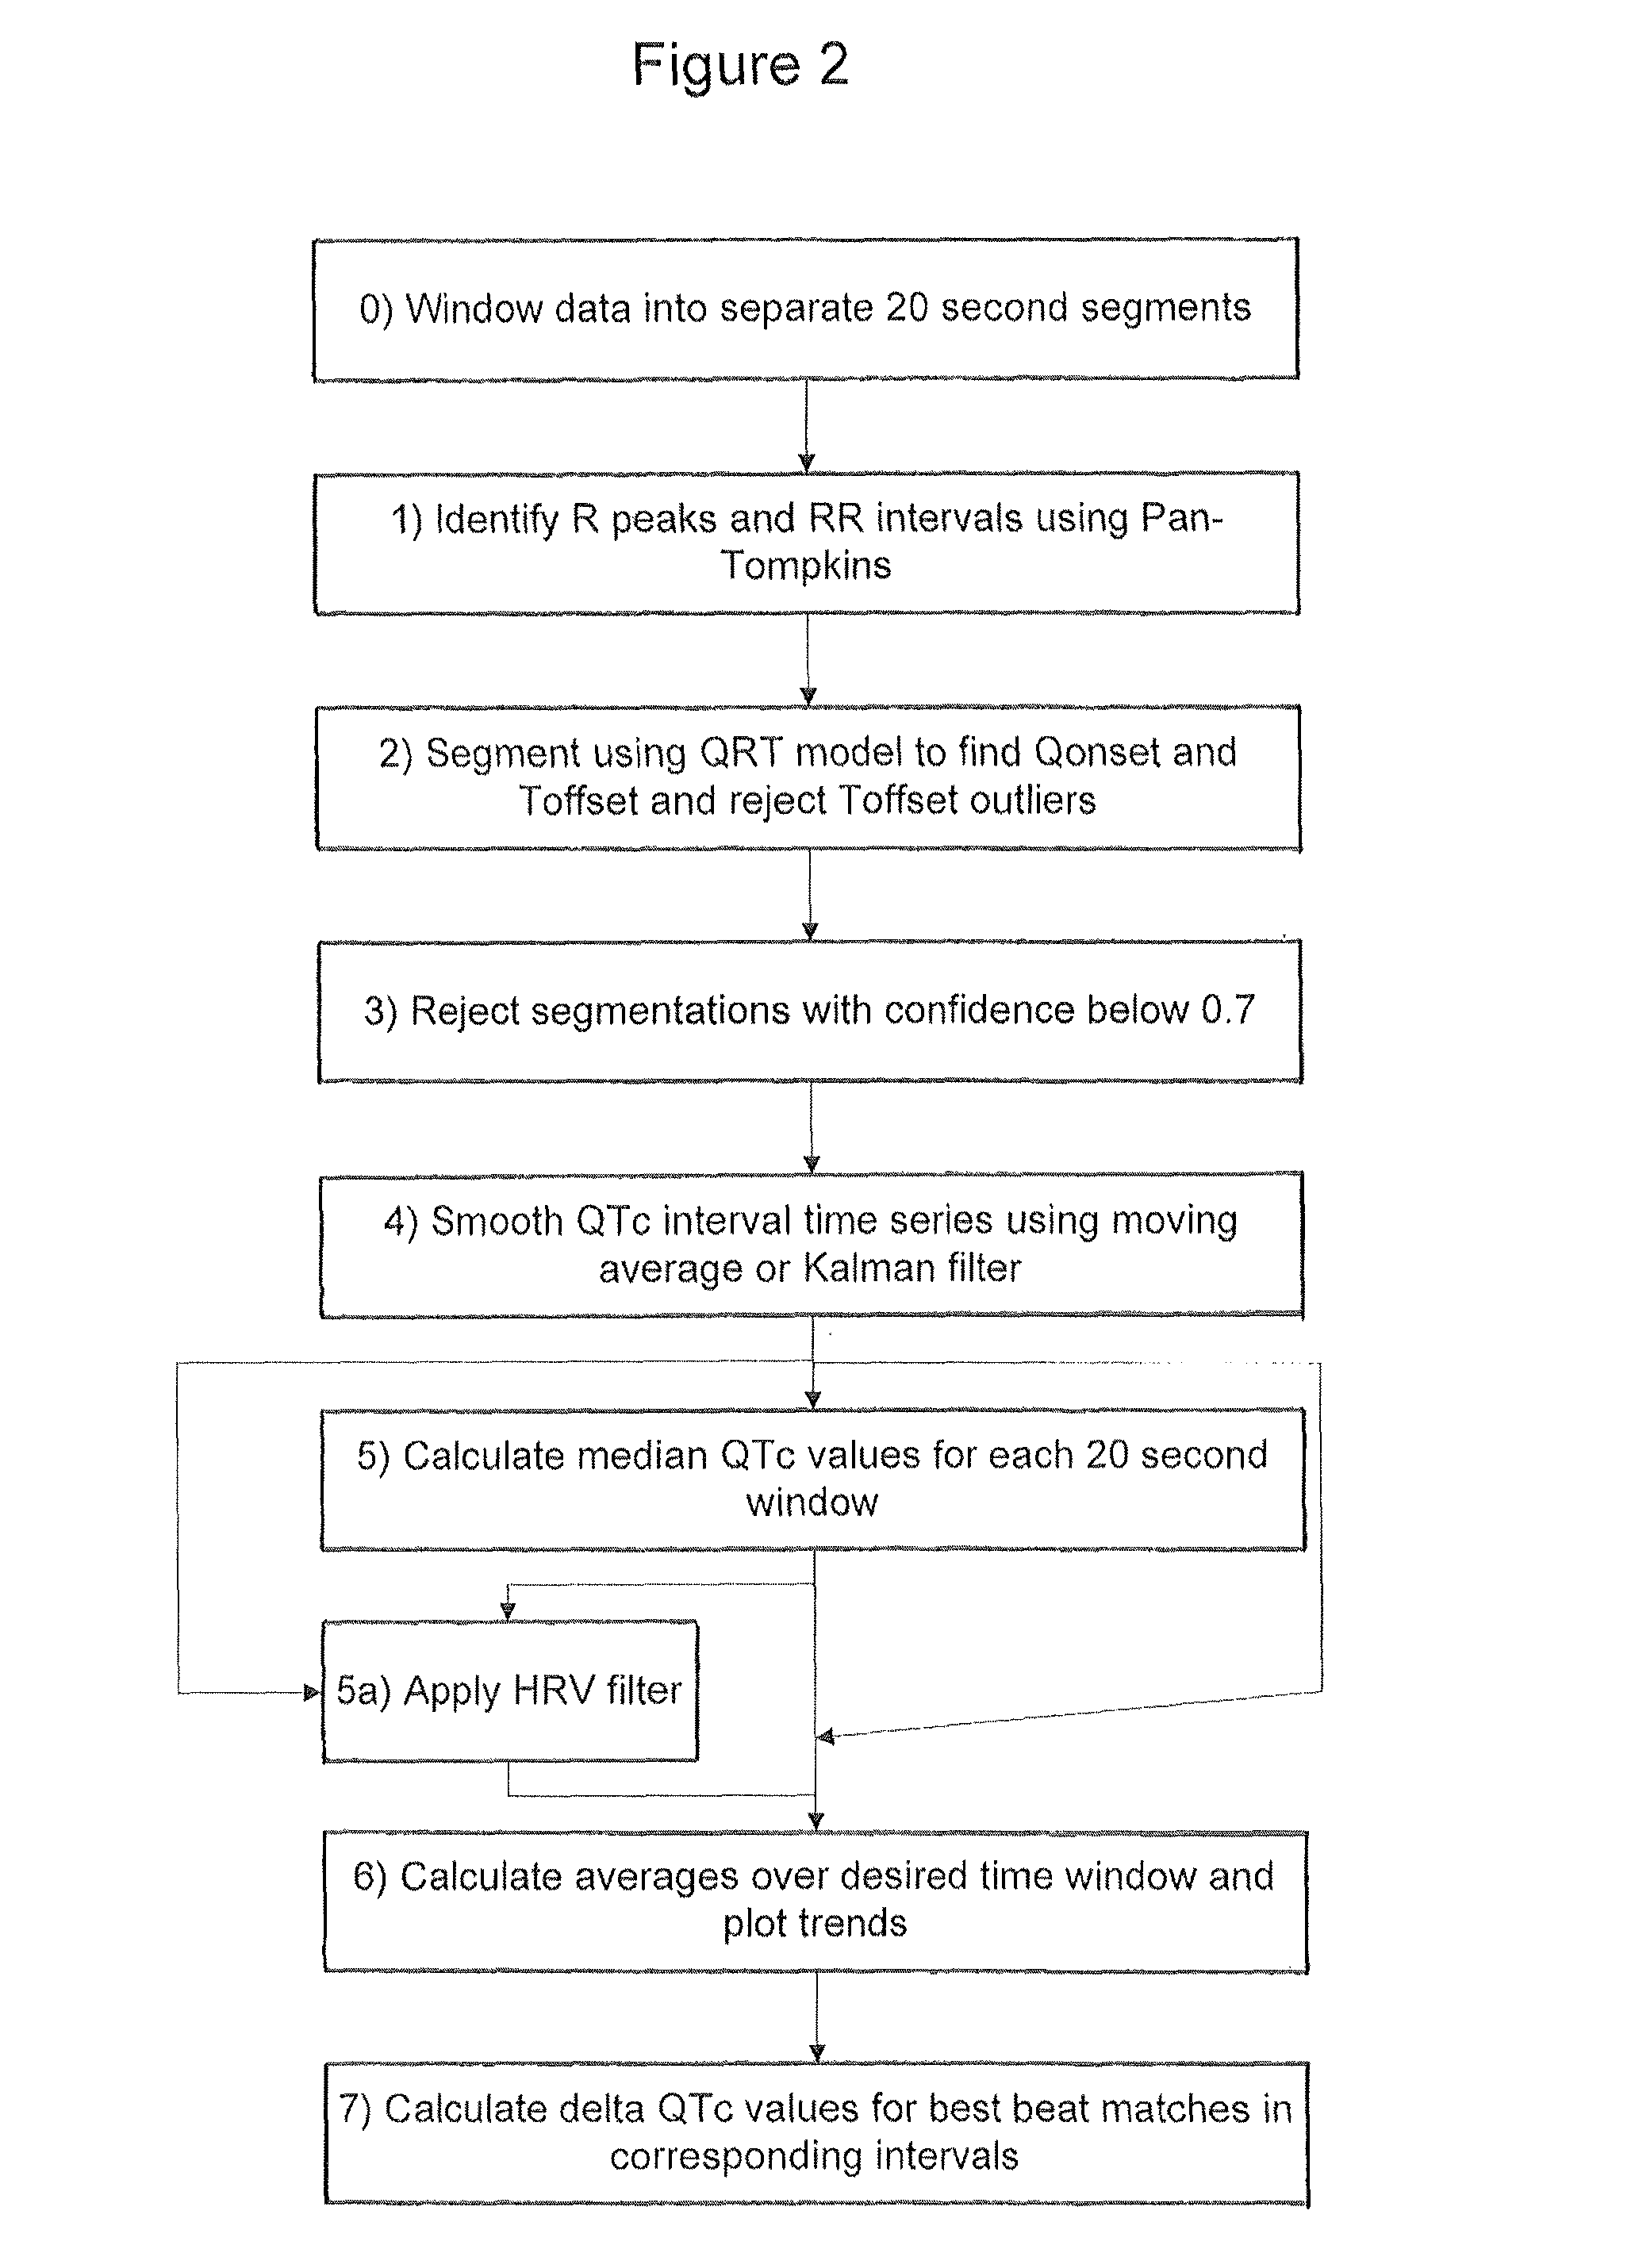
[0043]An embodiment of the invention will now be described which applies the various aspects mentioned above to the analysis of 24 hour Holter recording of 12 channel electrocardiograms (ECGs).

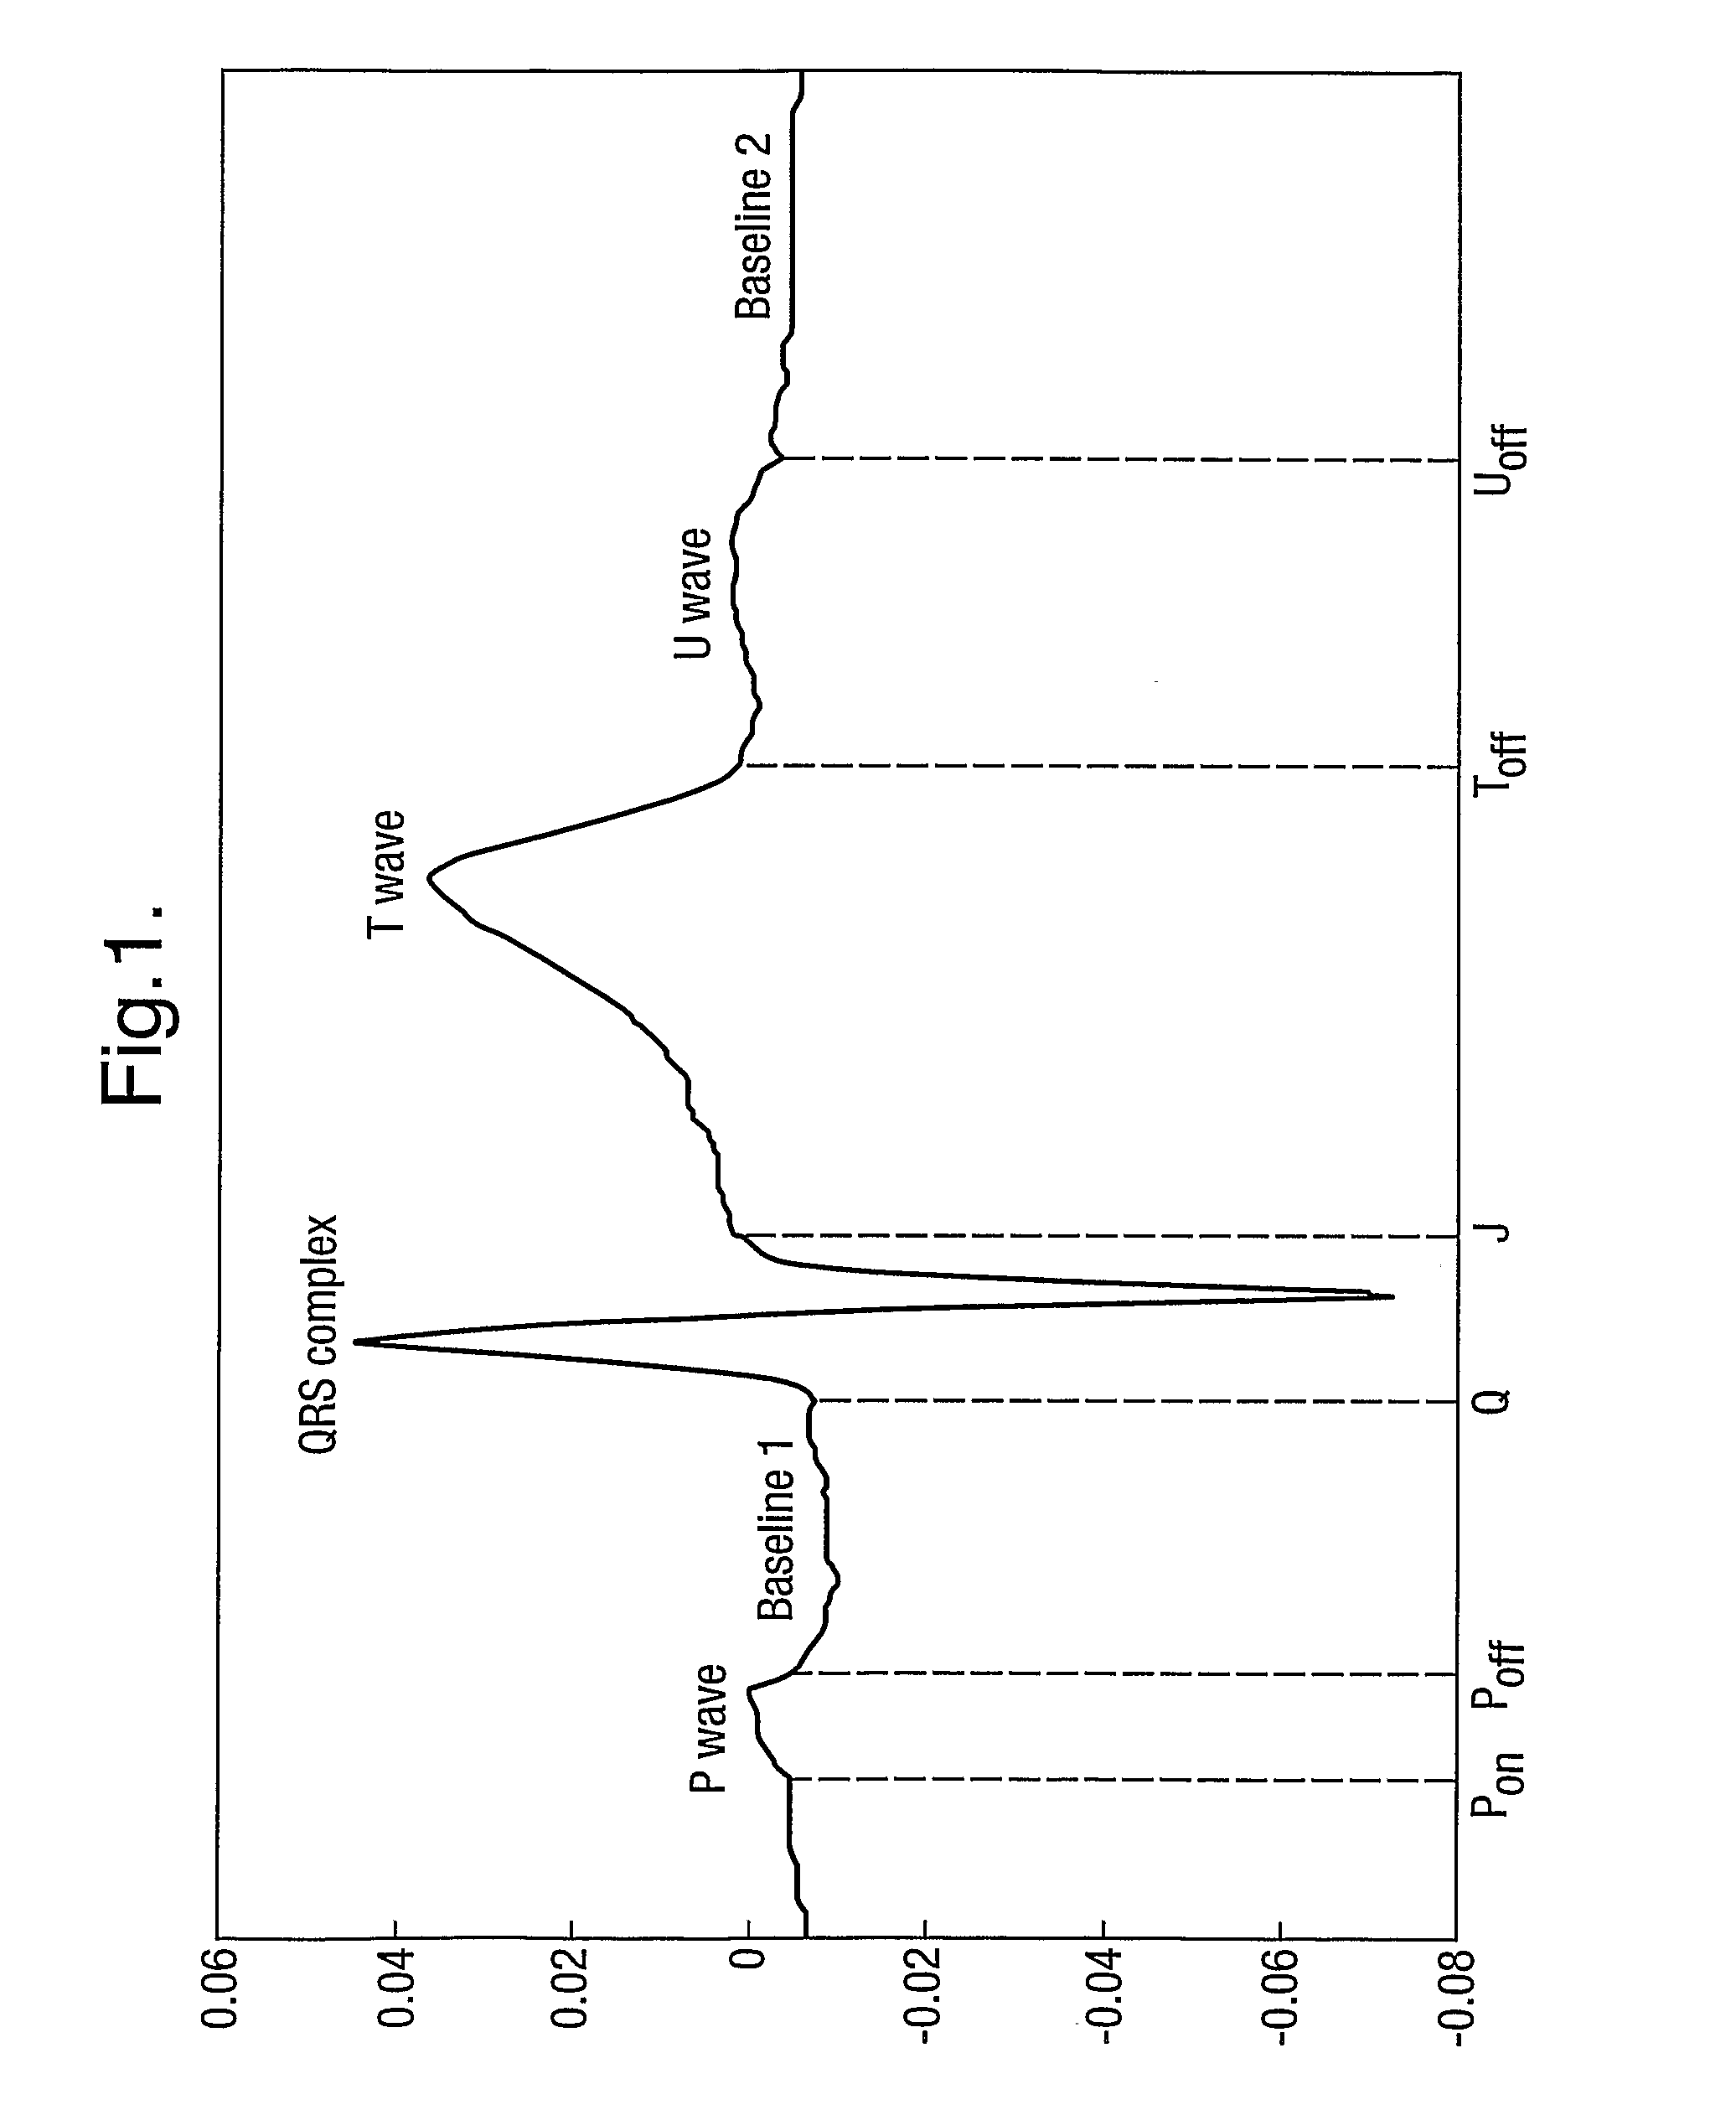
[0044]In the following example the segmentation of the ECG relies on the use of a Hidden Markov Model. The published patent application WO 2005 / 107587, and the papers Hughes NP and Tarassenko L. (2004). Automated QT Interval Analysis with Confidence Measures. Computers in Cardiology, pp. 31-34 and Hughes NP, Tarassenko L & Roberts S. (2004). Markov Models for Automated ECG Interval Analysis. Advances in Neural Information Processing Systems, vol. 16, Thrun S, Saul L & Scholkopf B (eds), MIT Press., which are incorporated herein by reference, describe how to apply a Hidden Markov Model for the entire extent of the human heart beat waveform as illustrated in FIG. 1. That technique detects the various time points in FIG. 1 corresponding to transitions between different states, in particular Ponse...


PUM


Abstract

A method of analysing biomedical signals, for example electrocardiograms, by using a Hidden Markov Model for subsections of the signal. In the case of an electrocardiogram two Hidden Markov Models are used to detect respectively the start and end of the QT interval. The relationship between the QT interval and heart rate can be computed and a contemporaneous value for the slope of this relationship can be obtained by calculating the QT / RR relationship for all of the beats in a sliding time window based on the current beat. Portions of electrocardiograms taken on different days can efficiently and accurately be compared by selecting time windows of the ECGs at the same time of day, and looking for similar beats in those time windows.

Description

[0001]This application is the U.S. national phase of International Application No. PCT / GB2007 / 004593 filed 30 Nov. 2007, which designated the U.S. and claims priority to Great Britain Application No. 0624081.6 filed 1 December 2006, the entire contents of each of which are hereby incorporated by reference,BACKGROUND AND SUMMARY[0002]The present invention concerns a method for the analysis of a biomedical signal such as electrocardiograms (ECG) or other biomedical signals.[0003]There are a variety of biomedical signals, i.e. signals representative of the state or condition of a human or animal, which are obtained invasively or non-invasively by the use of monitoring instrumentation. Typical examples include electrocardiograms (ECG), electroencephalograms (EEG), beat-to-beat blood pressure, the photoplethysmograph (PPG), impedance plethysmograph, respiration rate or impedance pneumogram, and blood oxygen saturation which all have regularly repeating patterns. These signals are typical...

Claims


Application Information

Patent Timeline
Patent Type & Authority Patents(United States)
IPC IPC(8): A61B5/04
CPCA61B5/0452A61B5/7267A61B5/7203G16H50/70A61B5/349A61B5/36
Inventor TARASSENKO, LIONELPATTERSON, ALANSTRACHAN, IAIN GUY
Owner OBS MEDICAL
Why Eureka
Try Eureka