High-performance liquid chromatography analysis method for oryzanol
A high-performance liquid chromatography, oryzanol technology, applied in the direction of analysis materials, material separation, measuring devices, etc., can solve the problems of low separation, poor separation, affecting the quality of oryzanol, etc.
- Summary
- Abstract
- Description
- Claims
- Application Information
AI Technical Summary
Problems solved by technology
Method used
Image
Examples
Embodiment 1
[0047] The selection of embodiment 1 chromatographic conditions
[0048] 1.1 Detection of absorption wavelength
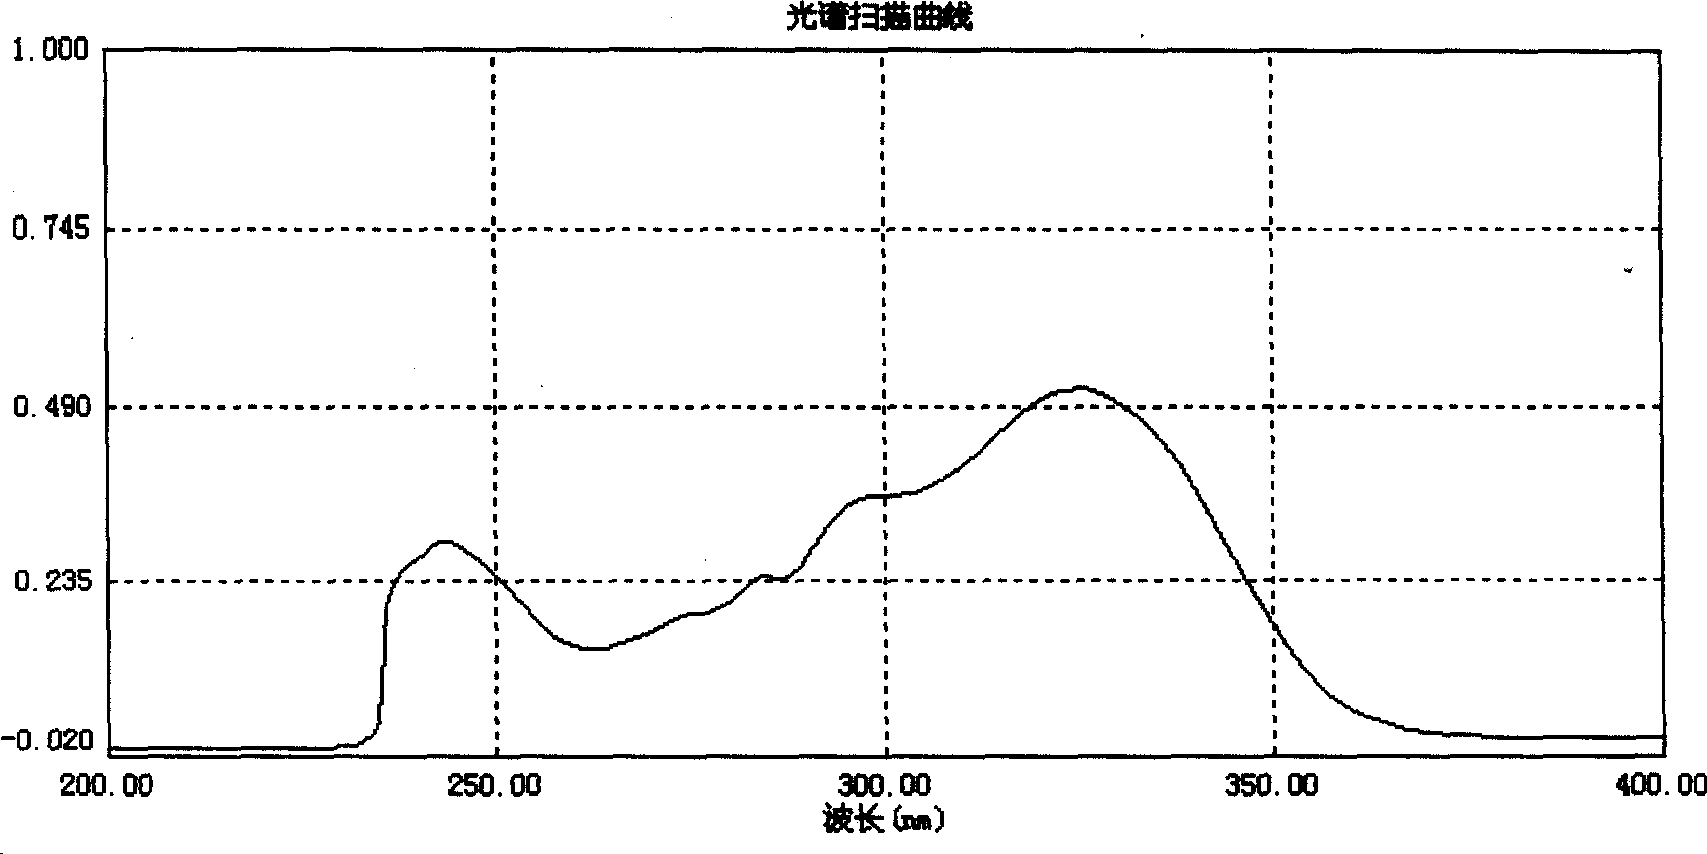
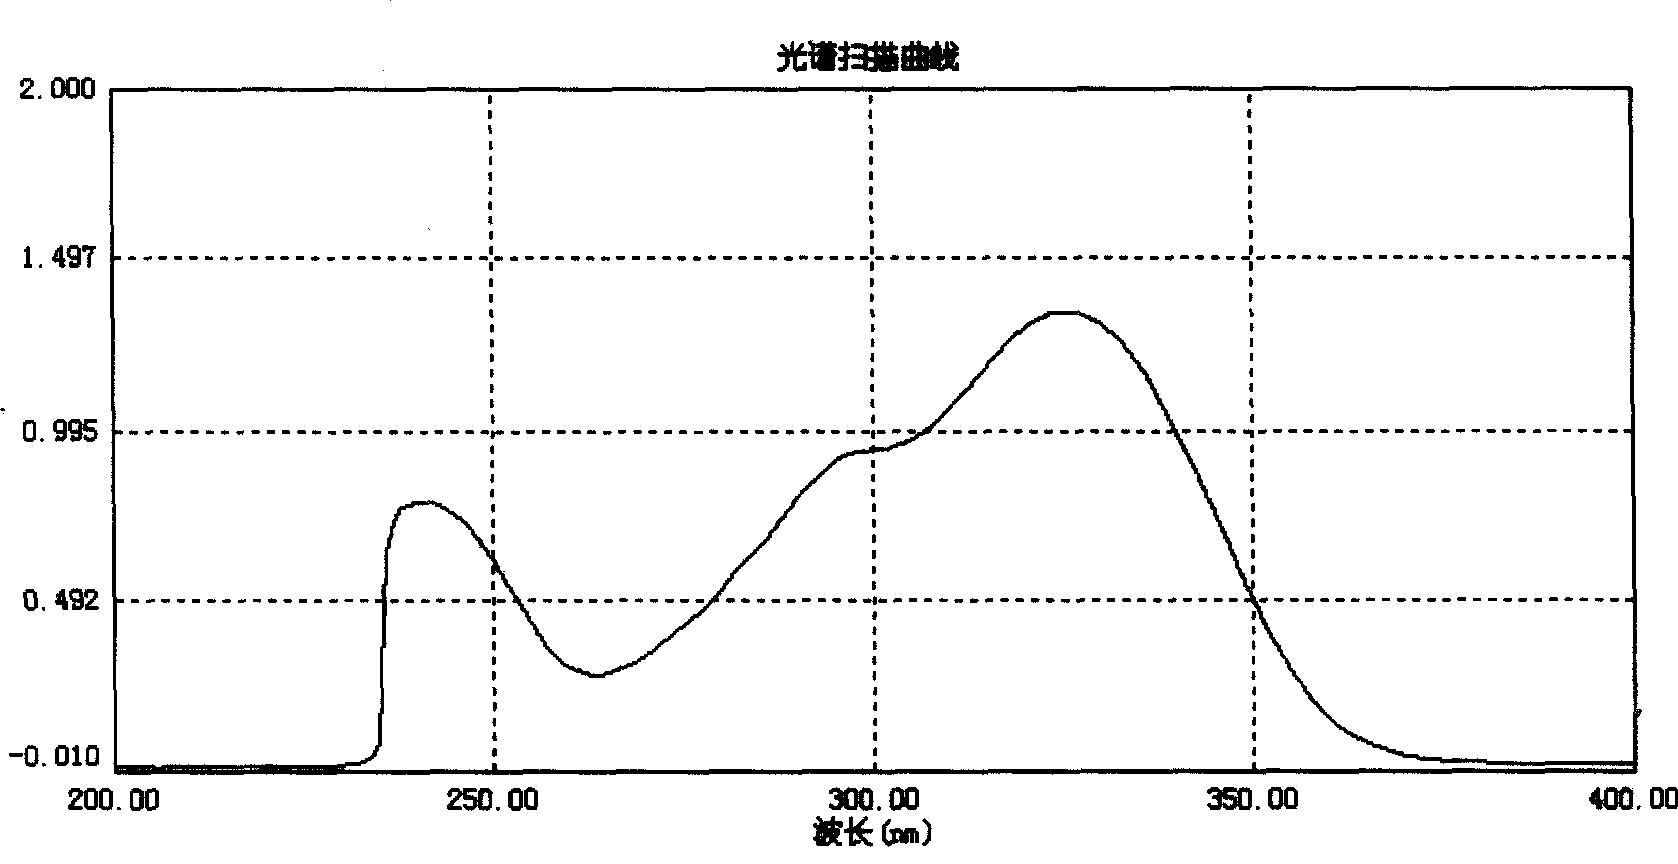
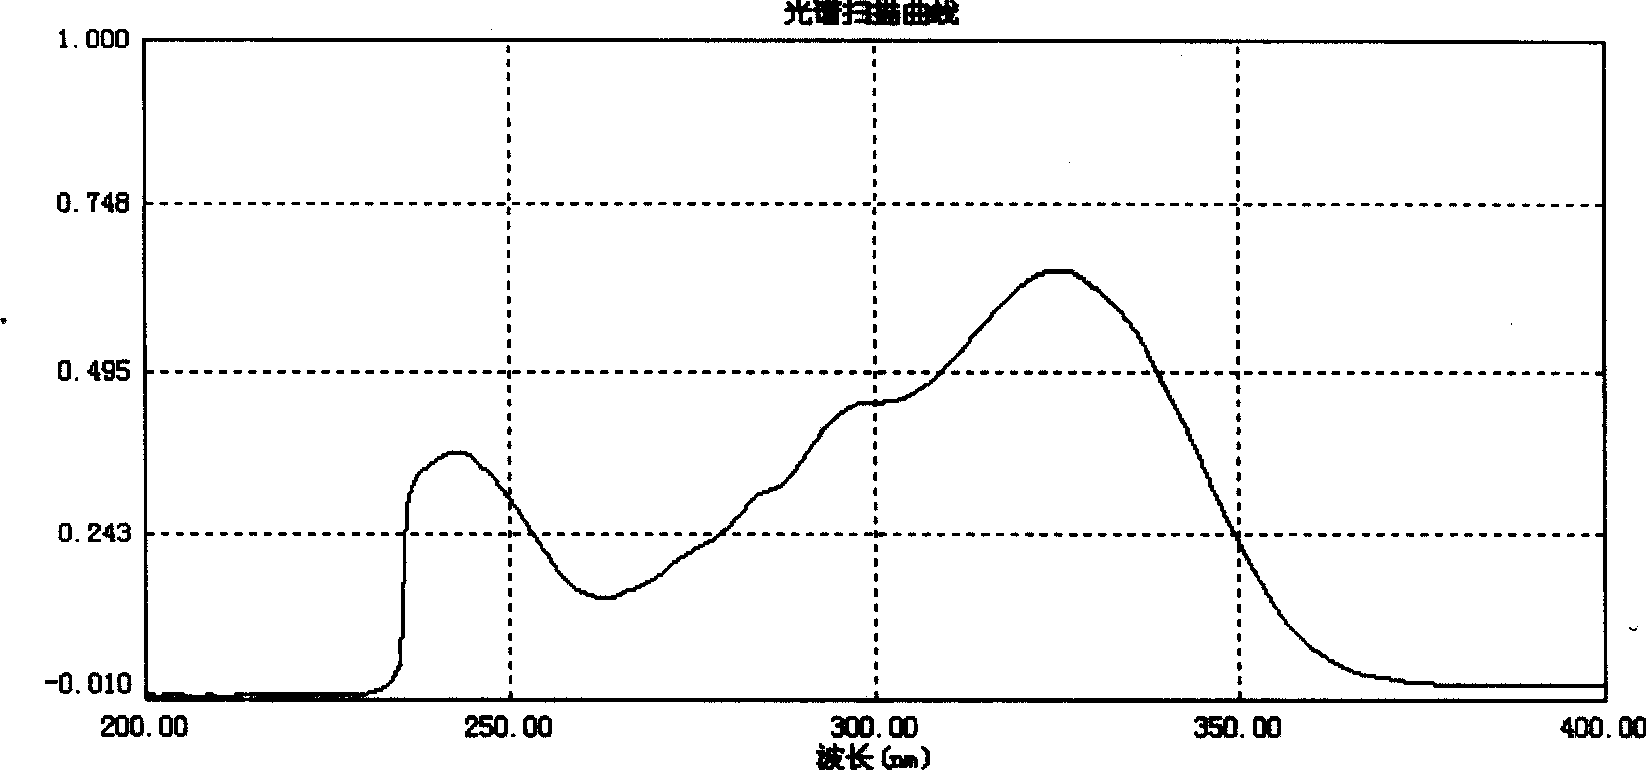
[0049] Continuously scan the oryzanol raw material sample, cycloartenol ferulate reference substance, and 24-methylene cycloartenol ferulate reference substance within the wavelength of 400nm-200nm with an ultraviolet spectrophotometer, and observe the figure 1 , 2 3. It can be found that the maximum absorption wavelength is 325nm, so the present invention selects the detection wavelength as 325nm.
[0050] 1.2 Sample concentration
[0051] In order to take into account the determination of main components and impurity content, an appropriate sample concentration must be selected. If the concentration is too small, it is not conducive to the peak of impurities, and if it is too large, it will affect the main peak beyond the range of the bee line. After comprehensive measurement and with reference to the existing experimental data, the sample solution was select...
Embodiment 2
[0054] Embodiment 2 Configuration of reference substance solution
[0055]Precisely weigh an appropriate amount of cycloarneol ferulic acid ester reference substance and 24-methylene cycloarneol ferulic acid ester reference substance, and add mobile phase A solution to make cycloartenol ferulic acid per ml Ester reference substance and 0.5mg solution of 24-methylenecycloartenol ferulic acid ester, accurately measure the appropriate amount of the solution, add mobile phase A solution to make each ml containing cycloarneol ferulic acid Each 25, 50, 125, 250, and 500 μg solution of the ester reference substance and 24-methylenecycloartenyl ferulic acid ester was taken respectively and 10 μl of each solution was injected into the liquid chromatograph, and the peak areas under each concentration were recorded. And make a linear regression with the peak area A to the concentration C (μg / ml).
Embodiment 3
[0056] Embodiment 3 Determination of Standard Curve
[0057] The experiment was carried out on the basis of Example 2, and the peak area was plotted against the concentration.
[0058] The obtained test data of cycloartenol ferulic acid ester reference substance is as follows
[0059] Table 3 Liquid phase analysis data of cycloartenol ferulate
[0060]
[0061] The experimental data obtained by the 24-methylenecycloartenyl ferulic acid ester reference substance is as follows
[0062] Table 4 24-methylenecycloartenol ferulic acid ester liquid phase analysis data
[0063]
[0064] From the above results, it can be seen that the peak area A of cycloartenol ferulate has a linear relationship with the concentration C in the concentration range of 26.3-525.0 μg / ml, and the concentration of 24-methylene cycloartenol ferulate In the concentration range of 21.3~475.0μg / ml, the peak area A and the concentration C have a linear relationship. Figure 4 , 5 .
[0065] Based on ...
PUM
 Abstract
Description
Claims
Application Information
 - R&D
- Intellectual Property
- Life Sciences
- Materials
- Tech Scout
- Unparalleled Data Quality
- Higher Quality Content
- 60% Fewer Hallucinations
Browse by: Latest US Patents, China's latest patents, Technical Efficacy Thesaurus, Application Domain, Technology Topic, Popular Technical Reports.
© 2025 PatSnap. All rights reserved.Legal|Privacy policy|Modern Slavery Act Transparency Statement|Sitemap|About US| Contact US: help@patsnap.com


