
Method for conversion of spectrum into chromaticity

A spectral conversion and chromaticity technology, applied in the spectrum field, can solve problems such as the inability to quickly identify spectral curves

Active Publication Date: 2012-10-10
HEBEI UNIV OF TECH
View PDF5 Cites 14 Cited by
  • Summary
  • Abstract
  • Description
  • Claims
  • Application Information

AI Technical Summary

Problems solved by technology

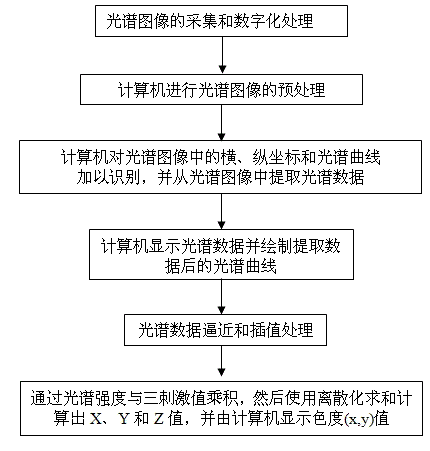
[0003] The technical problem to be solved by the present invention is to provide a method for converting spectrum to chromaticity, which overcomes the shortcomings of the prior art that cannot quickly identify spectral curves, extract spectral data, and automatically convert to chromaticity

Method used


Image

  • Method for conversion of spectrum into chromaticity
  • Method for conversion of spectrum into chromaticity
  • Method for conversion of spectrum into chromaticity

Examples


Embodiment 1

[0054] The first step, spectral image acquisition and digital processing

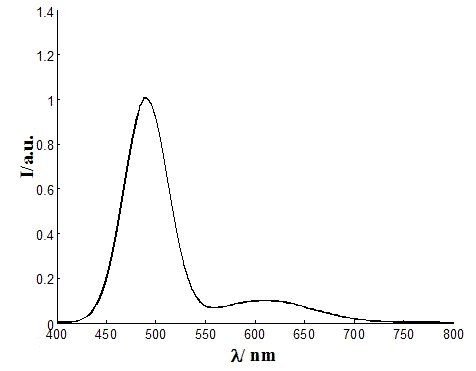
[0055] The source of the collected spectral image is the simulated spectral image to be identified provided by the user, see figure 2 . The spectral picture is synthesized by two Gaussian functions to simulate the spectral curve picture, using the formula:

[0056] I = 1.0 × exp [ - ( λ - 4900 ) 2 1000 ] + 0.1 × exp [ - ( λ - 610 ) 2 6000 ] - - - ( 2 - 1 ...

Embodiment 2

[0090] The first step, spectral image acquisition and digital processing

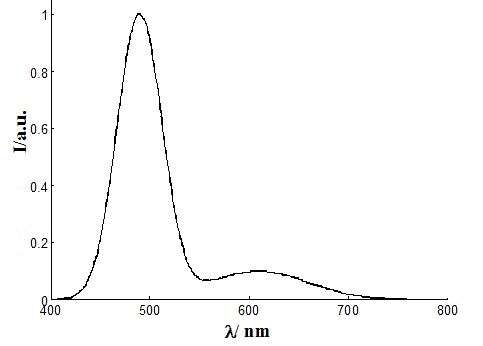
[0091] The source of the spectral image collection is the computer spectral image after the spectral image in the literature (Luminescence Journal, 2000 (12), 21 (4): 380-382) is digitalized by a scanner, see Figure 4 ;

[0092] In the second step, the computer preprocesses the spectral image

[0093] The image processing software Photoshop under Windows is used to preprocess the spectral image obtained in the first step to complete individual noise removal and improve image clarity;

[0094] In the third step, the computer identifies the abscissa, ordinate and spectral curve in the spectral image, and extracts the spectral data from the spectral image

[0095] With embodiment 1.

[0096] In the fourth step, the computer displays the spectral data and draws the extracted data into a spectral curve

[0097] Use the computer to display the spectral data extracted from the spectral image in the third ...

Embodiment 3

[0122] The first step, spectral image acquisition and digital processing

[0123] The source of the collected spectral image is the photo in the manual of ANDO Optical Spectrum Analyzer AQ-6315. The output picture of the spectrometer is the spectral photo of the LED output taken by the Sony DSC-V1 digital camera. See Figure 6 , the original picture is small, and the coordinate numbers in the picture are blurred, but the coordinate axes, coordinate units and curves can still be clearly distinguished;

[0124] In the second step, the computer preprocesses the spectral image

[0125] The image processing software Microsoft Office Picture Manager under Windows is used to preprocess the spectral image obtained in the first step to complete individual noise removal and improve image clarity;

[0126] In the third step, the computer identifies the abscissa, ordinate and spectral curve in the spectral image, and extracts the spectral data from the spectral image

[0127] With embod...


PUM


Abstract

The technical scheme of the invention relates to the field of spectrum, in particular to a method for conversion of spectrum into chromaticity, which comprises the steps of: collection and digital processing of a spectral image; preprocessing of the spectral image with a computer; identification of the horizontal ordinate, vertical ordinate and spectral curve in the spectral image via the computer, and extraction of spectral data from the spectral image; display of the spectral data on the computer, and drawing of a spectral curve according to the extracted data; approximation and interpolation of the spectral data; and calculation of the values of X, Y and Z via discrete summation according to the product of the spectral intensity and the tristimulus value, and display of the chromaticity (x and y) on the computer. By adopting the method, the defects of the prior art that the spectral curve cannot be identified rapidly, the spectral data cannot be rapidly extracted and automatically converted into the chromaticity can be overcome.

Description

technical field [0001] The technical solution of the present invention relates to the spectrum field, specifically a method for converting spectrum into chromaticity. Background technique [0002] With the continuous development and improvement of semiconductor material growth and device technology level, especially the successful development of blue and green light-emitting tubes (LEDs) with sapphire as the substrate, the emergence of fluorescent materials of various colors, breakthroughs have been made in ultra-high brightness LEDs , people pay more and more attention to the chromaticity of materials and devices, so those skilled in the art began to study the chromaticity, and developed different colorimeters. CN1691749 discloses a digital camera capable of measuring chromaticity coordinates and correlated color temperature and its method; WO02 / 090909 discloses a system and method for identifying primary color chromaticity coordinates of red, green and blue light sources; ...

Claims


Application Information

Patent Timeline
IPC IPC(8): G01J3/46
Inventor 赵红东孙梅刘琦沈虹康志龙郭艳菊张魁
Owner HEBEI UNIV OF TECH
Learn More