

Peak conversion method of three-dimensional spectroscopic data under different photomultiplier tube voltages
A photomultiplier tube and spectral data technology, applied in the field of peak conversion, can solve problems such as the difficulty in accurately determining the specific position of the Raman peak, the uncalibrated fluorescence signal, and the dependence of the fluorescence signal intensity, etc., to achieve convenient and fast accuracy, convenient comparison, The effect of high accuracy
- Summary
- Abstract
- Description
- Claims
- Application Information
AI Technical Summary
Problems solved by technology
Method used
Image

Examples
Embodiment 1
[0026] see Figure 1~Figure 4 , the peak conversion method of three-dimensional fluorescence spectrum data under different photomultiplier tube voltages, including two steps of numerical correction and peak conversion:
[0027] Described value correction step comprises the steps:
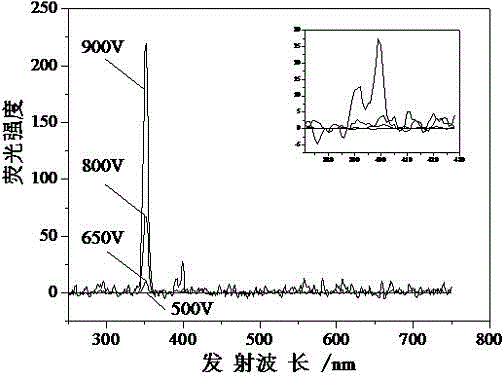
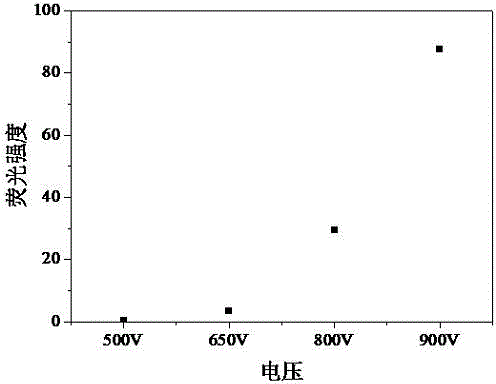
[0028] (1) Set the three-dimensional fluorescence measurement conditions, in which the voltage of the photomultiplier tube is set to 500V, 650V, 800V, and 900V in sequence, and the excitation-emission matrix spectrum of deionized water is measured to obtain the data of excitation wavelength-emission wavelength-fluorescence intensity;
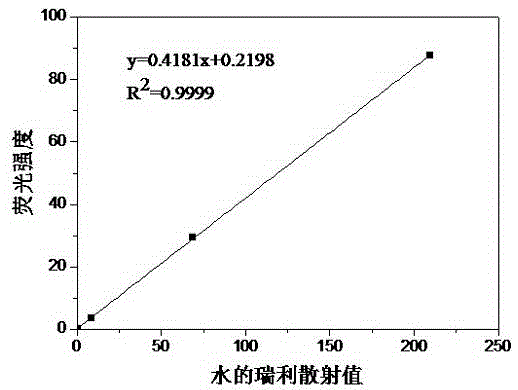
[0029] (2) Use the special reagent for fluorescence analysis, quinine sulfate solution, to perform linear fitting on the peak value within the corresponding wavelength range under the corresponding voltage and the data obtained in the step (1).
[0030] Described peak conversion step comprises the following steps:
[0031] (3) Linearly fit the peak value of the samp...
Embodiment 2
[0034] This embodiment is basically the same as Embodiment 1, and the special feature is: according to the peak value of the three-dimensional fluorescence spectrum of the solution to be measured under different voltages and the Rayleigh scattering value of deionized water at the excitation wavelength Ex=emission wavelength Em=350nm at the corresponding voltage The linear fitting results can judge the accuracy of the peak value of the three-dimensional fluorescence spectrum of the sample under different voltages, and use the obtained linear equation to correct the value. The peak data of the three-dimensional spectral data under different photomultiplier tube voltages can directly read the measured value of the three-dimensional fluorescence spectral data without additional calculation, which is convenient, fast and highly accurate.
Embodiment 3
[0036] In this experiment, the concentration of quinine sulfate solution, a special reagent for fluorescence analysis, was 1×10 -7 mol / L, the samples used were water samples from water plants, and three-dimensional fluorescence excitation-emission spectroscopy (3DEEM) was measured using a highly sensitive fluorescence spectrophotometer with a 10mm quartz fluorescence sample cell (Shanghai Lenslight F97XP / F97Pro / F97, China) . Excitation light source is 150W xenon lamp, bandwidth: excitation bandwidth is 10nm, emission bandwidth is 10nm; response time: automatic; scanning speed: 15000nm / min; excitation wavelength range is Ex=200-700nm (interval 5nm), emission wavelength range is Em= 250-750nm (interval 5nm), the experiment is divided into four groups according to different photomultiplier tube voltages, namely: 500V, 650V, 800V and 900V, each group first measures the deionized water, and then performs the determination of the sample. The temperature is constant. The obtained t...
PUM
 Abstract
Description
Claims
Application Information