Method for rapidly nondestructively detecting wheat hardness based on near infrared spectrum technology and application
A technology of near-infrared spectroscopy and near-infrared spectrometer, applied in measuring devices, material analysis through optical means, instruments, etc., can solve the problems of long detection period, high detection cost, cumbersome operation, etc., and achieve fast detection speed and objectivity High, improve the effect of detection efficiency
- Summary
- Abstract
- Description
- Claims
- Application Information
AI Technical Summary
Problems solved by technology
Method used
Image
Examples
Embodiment 1
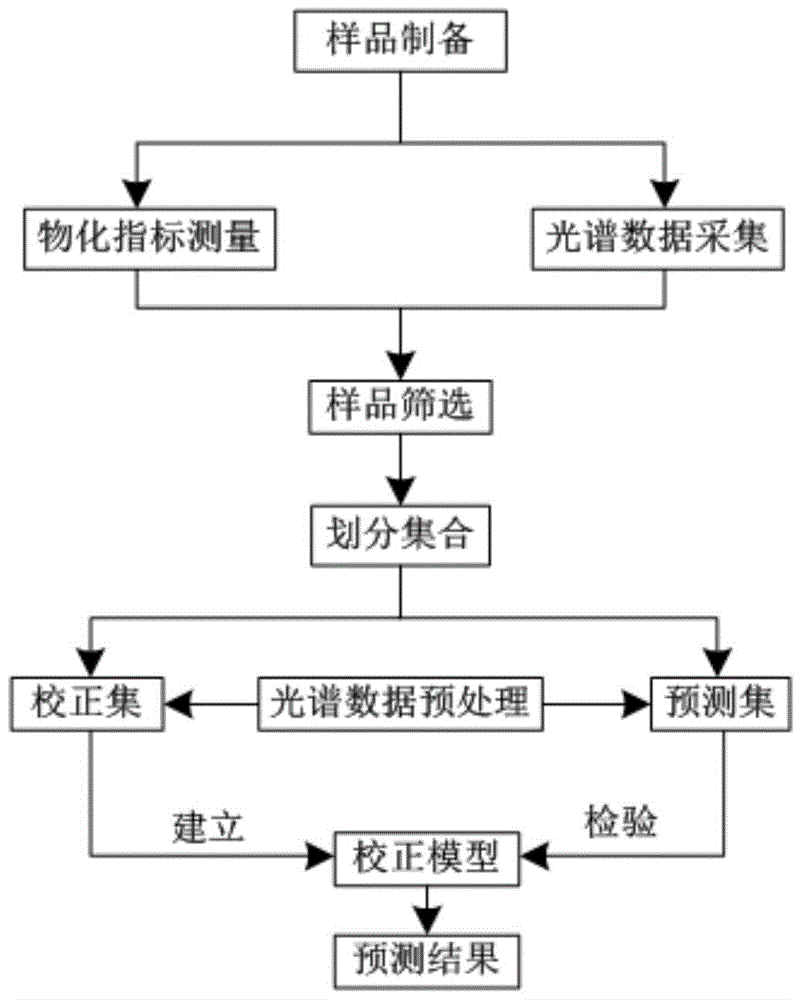
[0041] 1. The samples selected in this example are the 2013 wheat samples collected by the Institute of Agricultural Product Quality and Safety of the Heilongjiang Academy of Agricultural Sciences from the main wheat producing areas across the country, and a total of 111 samples were collected.
[0042] The spectral data is obtained by using a near-infrared spectrum analyzer. The specific process is: control the temperature at about 25°C at room temperature during scanning; when loading the sample, the cup mouth needs to be scraped flat after the sample is placed in the sample cup, so that the sample surface and the edge of the sample cup are as flat as possible;
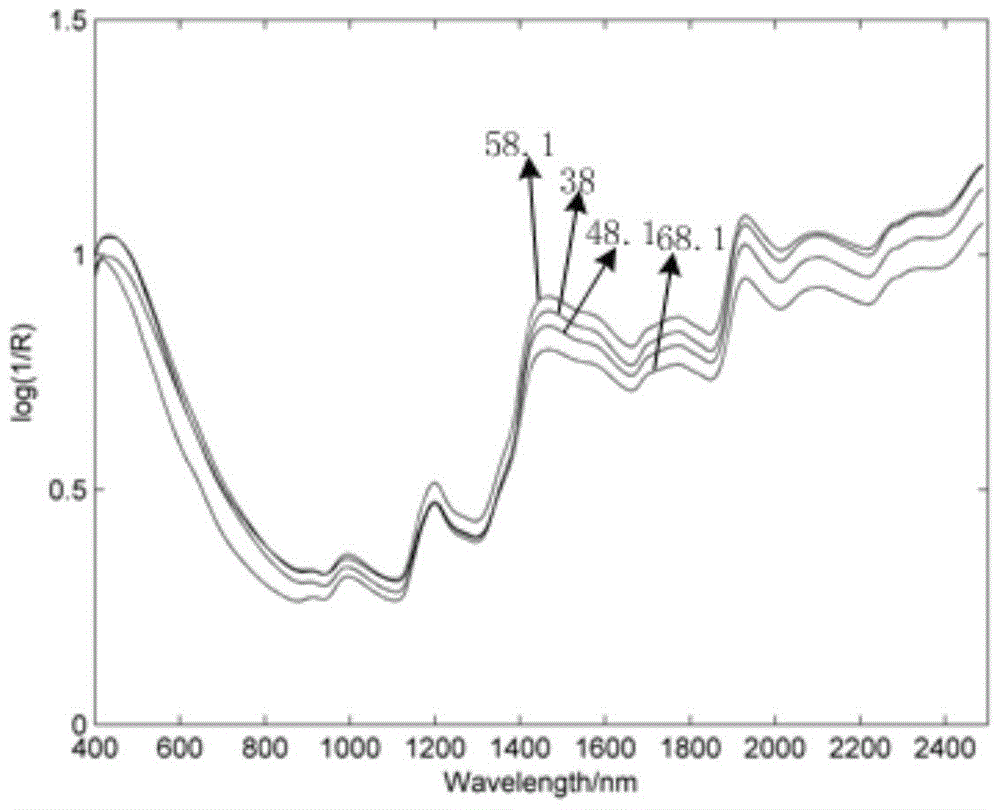
[0043]The sample was placed in a prototype slot with a diameter of 35mm and a depth of 10mm for scanning, the scanning interval was 8nm, and 2 scans were performed to generate 262 spectral points, such as figure 2 NIR spectra of 4 wheats.
[0044] 2. Carry out routine experiments on the wheat samples scanned by the...
Embodiment 2
[0053] 1. Steps 1-3 are the same as steps 1-3 in Example 1.
[0054] 2. Use the raw spectra of the unprocessed calibration set samples to establish a radial basis function (RBF) neural network model, and use the predicted set samples to test the RBF model. The RBF of the model 2 was 0.79, the RPD was 2.19, and the SEP was 4.30.
Embodiment 3
[0056] 1. Steps 1-3 are the same as steps 1-3 in Example 1.
[0057] 2. Use standard normal variable transformation SNV to optimize the spectral data of all samples to eliminate the influence of correction scattering, and then obtain the second derivative spectrum by mathematical calculation method.
[0058] 3. Use the calibration set samples to establish a partial least squares (PLS) model, and use the prediction set samples to verify and correct the PLS model. The R of the model 2 was 0.85, the RPD was 2.57, and the SEP was 3.66.
PUM
 Abstract
Description
Claims
Application Information
 - R&D
- Intellectual Property
- Life Sciences
- Materials
- Tech Scout
- Unparalleled Data Quality
- Higher Quality Content
- 60% Fewer Hallucinations
Browse by: Latest US Patents, China's latest patents, Technical Efficacy Thesaurus, Application Domain, Technology Topic, Popular Technical Reports.
© 2025 PatSnap. All rights reserved.Legal|Privacy policy|Modern Slavery Act Transparency Statement|Sitemap|About US| Contact US: help@patsnap.com


