Fully automatic sound velocity measuring instrument and measurement method

A fully automatic, measuring instrument technology, applied in measuring devices, measuring propagation velocity, measuring ultrasonic/sonic/infrasonic waves, etc., can solve the problems of difficult to accurately find the maximum position of the waveform, complicated experimental steps, difficult to determine the accuracy, etc., to achieve Intuitive effect, high data collection efficiency, and effect of improving accuracy

Inactive Publication Date: 2015-12-16
NANYANG INST OF TECH
View PDF7 Cites 10 Cited by
  • Summary
  • Abstract
  • Description
  • Claims
  • Application Information

AI Technical Summary

Problems solved by technology

When moving the receiver along the direction of propagation, you can always find a position so that the signal received by the acoustic wave receiver is in phase with the excitation electrical signal of the acoustic wave transmitter, and continue to move the acoustic wave receiver until the found signal is in phase with the acoustic wave transmitter's excitation electrical signal again. When the excitation electrical signals are in the same phase, the distance traveled is equal to the wavelength of the sound wave. When measuring the wavelength according to the Lissajous figure, if the frequency of the two harmonic vibrations is the same, the Lissajous figure is an ellipse, and the different images of the ellipse are consistent with the two It is related to the phase difference of two vibrations. As the phase difference of two vibrations changes from 0-π, the graph will change from a straight line with a positive slope to an ellipse and then to a straight line with a negative slope. Choose the one with a more sensitive judgment, that is, Lissajous If the position of the graph is a straight line as the starting point of the measurement, a straight line with the same slope will appear repeatedly every time you move a distance of one wavelength, continue to slowly move away the acoustic wave receiver, and record the position of the receiver when a straight line with a positive slope appears on the fluorescent screen in turn The reading can be calculated by the difference-by-step method to calculate the average value of the acoustic wavelength λ, the frequency f of the ultrasonic source can be read out by the signal generator, and the sound velocity can be calculated by using v=λf. This method is the phase comparison method, and its advantages are image, Intuitive, the disadvantage is that it is not easy to determine the exact position of the Lissajous figure as a straight line. It is possible that the two sides of the ellipse do not overlap to the best. After a little adjustment, it may be over. There will be a gap in the callback, and it will be inaccurate if it is not retracted. , in a dilemma
[0003] It can be seen that both the standing wave method and the phase comparison method used in university physics experiments have common problems, namely: both have sophisticated and complex mechanical transmission devices, and there is a return difference when the ultrasonic receiver moves in the reverse direction.
Most of the existing sound velocity measuring instruments fix the sound wave generator at one end of the vernier caliper, and the sound wave receiver is fixed on the vernier caliper through the slider, which requires manual control, and it is difficult to accurately find the position of the maximum value of the waveform or the position where the Lissajous figure is a straight line , the experimental error is very large. In addition, the oscilloscope required for the experiment also needs to be provided separately. The data acquisition and display scheme realizes the sound velocity measurement in a more convenient way. With the development and progress of science and technology, the design of the upper computer as the main control center will gradually show its advantages

Method used


Image

  • Fully automatic sound velocity measuring instrument and measurement method
  • Fully automatic sound velocity measuring instrument and measurement method
  • Fully automatic sound velocity measuring instrument and measurement method

Examples


Embodiment Construction

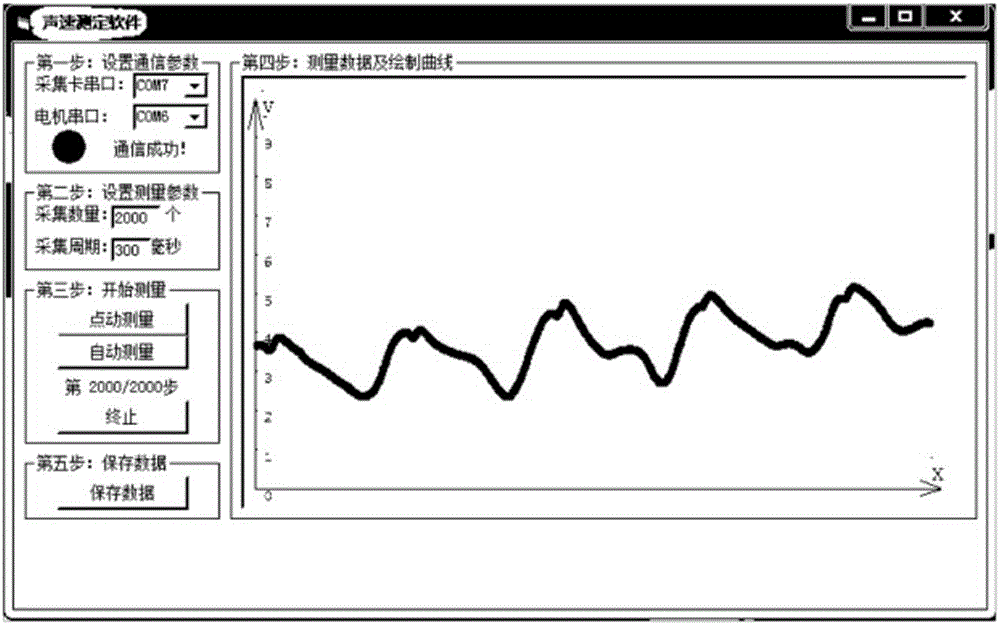
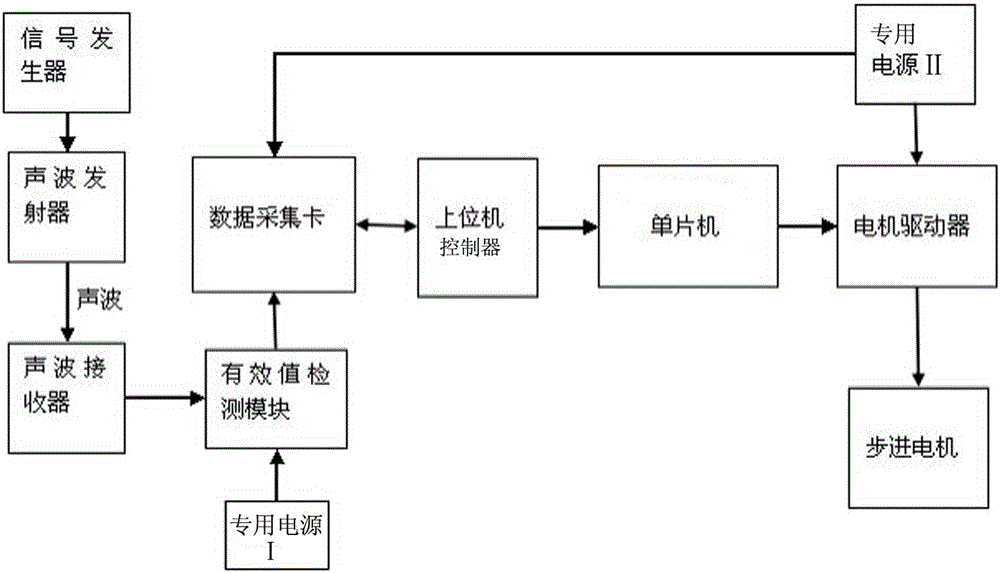
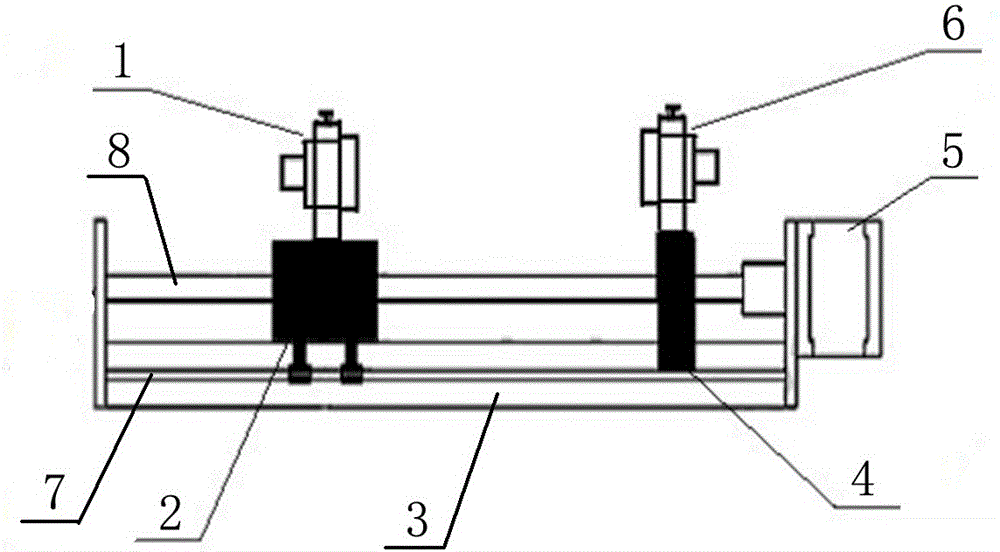
[0028] see figure 1 and figure 2 , a fully automatic sound velocity measuring instrument, comprising a host computer controller, a signal generation system, a sound wave receiver displacement system and a data acquisition system, the inside of the host computer controller is provided with sound velocity measurement software in a C language programming mode; the signal The generating system includes a signal generator, and the signal generator is connected with the sound wave transmitter 6; the data acquisition system includes the sound wave receiver 1, and the sound wave receiver 1 is connected with an effective value detection module, and the effective The value detection module is connected with a data acquisition card, and the data acquisition card is connected with the host computer controller through a bidirectional converter; the acoustic wave receiver displacement system includes a single-chip microcomputer, a stepping motor driver and an acoustic wave receiver displac...


PUM


Abstract

The invention discloses a fully automatic sound velocity measuring instrument. An upper computer controller is taken as the core, a voltage effective value of a sound wave receiver are acquired through a data acquisition card, a stepper motor is driven to rotate through a single-chip microcomputer and a stepper motor driver, and a lead screw is driven to rotate by using the stepper motor so that the sound wave receiver can move so as to achieve automatic measurement of the output voltage effective value of the sound wave receiver at each point in a stationary wave field. Meanwhile, after the data are obtained, the output voltage effective values of the sound wave receiver at different locations are drawn into a two-dimensional cartesian coordinate graph, so as to obtain an intuitive relational graph of the aviation in the output voltage effective values of the sound wave receiver and locations of the sound wave receiver, and after the test, the data and graphs can be stored and outputted. Compared with the prior art, the invention eliminates the effect of return errors, achieves automation of the movement and data collection of the sound wave receiver, improves the measuring efficiency, and can save and output data.

Description

technical field [0001] The invention relates to the field of teaching experiment instruments, in particular to a fully automatic sound velocity measuring instrument and a measuring method thereof. Background technique [0002] At present, there are two main methods of sound velocity measurement in university physics experiments: standing wave method (also called resonance interference method) and phase comparison method. The experimental instruments used in these two methods are: signal generator, oscilloscope, and acoustic wave transmitter , Acoustic receiver and screw displacement system with an accuracy of 0.01mm, etc. The measurement principle of the standing wave method is: according to the wave theory, the plane sound wave emitted by the sound wave transmitter passes through the medium to the sound wave receiver. The end faces reflect back and forth and superimpose to form a standing wave. At this time, the distance between two adjacent nodes (or antinodes) is equal t...

Claims


Application Information

Patent Timeline
Patent Type & Authority Applications(China)
IPC IPC(8): G01H5/00G09B23/14
Inventor 石明吉曹原刘峰丁淑娟王璐子
Owner NANYANG INST OF TECH
Why Eureka
Try Eureka