Method for detecting copper ions with 1,4-dyhydroxy-9,10-anthraquinone salicylic hydrazide compound as fluorescence probe
A technology of anthraquinone salicylic hydrazide and fluorescent probe, applied in the field of optical analysis and detection, can solve the problems of increasing immune function and the like
- Summary
- Abstract
- Description
- Claims
- Application Information
AI Technical Summary
Problems solved by technology
Method used
Image
Examples
Embodiment 1
[0026] Optimization of Experimental Conditions
[0027] 1. Selection of probe molecule concentration
[0028] Increasing the concentration of probe molecules can increase the absorbance and fluorescence intensity, which is beneficial to improve the selectivity of the determination of metal ions and the linear range of the standard curve. However, when the concentration is too high, the fluorescence intensity of the blank will also increase with the increase of the probe molecule concentration, and if the concentration is too low, it will be difficult to detect the fluorescence absorption peak after quenching by adding ions. Considering the sensitivity and linear range of the method, The concentration of the probe was chosen to be 1.0×10 -5 mol / L.
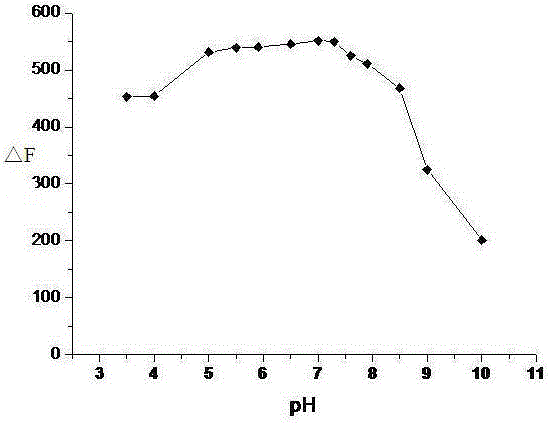
[0029] 2. Selection of buffer solution
[0030] Add 1mL phosphate buffer solution to a 10mL colorimetric tube, then add 0.01mL molar concentration of 1.0×10 -3 mol / L of 1,4-dihydroxy-9,10-anthraquinone salicylhydrazide in DMF-H ...
Embodiment 2
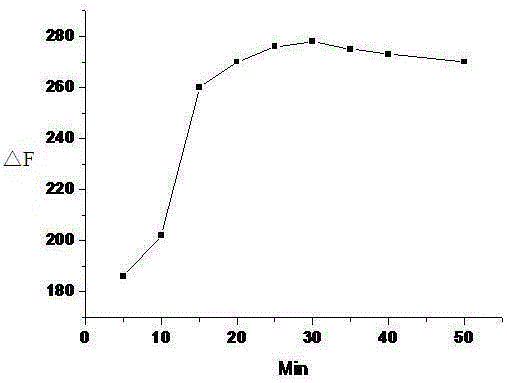
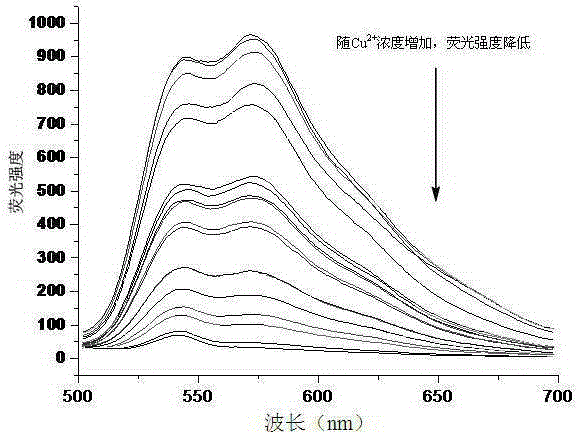
[0037] Add 1mL of phosphate buffer solution to several 10mL colorimetric tubes, and then add 0.01mL of the molar concentration to 1.0×10 -3 mol / L of 1,4-dihydroxy-9,10-anthraquinone salicylic hydrazide in DMF-H 2 O (DMF and H 2 The volume ratio of O is 1:99) solution, and then add copper ion solutions with different concentrations ([Cu 2+ ](×10 -6mol / L): 2, 2.5, 3.0, 3.5, 4, 4.5, 5, 5.5, 6, 8, 10), dilute to 10mL with deionized water, shake well and mix for 25min, measure the fluorescence intensity of each solution, Fluorescence intensity measurement conditions are excitation slit 10nm, emission slit 10nm, excitation wavelength 498nm, emission wavelength 575nm, and the solution changes from light red to blue purple during the measurement process. image 3 It is the fluorescence absorption spectrum diagram of copper ion solutions with different concentrations. It can be seen from the figure that the fluorescence absorption peak at 498nm shifts red and a new fluorescence abso...
Embodiment 3
[0041] Add 1mL of phosphate buffer solution to several 10mL colorimetric tubes, and then add 0.01mL of the molar concentration to 1.0×10 -3 mol / L of 1,4-dihydroxy-9,10-anthraquinone salicylic hydrazide in DMF-H 2 O solution, and then add the molar concentration of 1.0×10 -3 mol / L metal ion standard solution, dilute to 10mL with deionized water, shake well and measure the fluorescence intensity of each solution (such as Figure 5 ), the results show that when various metal ions of the same concentration interact with the probe molecule EXZ, only Cu 2+ The addition of the mixed system can reduce the fluorescence intensity at 575nm and cause fluorescence quenching, but when other metal ions interact with the probe molecules, compared with the blank sample, the fluorescence intensity does not change significantly. It shows that the probe molecule EXZ has good selectivity in recognizing copper ions.
PUM
 Abstract
Description
Claims
Application Information
 - R&D
- Intellectual Property
- Life Sciences
- Materials
- Tech Scout
- Unparalleled Data Quality
- Higher Quality Content
- 60% Fewer Hallucinations
Browse by: Latest US Patents, China's latest patents, Technical Efficacy Thesaurus, Application Domain, Technology Topic, Popular Technical Reports.
© 2025 PatSnap. All rights reserved.Legal|Privacy policy|Modern Slavery Act Transparency Statement|Sitemap|About US| Contact US: help@patsnap.com


