Establishment method of intelligent piezoelectric aggregate mechanical model
A piezoelectric intelligent aggregate and mechanical model technology, which is applied in the measurement, scientific instruments, and analytical materials of piezoelectric devices, etc. Good compression resistance, ensuring service life and maintaining stability
- Summary
- Abstract
- Description
- Claims
- Application Information
AI Technical Summary
Problems solved by technology
Method used
Image
Examples
Embodiment 1
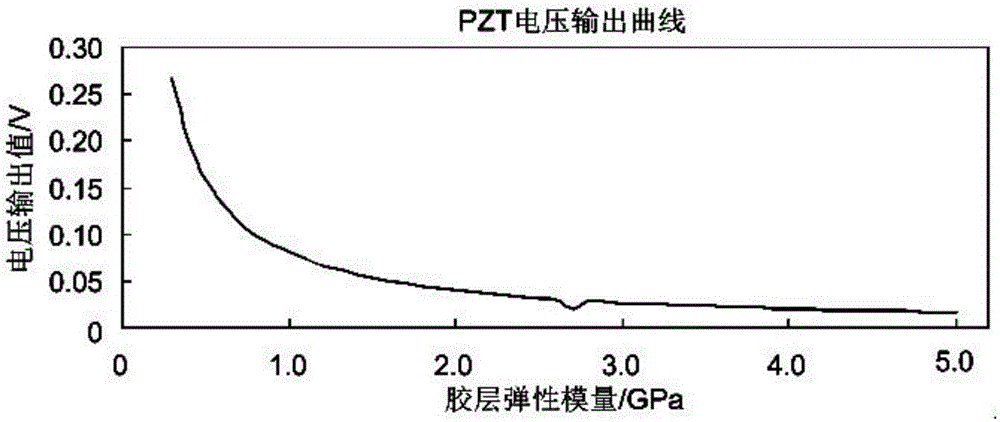
[0094] The surface of the PZT sheet is evenly coated with a waterproof adhesive layer with a thickness of 1mm, and embedded in concrete to make a piezoelectric smart aggregate. When subjected to a force amplitude of 200N and 3000Hz, the voltage output value of the PZT sensor can be obtained as
[0095] u S =0.266V
[0096] The piezoelectric ceramics embedded in concrete under the influence of different adhesive layers, the sensor voltage output curve, such as figure 1 shown.
Embodiment 2
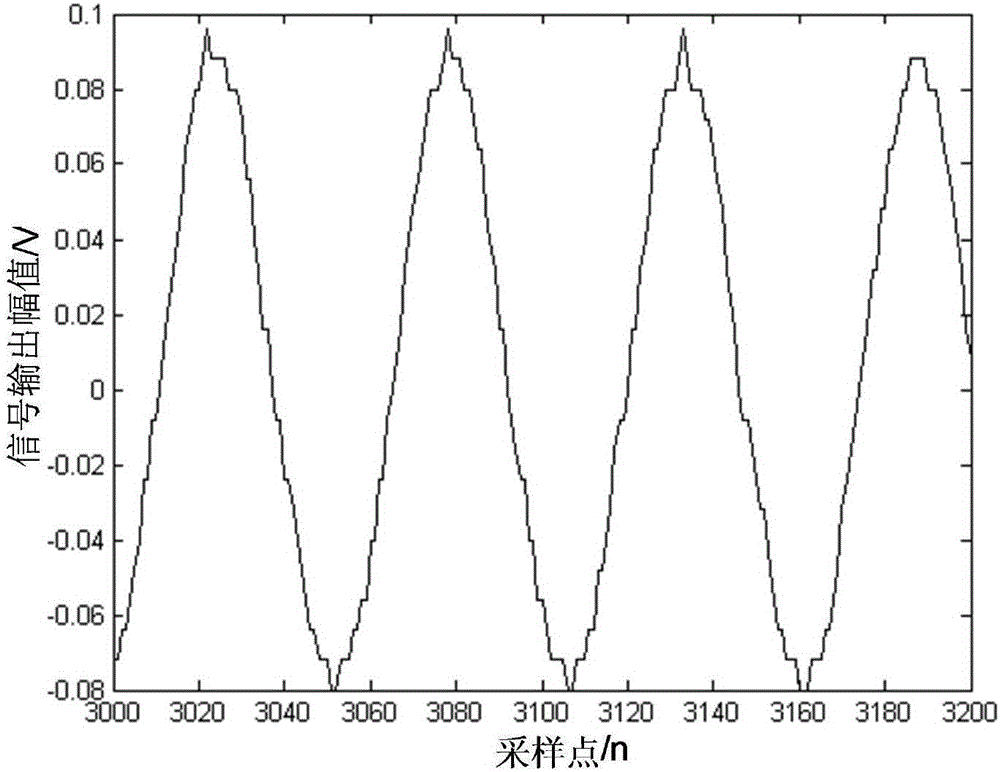
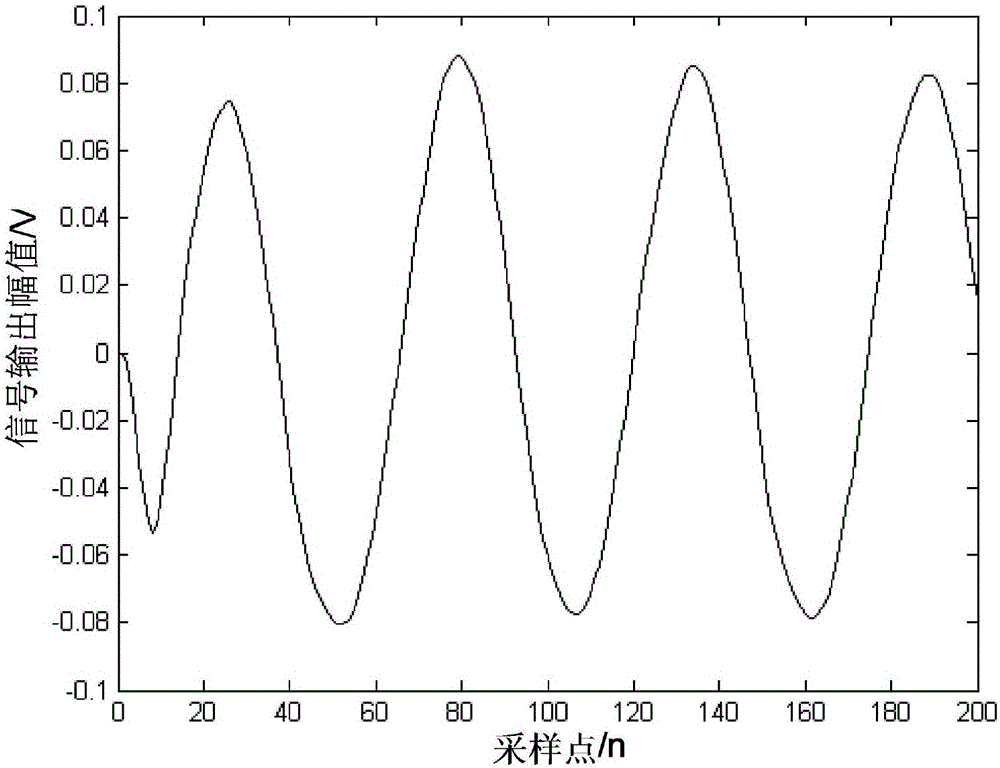
[0098] First, the PZT sensor is pasted on the surface of the aluminum sheet, and then the pasted and embedded PZT sensors are fixed on the fixture, and the sinusoidal load excitation is applied through the MTp driver, so that the sensor receives signals and collects data through a digital oscilloscope. Taking the φ20PZT single chip as an example, the Butterworth bandpass filter is used for data processing. Such as figure 2 and image 3 As shown, it is the signal before filtering and after filtering that the φ20PZT single chip is intercepted under the action of the driving voltage of 2V and the frequency of l00Hz.
[0099] The filtered signal is obviously better than the signal before filtering, and the calculated voltage amplitude before filtering is 0.09634V, the voltage amplitude after filtering is 0.08627V, the minimum amplitude is 0.08465V, the peak-to-peak value is 0.1709V, and the error is
[0100]
[0101] This also proves that the established PZT sensing mechanic...
Embodiment 3
[0103]According to the established PZT driving model, the numerical simulation analysis is carried out on the end displacement-time history curve and the stress-strain constitutive relationship distribution curve under the condition of free vibration of PZT. Among them, the parameters of PZT are shown in the table below.
[0104]
[0105]
[0106] Select the simple harmonic alternating excitation voltage signal frequency f = 1.54Hz
[0107] That is, U=U 0 sin(ωt)=300sin(2π×1.54)t
[0108] Among them, f is the first-order natural frequency of the cantilever beam in the numerical simulation, and the time-history curve of the simulated input electrical signal, as shown in Figure 4 and Figure 5 shown.
[0109] Select the position of the maximum value of the end displacement for analysis, take the time history as Is, draw the end displacement-time history curve, then x=l L The displacement-time history curve of PZT free vibration at / 2, such as Figure 6 As shown, th...
PUM
 Abstract
Description
Claims
Application Information
 - R&D
- Intellectual Property
- Life Sciences
- Materials
- Tech Scout
- Unparalleled Data Quality
- Higher Quality Content
- 60% Fewer Hallucinations
Browse by: Latest US Patents, China's latest patents, Technical Efficacy Thesaurus, Application Domain, Technology Topic, Popular Technical Reports.
© 2025 PatSnap. All rights reserved.Legal|Privacy policy|Modern Slavery Act Transparency Statement|Sitemap|About US| Contact US: help@patsnap.com


