Fluorescence imaging flow cytometry with enhanced image resolution

A flow cytometry, imaging technology, applied in image analysis, image enhancement, fluorescence/phosphorescence, etc., which can solve the problems of insufficient flexibility for sample analysis and difficulty in obtaining blur-free images.

Active Publication Date: 2019-03-15
BD BIOSCI
View PDF47 Cites 3 Cited by
  • Summary
  • Abstract
  • Description
  • Claims
  • Application Information

AI Technical Summary

Problems solved by technology

[0005] However, in conventional fluorescence-based flow cytometry, acquiring blur-free images of high-velocity flowing cells or other fast phenomena such as sub-millisecond biochemical dynamics can be challenging
In particular, the weak optical emission of many fluorophore...

Method used


Image

  • Fluorescence imaging flow cytometry with enhanced image resolution
  • Fluorescence imaging flow cytometry with enhanced image resolution
  • Fluorescence imaging flow cytometry with enhanced image resolution

Examples


Embodiment 1

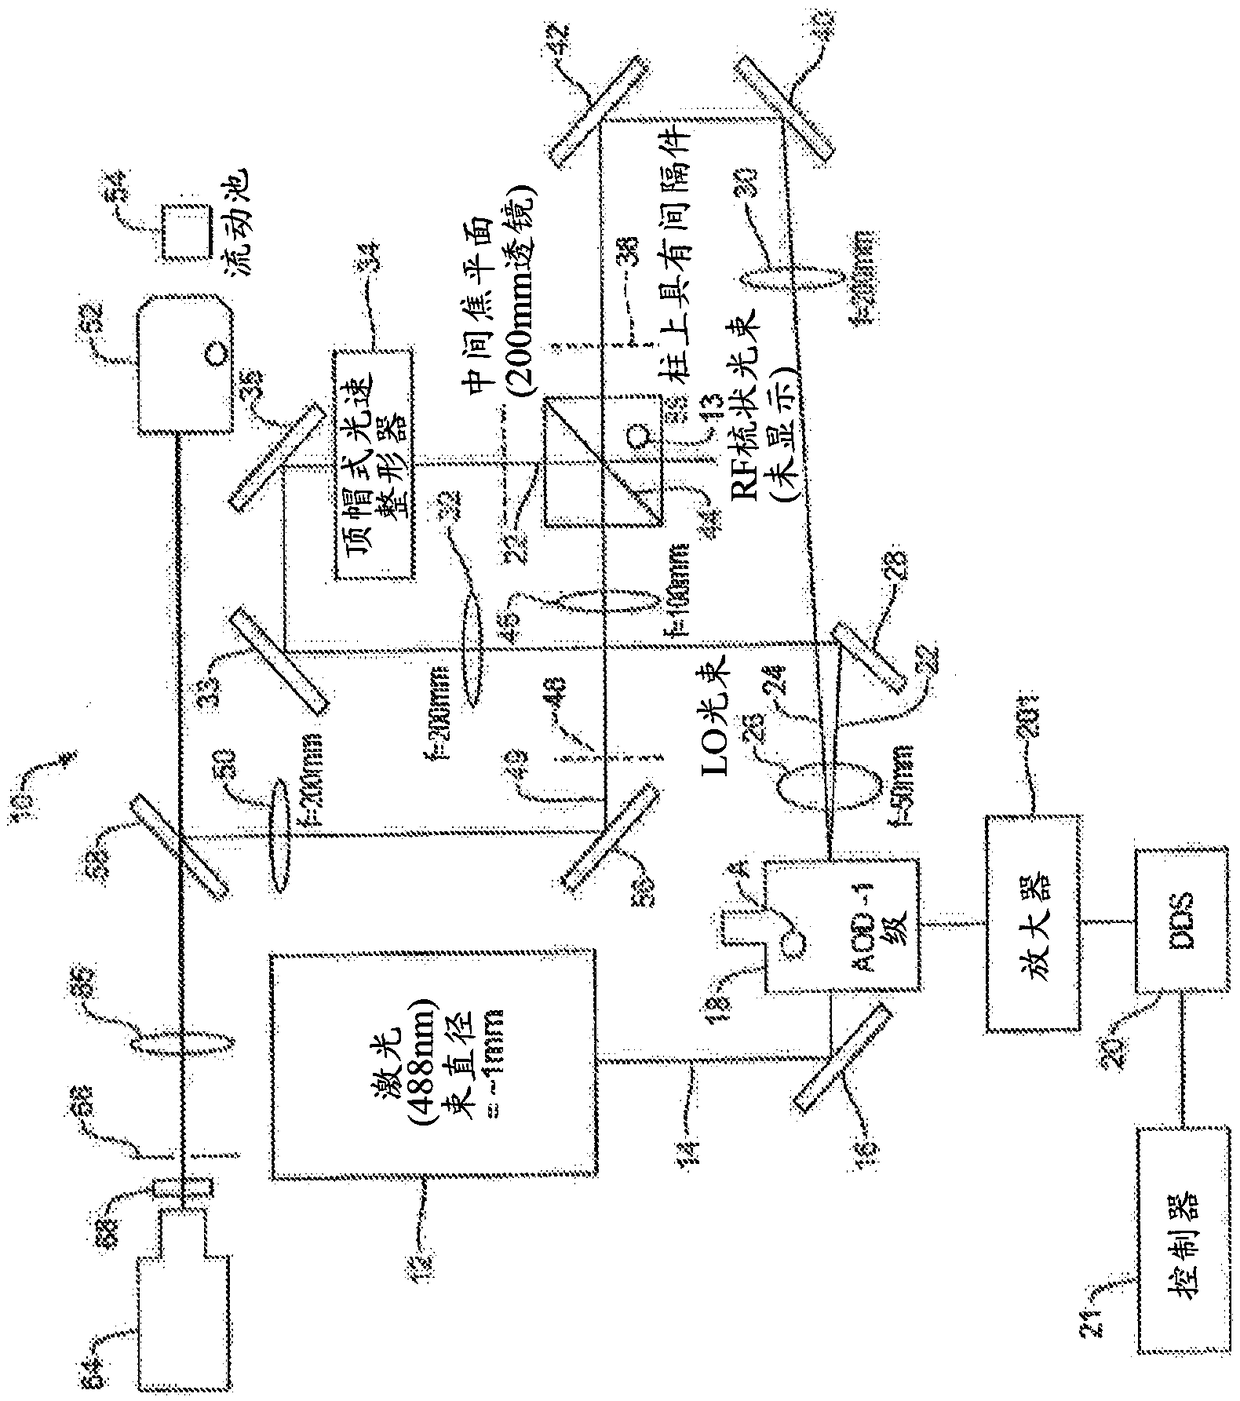
[0173] A system was used to measure fluorescent radiation from polystyrene beads dyed with 8 discrete levels of fluorochromes similar to the above in conjunction with figure 1 described with a combination similar to Figure 9A The detection system of the described detection system, the fluorescent dye is sold under the trade name RCP-30-5A by Spherotech Inc. of Lake Forest, IL. The system was also used to generate brightfield and darkfield images in the manner described above.

[0174] Figure 16A is a scatter plot of dark field intensity versus bright field intensity. Use a rectangular portion of the graph as a gate to generate Figure 16B , 16C and the data in 16D, which contained approximately 32% of all events measured (a total of 50,000 events detected). Figure 16B A scatter plot of red fluorescence (PI) versus green fluorescence (FITC) emitted by each particle is shown. The figure clearly shows 8 populations with different brightness levels. Figure 16C and Fig...

Embodiment 2

[0176] FIRE, brightfield, and darkfield images of fixed peripheral blood leukocytes stained with CD45-FITC and propidium iodide were obtained using a system similar to the above combined figure 1 described with a combination similar to the above Figure 9A Discuss the detection system of the detection system. Samples also contained a portion of live HeLa cells stained with Calcein-AM. During data acquisition, cells were flowed through the flow cell at a rate of 0.5 m / s.

[0177] Figure 17A Images shown in are from top to bottom: brightfield, overlay of CD45-FITC and propidium iodide fluorescence channels, brightfield, darkfield, CD45-FITC and PI channel fluorescence. No compensation is applied, and all images are automatically scaled for viewing. The cells numbered 2, 3, 5, 8, 9, 12, 17, 20 and 21 are HeLa cells (group B), and the others are leukocytes (group A).

[0178] Figure 17B is a scatter plot where population A represents leukocytes and population B represents ...

Embodiment 3

[0180] FIRE, brightfield, and darkfield images of fixed peripheral blood leukocytes stained with CD45-FITC and propidium iodide were obtained using a system similar to the above combined figure 1 described with a combination similar to the above Figure 9A Discuss the detection system of the detection system. Samples were spiked into fixed aliquots of MCF-7 cells stained with anti-EpCAM-FITC and propidium iodide (PI). During data acquisition, cells were flowed through the flow cell at a rate of 0.5 m / s.

[0181] Figure 18A Images shown in are from top to bottom: brightfield, overlay of FITC and PI channel fluorescence, brightfield, darkfield, FITC and PI fluorescence. In the leukocyte population, green fluorescence is an artifact of fluorescence leakage from PI staining. All images are automatically scaled in brightness for viewing, therefore, leukocytes appear to exhibit FITC fluorescence, but this is a signal of a small amount of fluorescence leaking in from PI. Cells ...


PUM


Abstract

In one aspect, a system for performing flow cytometry is disclosed, which comprises a laser for generating laser radiation for illuminating a sample, at least one detector for detecting at least a portion of a radiation emanating from the sample in response to said illumination so as to generate a temporal signal corresponding to said detected radiation, and an analysis module for receiving said temporal signal and performing a statistical analysis of said signal based on a forward model to reconstruct an image of said sample.

Description

[0001] related application [0002] This application claims priority to Provisional Patent Application No. 62 / 335,359, filed May 12, 2016, entitled "Fluorescence Imaging Flow Cytometry With Enhanced Image Resolution," which is incorporated herein by reference in its entirety. This application is also related to Utility Model Patent Application No. 15 / 461,124, filed March 17, 2017, entitled "Cell Sorting Using A High Throughput Fluorescence Flow Cytometer," which is incorporated herein by reference in its entirety. Background technique [0003] The present invention relates generally to devices and methods for fluorescence analysis of samples, and more particularly to devices and methods for fluorescence-based flow cytometry. [0004] Fluorescence imaging has a variety of biomedical applications, for example, in obtaining information about the molecular composition of biological samples. In biomedical flow cytometry, fluorescent radiation emitted by exogenous and / or endogenous...

Claims


Application Information

Patent Timeline
IPC IPC(8): G01N15/14G06T7/521G01N21/53G01N21/64
CPCG01N2015/144G01N2201/10G01N2201/129G06T2207/30024G06T7/521G01N15/1429G01N15/147G01N21/6456G01N2201/12G06T7/246G01N15/1475G06T7/0012G01N2015/0065G01N2015/1006G01N2201/06113
Inventor 埃里克·迪博尔德基根·奥斯利乔纳森·林马修·巴尔
Owner BD BIOSCI
Why Eureka
Try Eureka