Eureka AIR delivers breakthrough ideas for toughest innovation challenges, trusted by R&D personnel around the world.

Function display method and system based on electric vehicle power meter

An electric vehicle and display method technology, applied in the field of driving information display, can solve the problems of inconvenient quantitative analysis of testing and verification, design and production impact, lack of sense of technology, etc. Intuitive effect

Active Publication Date: 2021-02-05
YANFENG VISTEON ELECTRONICS TECH NANJING
View PDF17 Cites 1 Cited by
  • Summary
  • Abstract
  • Description
  • Claims
  • Application Information

AI Technical Summary

Problems solved by technology

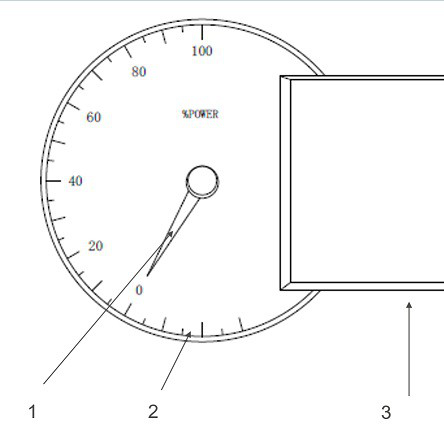
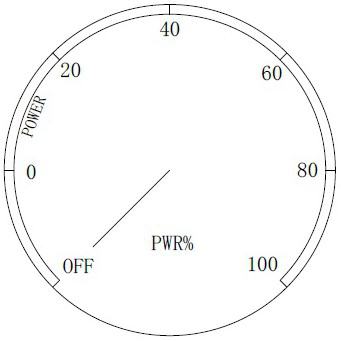
[0003] The common technical solutions include all-mechanical meters or other combination meters with mechanical dial structures or liquid crystal instrument panels, all-mechanical meters or other combination meters with mechanical dial structures, and the structural designs of various parts manufacturers are different. Power meters are different from ordinary vehicles. The speedometer and tachometer are similar, using a semi-circular or almost circular dial form. When the whole vehicle is powered on and not driving, the starting point of the power meter is at the zero point in the center, which is distinguished by the dial scale or the color of the backlight. In the energy output mode, The pointer indicates the blue area, and the scale value is 0% to 100%. When the energy is recovered, the pointer indicates the green area in the opposite direction, and there is no specific value marked. This scheme uses the structure of the traditional stepping motor, pointer and dial to indicate the header information. Because the current mainstream electric vehicles use LCD screens for indication, the display effect is single, lacks dynamics, and appears to be insufficient in technology. Most of the strategies used by car companies for model development are platform iterations, that is, based on the basis of fuel vehicles, hybrid Iteration of remodeling of electric vehicles and pure electric vehicles. Due to the differences in the display elements and dial styles of electric vehicles and fuel vehicles, this solution is more difficult to iterate. It relies on the hardware structure to realize the meter function. The display method is fixed and the possibility of change is small. If you want to change the style of the relevant scales and indicator lights, you need to change many parts such as the shell, circuit board, and dial, which will have a great impact on design and production.
[0004] Another common technical solution is that the liquid crystal instrument panel adopts a large-size LCD screen to display power, vehicle speed and other gauges through the display mode of the virtual dial, and controls the backlight of the TFT screen through software to display different color pictures, and the display form adopts semicircle or circle , similar to mechanical instruments, hybrid and electric vehicles usually use a separate energy flow interface to visually display the output state of energy. The instrument technology has developed into a full LCD screen. In order to display intuitively and reduce learning costs, the design intention remains in the shape of a dial. The display lacks novelty, or for the sake of simplifying the information, the numerical display method is directly used. The power value usually only has percentage information. When energy is recovered, the percentage information is not displayed. The power value refresh frequency is too fast, and the specific power value display is not intuitive. , test verification is inconvenient for quantitative analysis

Method used


Image

  • Function display method and system based on electric vehicle power meter
  • Function display method and system based on electric vehicle power meter
  • Function display method and system based on electric vehicle power meter

Examples


Embodiment

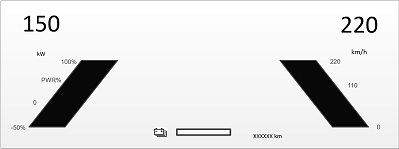
[0031] Example: According to Figure 5 As shown, the main interface module of the display system includes the output power meter on the left side of the central information display area, the speedometer 10 on the right side, the upper gear position, time, temperature, the lower total mileage, cruising range and remaining battery power 8, the main interface The value on the left indicates the output and recovery power value 4, the lower model indicates the power output and recovery percentage model 5, according to image 3 As shown, when the energy is output, the power meter value is blue, and the power output percentage is 0 to 100%, which is displayed as a blue dynamic model with a blur effect, according to Figure 4 As shown, when energy is recovered, the value of power meter 6 turns green, and the percentage is from -50% to 0. The part of energy recovery is represented by the green energy bar model, and the remaining part is still represented by the blue model. The speedome...


PUM


Abstract

The invention discloses a function display method and system based on an electric vehicle power meter, and relates to the technical field of driving information display. The method adopts a display mode of numerical indication and a percentage model, a main interface module comprises a central information display area, an output power meter and a speedometer, interface display elements are symmetrical, and the recognition degree is high; the main interface is high in information replaceability and suitable for sharing a platform with a fuel vehicle, the platform borrowing degree is high, energy recovery is reflected through a green model and fonts, an energy flow interface does not need to be repeatedly displayed any more, the main interface is low in use rate, the energy flow interface isomitted, the information providing mode can be optimized, the interaction level of user experience (UE) is reduced, the power meter and the motor power percentage display mode are visual and novel, and based on output power and power percentage signals, the signals can be displayed in the main display interface in an energy quantification mode, and convenience is provided for data checking in theproduction and after-sales process.

Description

technical field [0001] The invention relates to the technical field of driving information display, in particular to a function display method and system based on an electric vehicle power meter. Background technique [0002] With the continuous development of the automobile industry and environmental protection requirements, the technology related to pure electric vehicles has developed rapidly, and the proportion has increased rapidly. The display methods of display information are showing a trend of diversification. For traditional car manufacturers, they are adapting to the environment of continuous development of electric vehicles and using them as a supplementary solution to fuel vehicles. From the chassis design to the design of each controller software, they are all from fuel vehicles. After improvement, new energy vehicle manufacturers of new forces are more radical. They pay more attention to the application of new technologies, especially in-vehicle display and en...

Claims


Application Information

Patent Timeline
IPC IPC(8): B60K35/00B60L58/12G06T17/00G06T11/00
CPCB60K35/00B60L58/12G06T17/00G06T11/00Y02T10/70
Inventor 孔德哲
Owner YANFENG VISTEON ELECTRONICS TECH NANJING
Why Eureka
Eureka Blog
Learn More