Preparation and application of hydrogen sulfide fluorescent probe based on isophorone-xanthene
A fluorescent probe, hydrogen sulfide technology, applied in the field of fluorescent probes
- Summary
- Abstract
- Description
- Claims
- Application Information
AI Technical Summary
Problems solved by technology
Method used
Image
Examples
Embodiment 1
[0026] Synthesis of fluorescent probes
[0027] Synthetic route such as figure 1 . DCP-OH (96mg, 0.25mmol), 2,4-dinitrofluorobenzene (46.5mg, 0.25mmol), and 0.5mL of triethylamine were added to a 100mL round-bottomed flask, and then 7mL of acetone was added to dissolve it dissolve. The reaction was stirred under reflux at 65 °C for 0.5 h. After the reaction was complete, the solvent was removed under reduced pressure. 10 mL of 5% HCl solution was added to the resulting mixture, the precipitate was filtered, washed several times with water, and then purified by recrystallization in acetone to obtain the dark green solid product DCP-HS (82 mg, yield 60%), which is the obtained product. fluorescent probes described above. 1 H NMR (400MHz, CHCl 3 )δ8.66(s,1H),8.36(d,J=8.0Hz,1H),7.16–7.08(m,3H),6.83–6.73(m,3H),2.74(d,J=8.0Hz,4H ),1.6(s,4H).1.05(m,6H). 13 C NMR (100MHz, CDCl 3 )δ 168.72, 155.44, 154.37, 153.45, 141.91, 141.72, 128.83, 122.37, 119.14, 116.22, 114.14, 113.43, ...
Embodiment 2
[0029] Fluorescent probes and H 2 S solution preparation
[0030] Preparation of probe solution: Weigh a certain amount of probe and dissolve it in dimethyl sulfoxide to make 2×10 -4 M stock solution. Add 500 μL of the spare solution of the probe into a 10 mL volumetric flask, and after constant volume with PBS buffer solution, a concentration of 1.0×10 -5 mol / L fluorescent probe solution. H 2 S was prepared at the following concentrations (1.0, 2.0, 3.0, 4.0, 5.0, 6.0, 7.0, 8.0, 9.0, 10.0 μM), respectively.
Embodiment 3
[0032] Fluorescent probes with H 2 Determination of Fluorescence Spectrum of S Effect
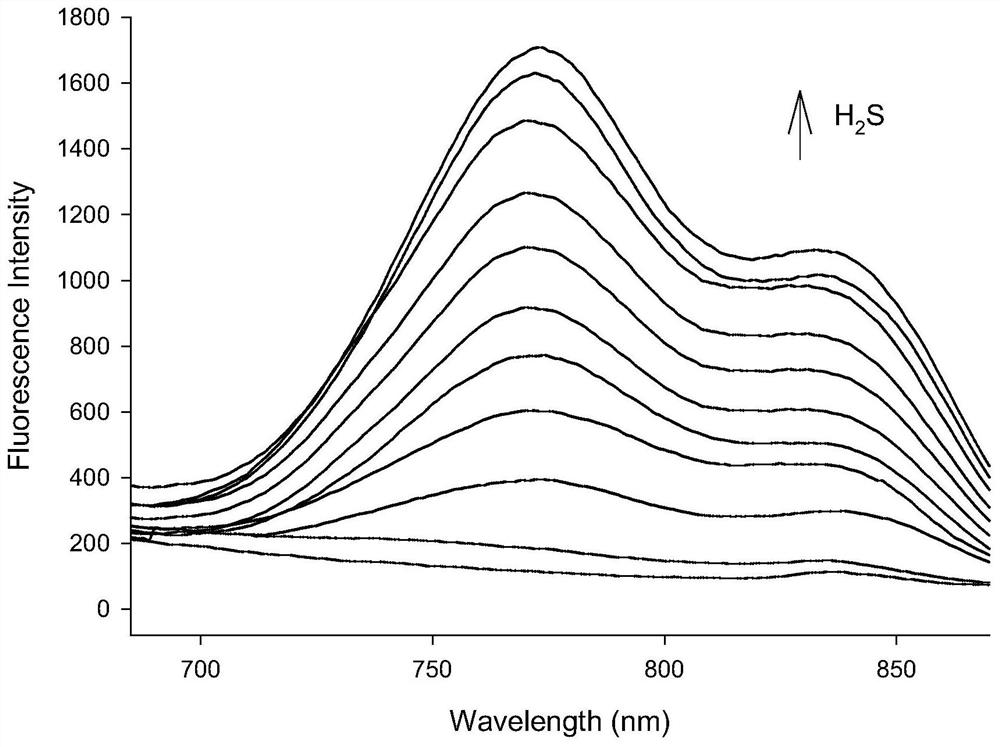
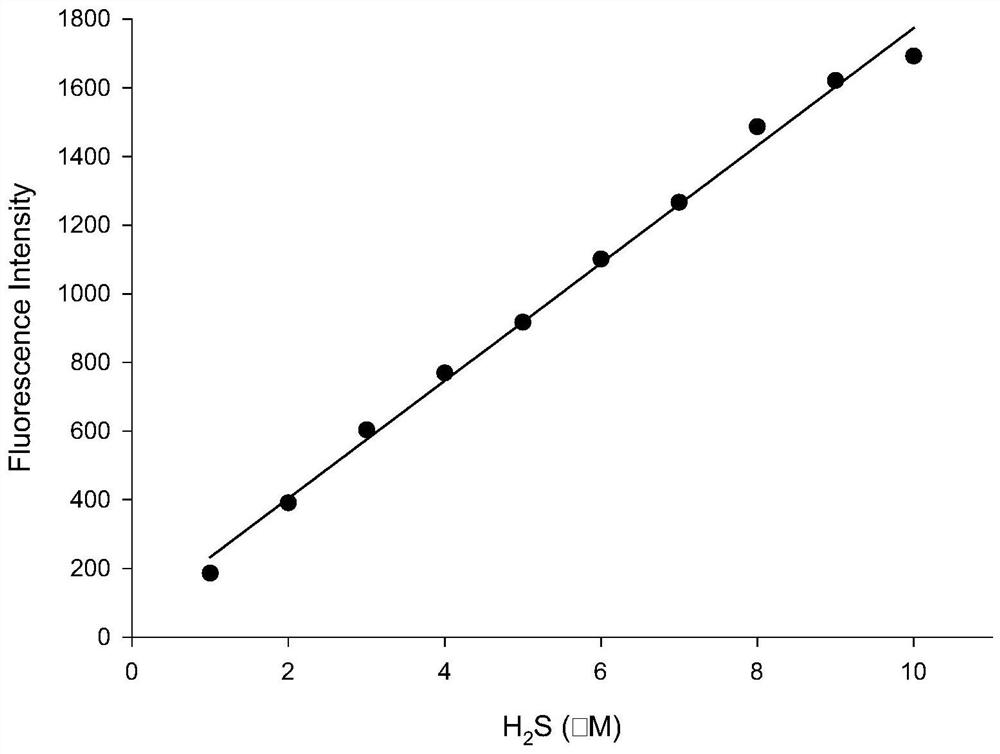
[0033] figure 2 as a fluorescent probe with H 2 The fluorescence spectrum of S interaction, the concentration of fluorescent probe is 10μM, H 2 The concentration of S was 1.0, 2.0, 3.0, 4.0, 5.0, 6.0, 7.0, 8.0, 9.0, 10.0 μM in turn. The excitation wavelength used in the experiment is 570nm, and the emission wavelength range is 590-900nm. The slit width is 10.0 nm / 10.0 nm, and the fluorescence measurement instrument used is a Hitachi F4600 fluorescence spectrophotometer. From figure 2 It can be seen that adding H 2 Before S, the probe itself has almost no emission peak due to the quenching effect of the dinitrophenyl ether group; 2 With the addition of S, the thiolysis of the dinitrophenyl ether group returns to the electron-donating hydroxyl group, and the emission peak at 770nm is greatly enhanced, and with the H 2 With the increase of S concentration, the fluorescence intensity ...
PUM
| Property | Measurement | Unit |
|---|---|---|
| width | aaaaa | aaaaa |
Abstract
Description
Claims
Application Information
 - R&D
- Intellectual Property
- Life Sciences
- Materials
- Tech Scout
- Unparalleled Data Quality
- Higher Quality Content
- 60% Fewer Hallucinations
Browse by: Latest US Patents, China's latest patents, Technical Efficacy Thesaurus, Application Domain, Technology Topic, Popular Technical Reports.
© 2025 PatSnap. All rights reserved.Legal|Privacy policy|Modern Slavery Act Transparency Statement|Sitemap|About US| Contact US: help@patsnap.com


