Method and apparatus for determining interstitial volume

A volume and gap technology, applied in the field of diagnostic tools for the treatment of diseases, can solve problems such as difficult dry weight of patients

Pending Publication Date: 2021-07-23
PHARMACOPHOTONICS INC
View PDF1 Cites 0 Cited by
  • Summary
  • Abstract
  • Description
  • Claims
  • Application Information

AI Technical Summary

Problems solved by technology

[0005] Determining dry weight in patients with diseases such as congestive heart failure, hypertension, and chronic kidney disease has been difficult because there is no commercial and practical way to determine interstitial volume in patients

Method used


Image

  • Method and apparatus for determining interstitial volume
  • Method and apparatus for determining interstitial volume
  • Method and apparatus for determining interstitial volume

Examples


example 1

[0122] Example 1: Method for generating a calibration curve

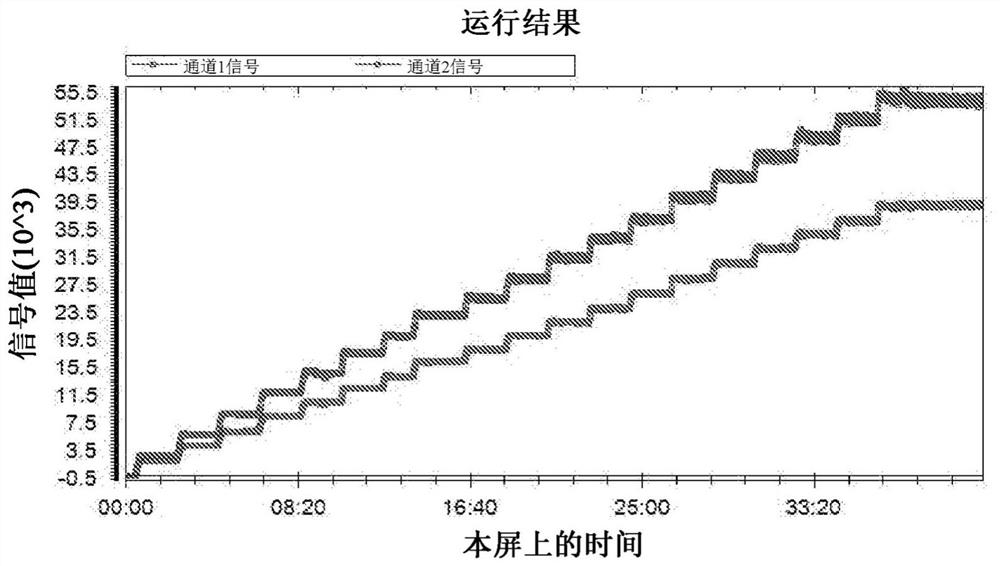
[0123] 1. Run a stepwise dose blood test set on a whole blood sample containing two fluorescent markers, each with its different emission wavelength. An example of the result is in figure 1 , where the upper curve represents the first emission signal from the first fluorescent marker or label recorded in channel 1 as the channel 1 signal and the second emission signal from the second fluorescent marker or label recorded in channel 2. The transmit signal is represented as a channel 2 signal. As previously discussed, the step-dose blood test set can also be generated using one static marker with two fluorescent labels, each with its different emission wavelength. Hereinafter, each fluorescent marker or each fluorescent label may be referred to as a "fluorescent component".

[0124] 2. Calculate the average signal level of the "flat" or stable fraction of each dose step for each fluorescent component.

[0125] 3. B...

example 2

[0131] Example 2: Method for generating a species-specific hematocrit (HCT) calibration curve

[0132] 1. Run a blood test with the single-dose method. Using the known blood volume (V t ) and known blood HCT (H calib ), calculate the volume of saline required for the test (V S ).

[0133] V t –V t h calib =V S (4)

[0134] 2. Blood and saline are administered in equal amounts from the same VFI vial.

[0135] 3. Remove a predetermined volume of blood from the test set and discard. The same volume of dosing saline as the previously removed blood was injected back into the test set. This swap will maintain the concentration of each component as well as the total volume of the test set, but change the ratio of distribution volume to HCT. Repeat this step multiple times to generate multiple data points at which the volume of distribution and HCT ratio vary.

[0136] 4. Allow each new point to stabilize before generating a new point. A new HCT is calculated at each sta...

example 3

[0150] Example 3: Methods for determining various biometric indicators

[0151] When running the test on a subject, the "batch" of the VFI must be known, since the signal calibration and HCT calibration curves used for interpretation must be based on the same "batch" of VFI given to the subject.

[0152] 1. From Figure 5 The test data sample extraction T 0 The raw ratio at (R T0 ) and average stable component 2 (FD003) signal level (S avg ). Figure 5 The lower curve in the figure represents the channel 1 signal, while the upper curve represents the channel 2 signal.

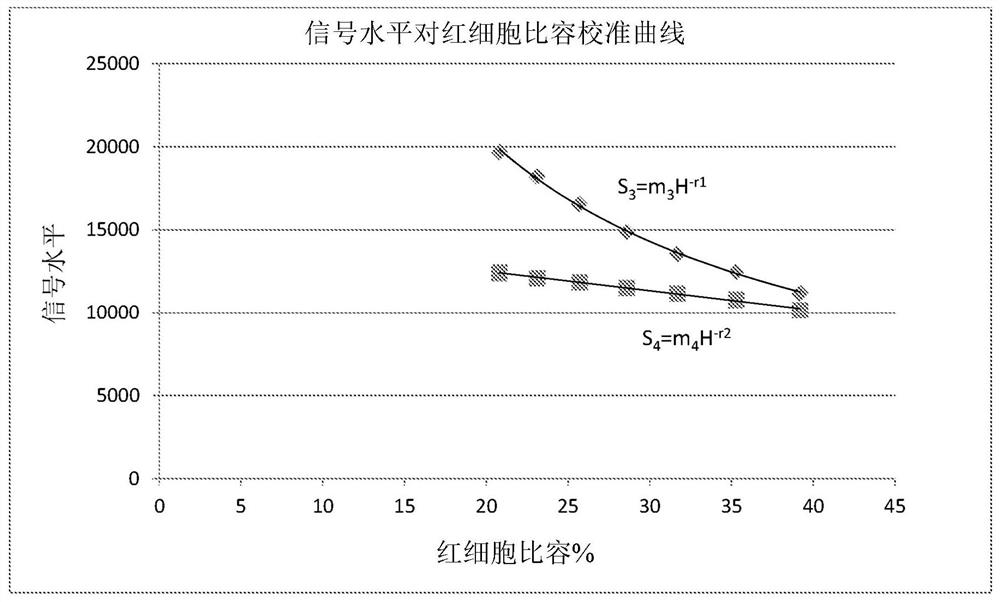
[0153] 2. Use T 0 The raw ratio at (R T0 ), the subject's apparent HCT was calculated from the ratio versus HCT calibration curve.

[0154] R T0 =KH -q (10)

[0155] H=H app (11)

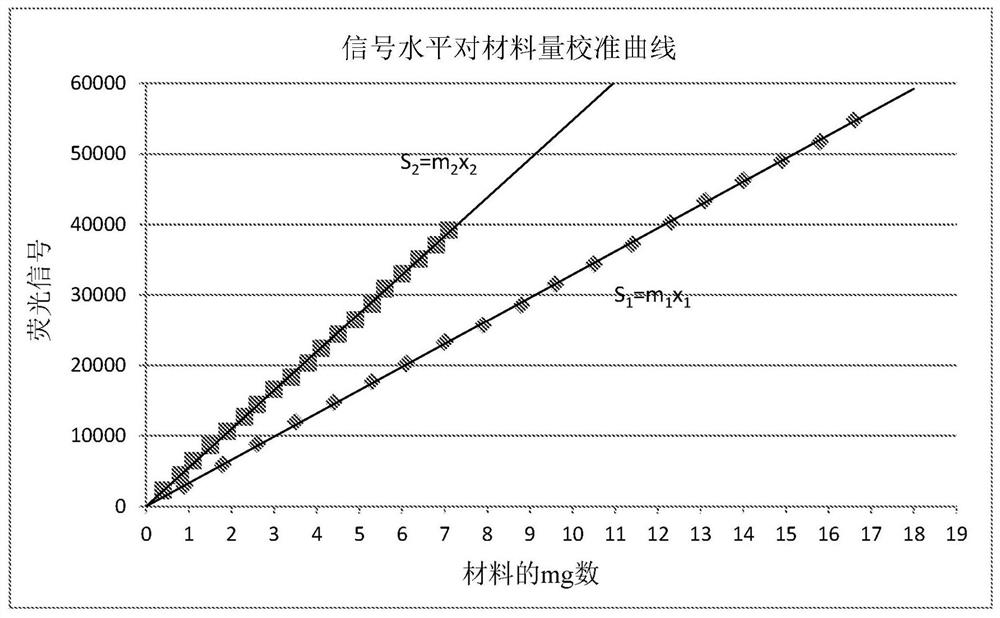
[0156] 3. Using the calculated apparent HCT and signal level versus material amount calibration curve; calculate the correction amount C and apply it to the mean signal level components.

[0157] According to Equation ...


PUM


Abstract

A method and system for selecting a treatment for a subject based on a value for the interstitial space volume of the subject utilizes plurality of sample data values representing concentrations of small and large markers in plurality of blood samples over time. The sample concentrations are utilized to predict a hypothetical peak concentration of the small marker prior to the dissipation of the markers during the test period. This hypothetical peak concentration and other sample values are utilized with either a bi-exponential or tri-exponential decay curve fitting algorithm to define a decay curve, the curve characteristics of which are then utilized to calculate values for glomerular filtration rate, a leakage rate of the small marker into interstitial space, and finally a value for the interstitial volume. The determined value for the interstitial volume can then be compared with number thresholds and decisions made for recommended therapy for the subject, if desired.

Description

technical field [0001] The present disclosure relates at least in part to methods of measuring biometric indicators in mammalian subjects, and more particularly to systems and techniques for measuring the volume of interstitial spaces as a diagnostic tool for treating disease. Background technique [0002] Biometric indicators are valuable tools used by medical practitioners to aid patient diagnosis, and their ability to determine appropriate medical procedures is often limited by the acquisition of rapid and accurate quantitative biometric information. Some common biometrics used by medical practitioners include core body temperature, blood pressure, heart and respiratory rates, blood oxygenation and hematocrit, glomerular filtration rate ("GFR"), and others. Although medical practitioners may prefer to evaluate multiple biometric indicators before deciding on a specific treatment, a patient's condition may worsen faster than the indicators can be evaluated. In these situa...

Claims


Application Information

Patent Timeline
Patent Type & Authority Applications(China)
IPC IPC(8): A61B5/145A61B5/20
CPCA61B5/0071A61B5/201A61B5/4881G16H50/20G16H10/00A61K45/06G01N33/582G01N33/6893G01N33/70G01N2800/347G01N2800/50G01N2800/52G01N2800/56
Inventor 丹尼尔·J·迈尔
Owner PHARMACOPHOTONICS INC
Why Eureka
Try Eureka