

Electronic probe analysis method for testing trace elements Na, K, P, S and Ni of lunar glass beads
A trace element and electron probe technology, applied in the field of lunar glass bead sample monitoring, can solve problems such as electron beam burns, damage, glass without crystal structure, etc., and achieve the effect of improving accuracy and precision
- Summary
- Abstract
- Description
- Claims
- Application Information
AI Technical Summary
Problems solved by technology
Method used
Image

Examples
Embodiment 1
[0093] (1) Sample preparation
[0094] The lunar glass bead moon rock (NWA13426) was used as a target, and the backscattered image was observed under a scanning electron microscope to determine the area to be analyzed.
[0095] (2) Select the appropriate glass standard sample
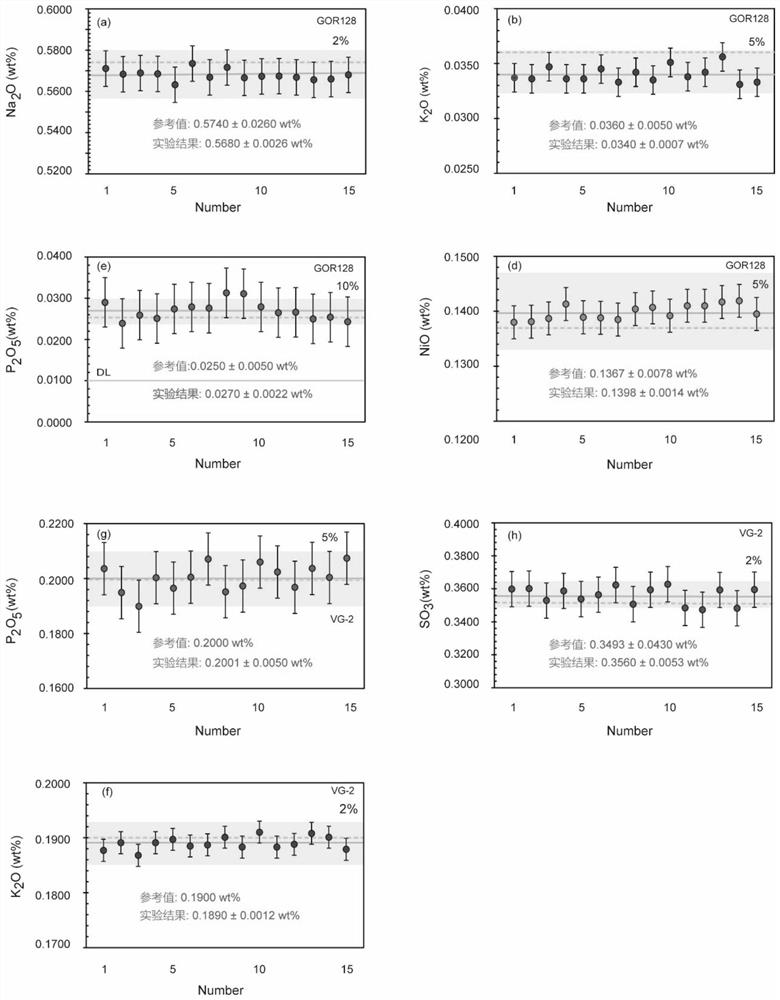
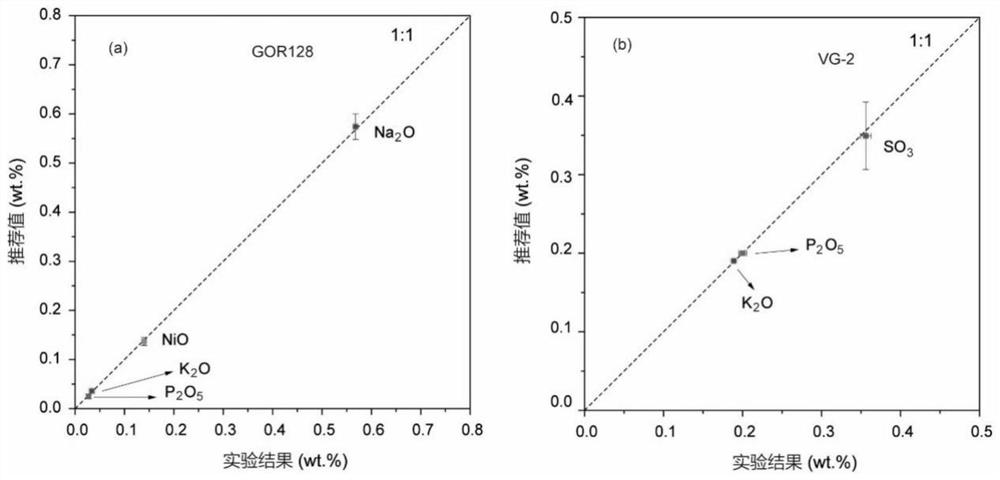
[0096] The glass standard samples are the standard samples of Koma tempered glass (MPI-DING-GOR128) and the standard samples of basaltic glass (VG-2, NMNH 111240-52).
[0097] (3) Determine the characteristic X-rays of the test of Na, K, P, S and Ni elements in the glass standard sample
[0098] According to the characteristic X-ray properties of each element, the characteristic X-ray with the highest intensity, the largest peak-to-background ratio and fewer interference peaks is selected as the characteristic X-ray of the element to be measured.
[0099] The characteristic X-rays of the test of Na, K, P, S and Ni in the glass standard sample GOR128 are all their respective (Kα) characteristic X-rays....
Embodiment 2
[0140] In step (4), the test voltage is 15kV, and other steps are the same as in Example 1.
Embodiment 3
[0142] In step (4), the test voltage is 20kV, and other steps are the same as in Example 1.
[0143] The influence of different test voltages on the trajectory of electrons in the GOR128 glass standard sample is as follows: Figure 5 As shown in (a), the φ(ρz) curve of Na and the φ(ρz) curve of Ni in GOR128 glass are as follows Figure 5 (b), (c) shown.
[0144] pass Figure 5 It can be seen that the size of the electron interaction region increases when higher accelerating voltages are used. Glass density is 2.5g / cm 3 , calculate 1*10 6 electron trajectory. 1*10 4 Electron trajectories are used to display images. At voltages of 15, 20 and 25 kV, the depth of the interaction zone is ~2.4 μm, ~4 μm and ~6.4 μm ( Figure 5 a). Furthermore, the depth of X-ray generation increases when using higher accelerating voltages. Using an accelerating voltage of 15 kV, most of the Na(Kα) X-rays were generated from a sample depth of 2 μm, and the Ni(Kα) X-rays were generated from ...
PUM
 Abstract
Description
Claims
Application Information