Power distribution network abnormity identification method based on data driving

An anomaly identification, data-driven technology, applied in electrical digital data processing, digital data information retrieval, special data processing application, etc. The effect of recognition accuracy and fast calculation speed

Pending Publication Date: 2022-03-01
广西电网有限责任公司桂林供电局
View PDF0 Cites 1 Cited by
  • Summary
  • Abstract
  • Description
  • Claims
  • Application Information

AI Technical Summary

Problems solved by technology

The traditional manual monitoring mode cannot achieve comprehensive analysis, diagnosis and status warning of the power grid, and the operation and maintenance personnel lack the overall understanding of the huge power system, and cannot grasp the abnormal operation status of the power grid in a timely manner and take correct measures to control it, which will further develop the fault , obviously cannot meet the operation requirements of the new generation power grid
[0003] The traditional distribution network pair anomaly identification is mainly based on the traditional mathematical model and physical mechanism model. With th

Method used


Image

  • Power distribution network abnormity identification method based on data driving
  • Power distribution network abnormity identification method based on data driving
  • Power distribution network abnormity identification method based on data driving

Examples


Embodiment 1

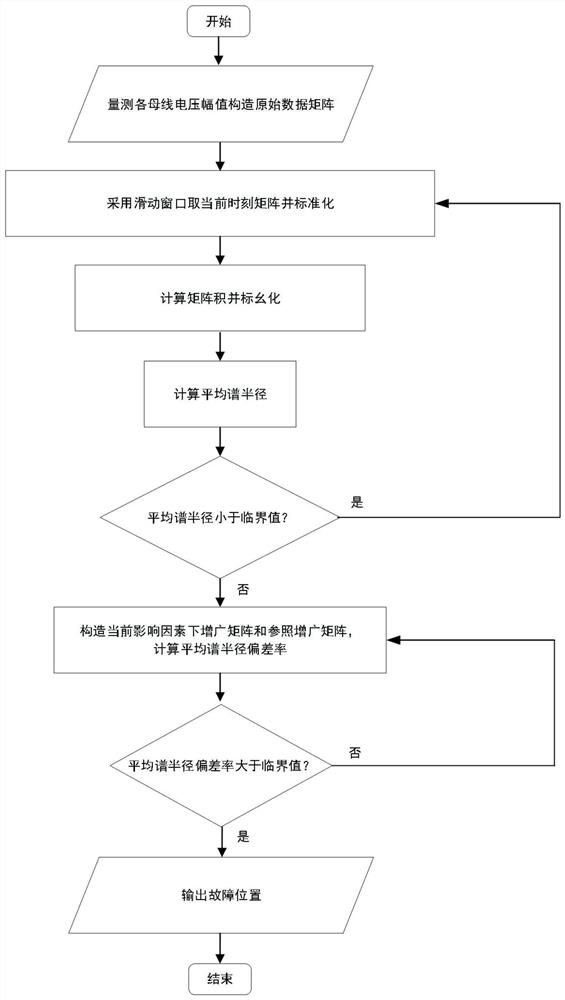
[0056] A data-driven distribution network anomaly identification method, which establishes a high-dimensional matrix model composed of voltage measurement data of each node, selects the average spectral radius as the linear eigenvalue statistic, and determines the time when the fault occurs; applies the augmented matrix theory to analyze the data Correlation analysis, the average spectrum radius deviation rate is constructed as a quantitative index, and the influence degree of each node voltage on the system operation state is measured.

Embodiment 2

[0058] The difference from Embodiment 1 is that the construction and standardization process of the high-dimensional matrix model is as follows: select N state quantities in the distribution network to represent the operating state of the system, including the amplitude of the three-phase voltage or current of the node and phase angle, active power and reactive power; at sampling time t i Form an N-dimensional sample column vector at a time:

[0059] x'(t i ) = (x 1 ',x 2 ',...x N ') T ;

[0060] The data vectors of all sampling moments in T samples are concatenated in time order to form a large matrix of N×T dimensions:

[0061] X'=[x'(t 1 ), x'(t 2 ),…,x’(t i ),…];

[0062] This matrix contains the time and space information of the system, and is the original data source for applying the big data-driven method. The sliding time window technology can separate the measurement data of the current moment and the historical moment, and analyze the operating status of th...

Embodiment 3

[0068] Difference with embodiment two is: comprise matrix product and per unitization process thereof, specifically as follows: first obtain the singular value equivalence matrix of X by following formula

[0069]

[0070] in is a Haar unitary matrix; now consider the product of L independent non-Hermitian matrices:

[0071]

[0072] The matrix Z is per unitized by formula (6):

[0073]

[0074] Finally, a matrix element with expectation and variance satisfying The standard matrix product of According to the random matrix theory, when the number of rows and columns of the matrix X is N,T→∞ and the ratio of rows and columns c=N / T∈(0,1], The empirical spectrum of eigenvalues ​​is almost all distributed within the ring, The probability density of is as follows:

[0075]

[0076] In the formula: λ is eigenvalues, L is the number of matrices; from formula (8), we can see that the standard matrix product on the complex plane The eigenvalues ​​have a high ...


PUM


Abstract

The invention discloses a power distribution network anomaly identification method based on data driving, and the method comprises the following steps: building a high-dimensional matrix model composed of voltage measurement data of each node, selecting an average spectral radius as a linear feature value statistic, and determining a fault occurrence moment; and performing data correlation analysis by applying an augmented matrix theory, constructing an average spectral radius deviation rate as a quantitative index, and measuring the influence degree of each node voltage on the system operation state. When the method is used for identifying the abnormal state of the power distribution network, the operation state of the system can be monitored in real time by effectively utilizing massive multi-source data of the power grid, the method is not limited by the expansion of the scale of the power grid and the complexity of the structure, does not relate to the action mechanism of each element in a physical model, and does not need to assume and simplify problems; the operation state of the system is sensed only from the perspective of data association, and compared with a traditional model method, the method has a wider application scene and can well cope with the development trend of a current power grid.

Description

technical field [0001] The invention belongs to the technical field of distribution network abnormality identification, and in particular relates to a data-driven distribution network abnormality identification method. Background technique [0002] The power grid itself has certain vulnerabilities. In addition to being affected by its own topology and equipment components, its operating state will also fluctuate to varying degrees with changes in external environmental factors. When its operating state deviates beyond the normal margin, it will enter Abnormal operating state. With the continuous expansion of the scale of the power grid and the advancement of China's energy revolution, new energy will gradually replace traditional power sources and be connected to the power grid. The application scenarios of the power grid have become more complex, and the weak links of the power grid are facing the challenges of many risk factors. The traditional manual monitoring mode cann...

Claims


Application Information

Patent Timeline
IPC IPC(8): G06F16/2458H02J3/00
CPCG06F16/2462H02J3/001H02J2203/20
Inventor 桂海涛骆育腾曾健俞小勇杨鑫吴茵李任明吴凡侯和明
Owner 广西电网有限责任公司桂林供电局
Why Eureka
Try Eureka