Method to obtain full range intrinsic spectral signatures for spectroscopy and spectral imaging

a spectral signature and intrinsic spectral technology, applied in the field of obtaining full range intrinsic spectral signatures for spectroscopy and spectral imaging, can solve the problems of limiting the spectral information available from instruments, unable to be absolutely removed from the intrinsic spectrum, and unable to achieve the effect of hyper-spectral image and positive identification of the presence of specific elements, molecules and compounds, etc., to achieve the effect of increasing the signal intensity

Active Publication Date: 2019-07-02
CENT FOR QUANTITATIVE CYTOMETRY
View PDF5 Cites 2 Cited by
  • Summary
  • Abstract
  • Description
  • Claims
  • Application Information

AI Technical Summary

Benefits of technology

[0017]According to one aspect of the invention, increased signal intens

Problems solved by technology

Moreover, the clarity of hyper-spectral images and positive identification of the presence of specific elements, molecules and compounds is impeded by irrelevant spectral components, e.g., the illumination, background and instrument noise.
Since the instrument noise is random, and thus cannot be predicted, it cannot be absolutely removed from the intrinsic spectrum.
Another limitation of multi-spectra and hyper-spectra is the electromagnetic wavelength range available from the individual instrument's illumination energy that limit the spectral information available from the instrument.
This information is not sufficient to i

Method used


Image

  • Method to obtain full range intrinsic spectral signatures for spectroscopy and spectral imaging
  • Method to obtain full range intrinsic spectral signatures for spectroscopy and spectral imaging
  • Method to obtain full range intrinsic spectral signatures for spectroscopy and spectral imaging

Examples


Embodiment Construction

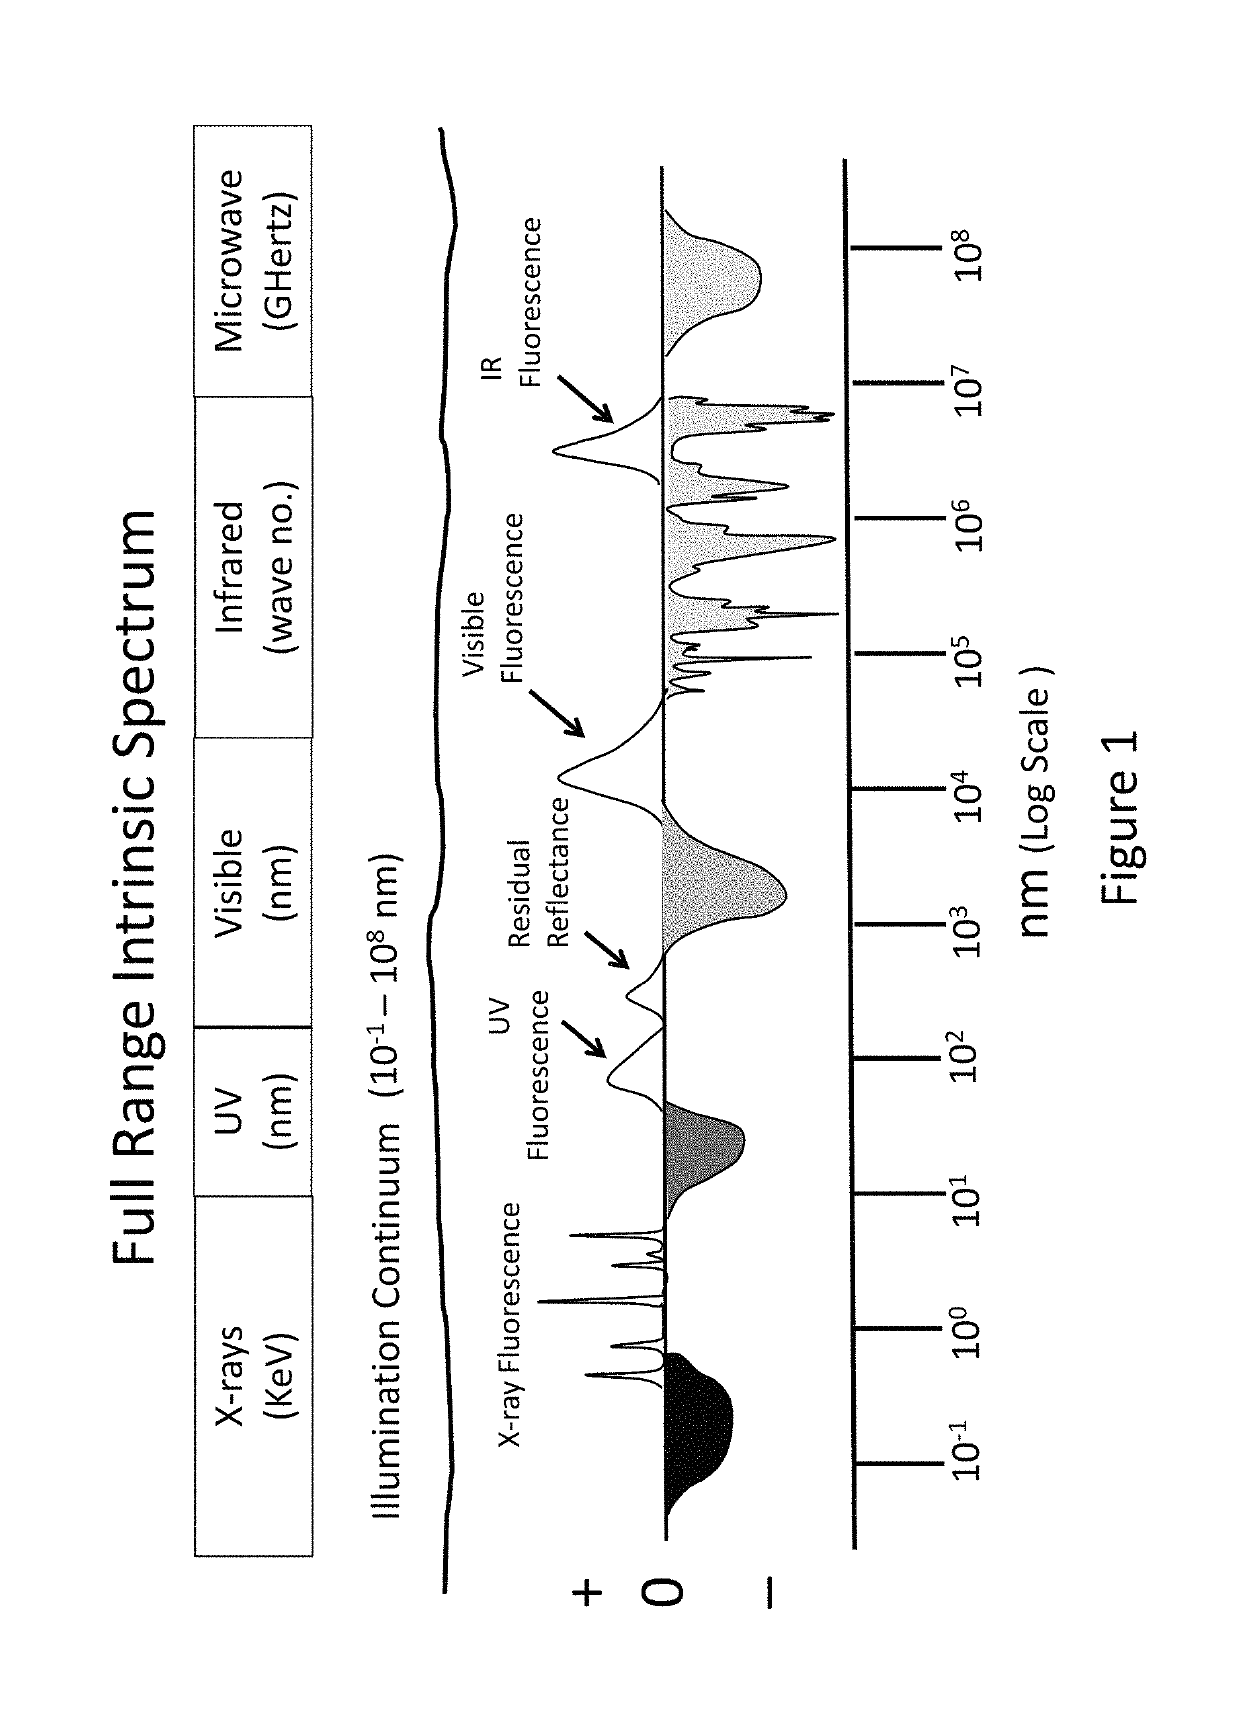
[0044]The present invention provides a method to obtain a full range intrinsic spectral signature for spectroscopy and spectral imaging. This method eliminates the irrelevant spectral components and proposes a novel methodology to normalize the spectral intensities across the full wavelength ranges obtained from different instrumentation. This methodology takes advantage that the ratio of the intrinsic noise level to the intrinsic sample intensities are proportional and independent of the gain settings and duration of data collection.

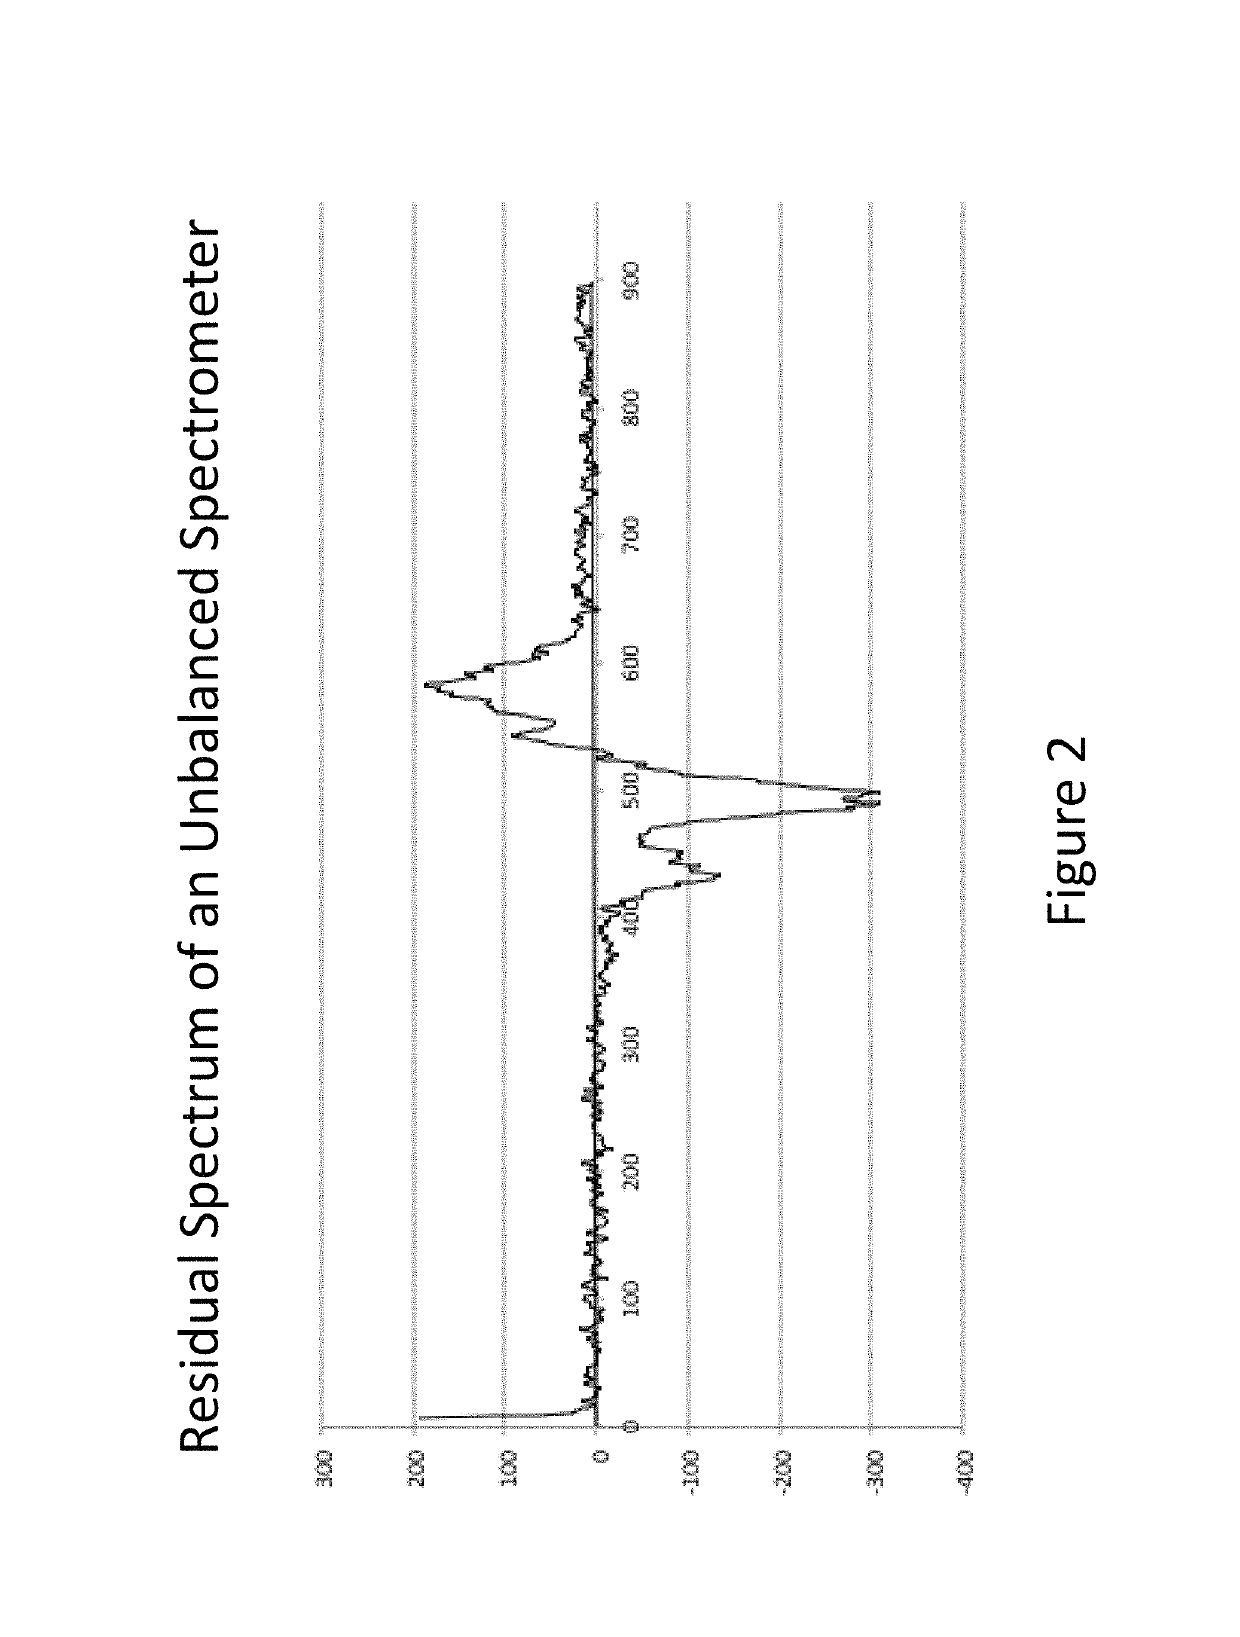
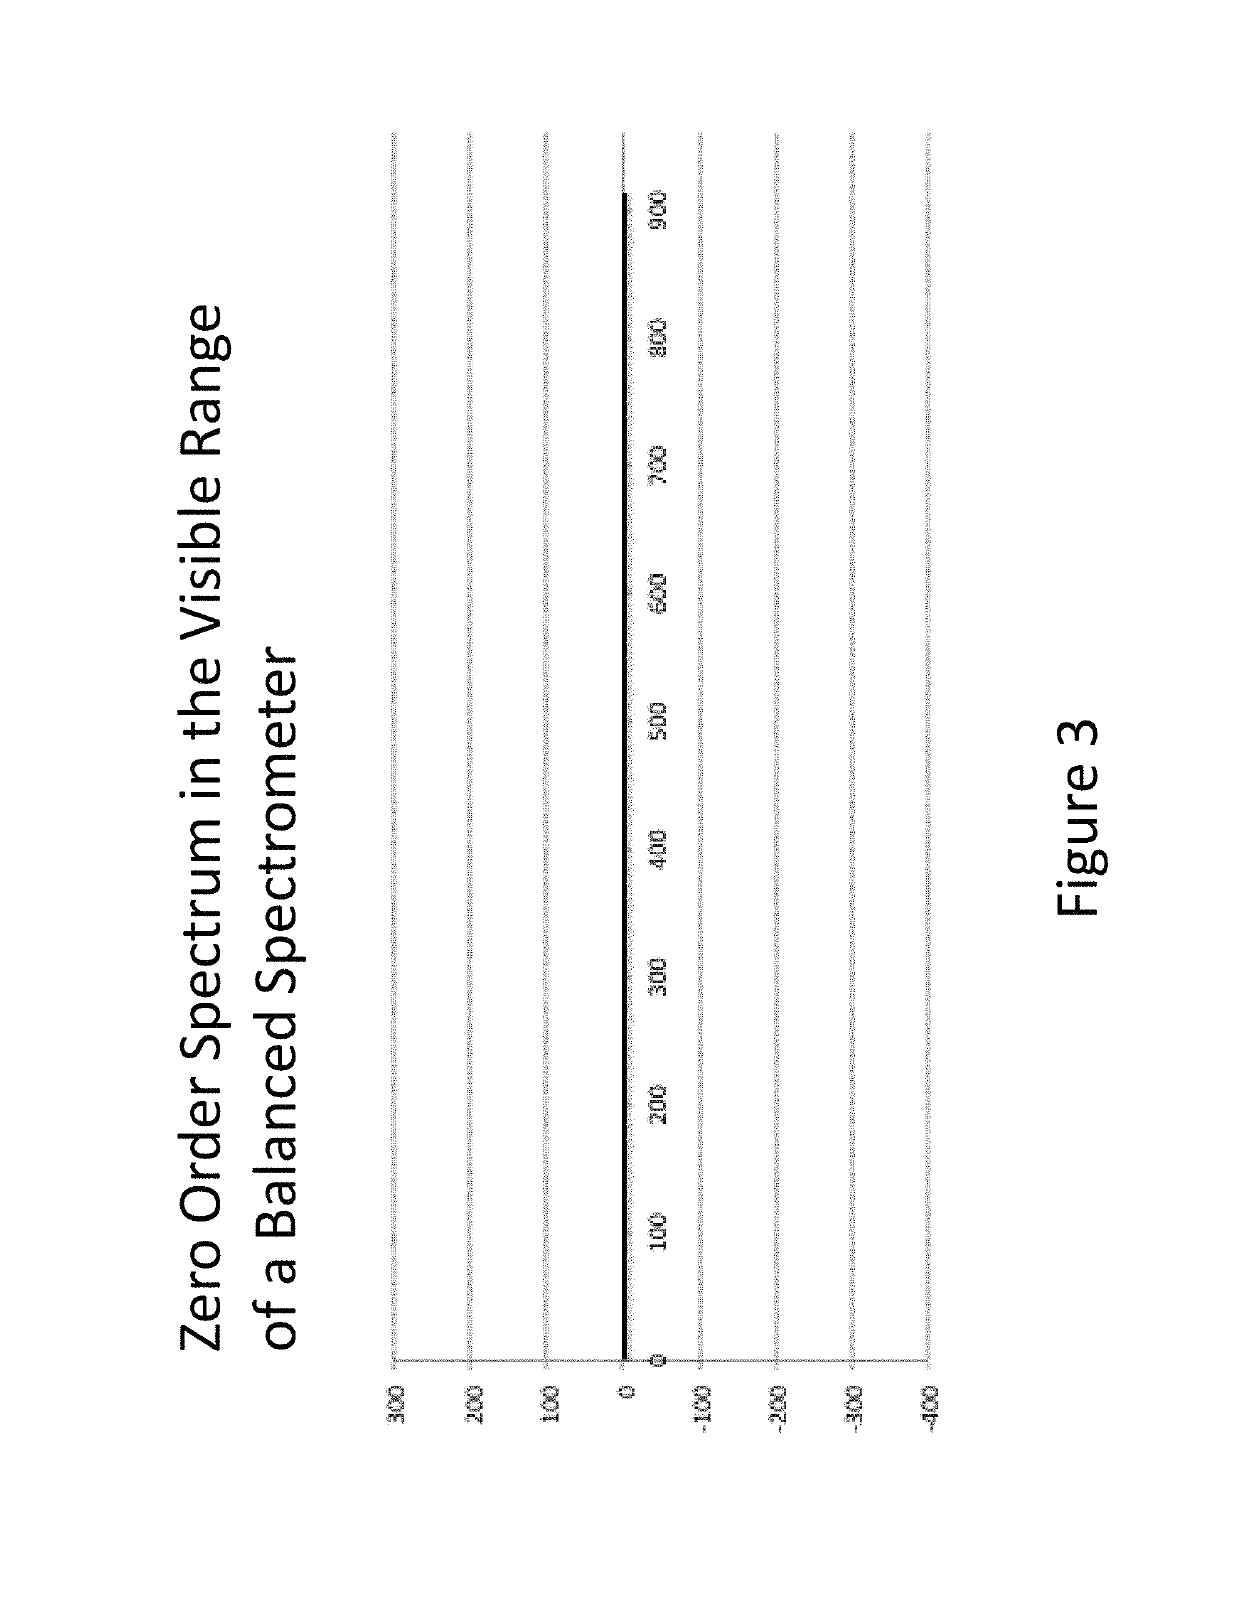
[0045]The methodology of the present invention determines the intrinsic instrument noise levels as described in U.S. Pat. No. 9,435,687, incorporated herein by reference in its entirety. As shown in plots a-c of FIG. 7, the spectral components of the instrument noise vary in wavelength position and intensity due to the fact that noise is random. However, the noise level across the indicated spectral range can be averaged for each spectrum. It is expecte...


PUM


Abstract

A method is provided to obtain a full range intrinsic spectral signature for spectroscopy and spectral imaging. The method eliminates the irrelevant spectral components and is used to normalize the spectral intensities across the full wavelength ranges obtained from different instrumentation. The method determines the intrinsic instrument noise levels and the noise level across the spectral range is averaged for each spectrum. By determining the percent of the integrated instrument noise relative to the integrated illumination energy for each instrument, the instrument noise can be normalized to one common value and the intensity values of the intrinsic sample spectra can be normalized proportionately and combined into a continuous intrinsic spectrum across the wavelength ranges of the contributing instruments. The methodology is also implemented in spectral imaging and spectral data cubes.

Description

BACKGROUND OF THE INVENTION[0001]Spectroscopy and spectral imaging have significantly progressed over the last hundred years employing the electromagnetic spectrum. However, spectroscopy has been developed for specific energy ranges, for example, x-ray dispersion, ultraviolet, visible, infrared, and microwave spectroscopies. These spectroscopic methods have adopted different units to describe the spectra derived within their specific energy range. For example, KeV is used for x-ray units, nm for ultraviolet and visible, wavenumber for infrared, and G-Hertz for microwave. Since these differing nomenclatures are different ways to refer to the electromagnetic spectrum, they can all be converted to a meter scale ranging from 10−1 to 108 nm (nanometers). With this common unit, it is easy to understand the spectroscopic relationships across the electromagnetic energy range as shown in FIG. 1.[0002]Spectral imaging, represented by multi-spectral and hyper-spectral imaging, is the formation...

Claims


Application Information

Patent Timeline
IPC IPC(8): G01J3/00G01J3/02G01J3/42G01J3/443G01J3/28
CPCG01J3/0297G01J3/2823G01J3/42G01J3/443G01J2003/2826G01J3/027G01J3/28G01N21/274
Inventor SCHWARTZ, ABRAHAMGAIGALAS, ADOLFAS K.INGRAM, PETER
Owner CENT FOR QUANTITATIVE CYTOMETRY
Why Eureka
Try Eureka