Method for precision cancer treatment by identifying drug resistance

a drug resistance and cancer technology, applied in the field of identifying drug resistance in cancer treatment, to achieve the effect of enhancing the signal intensity of each voxel, reducing the risk of cancer, and improving the survival ra

Inactive Publication Date: 2020-04-16
JIANG LAN
View PDF0 Cites 1 Cited by
  • Summary
  • Abstract
  • Description
  • Claims
  • Application Information

AI Technical Summary

Benefits of technology

[0062]Quantitatively Measure Tumor Microcirculation
[0063]The microcirculation is the circulation of the blood in the smallest blood vessels, the microvessels include terminal arterioles, metarterioles, capillaries, and venules. Arterioles carry oxygenated blood to the capillaries, and blood flows out of the capillaries through venules into veins. The main functions of the microcirculation are the delivery of oxygen and nutrients and the removal of carbon dioxide (CO2). Measurement of tumor microcirculation is a valuable medical diagnostic in the clinic. As non-invasive methods, laser Doppler perfusion imaging and laser speckle contrast imaging allow non-contact measurements of microcirculation. These techniques may only allow for measurements of surface tissue. Also, the measured results cannot distinguish the fresh oxygenated blood and low HbO2 blood inside tumor. In fact, only fresh oxygenated (high HbO2) blood perfusion areas may be more valuable for assessing tumor microcirculation in pathophysiology. The better the fresh oxygenated blood perfusion region, the more efficient the microcirculation tumor region exchange. The ability to quantitatively assess tumor oxygenated perfusion (tumor microcirculation) is a novel aspect of the present invention.
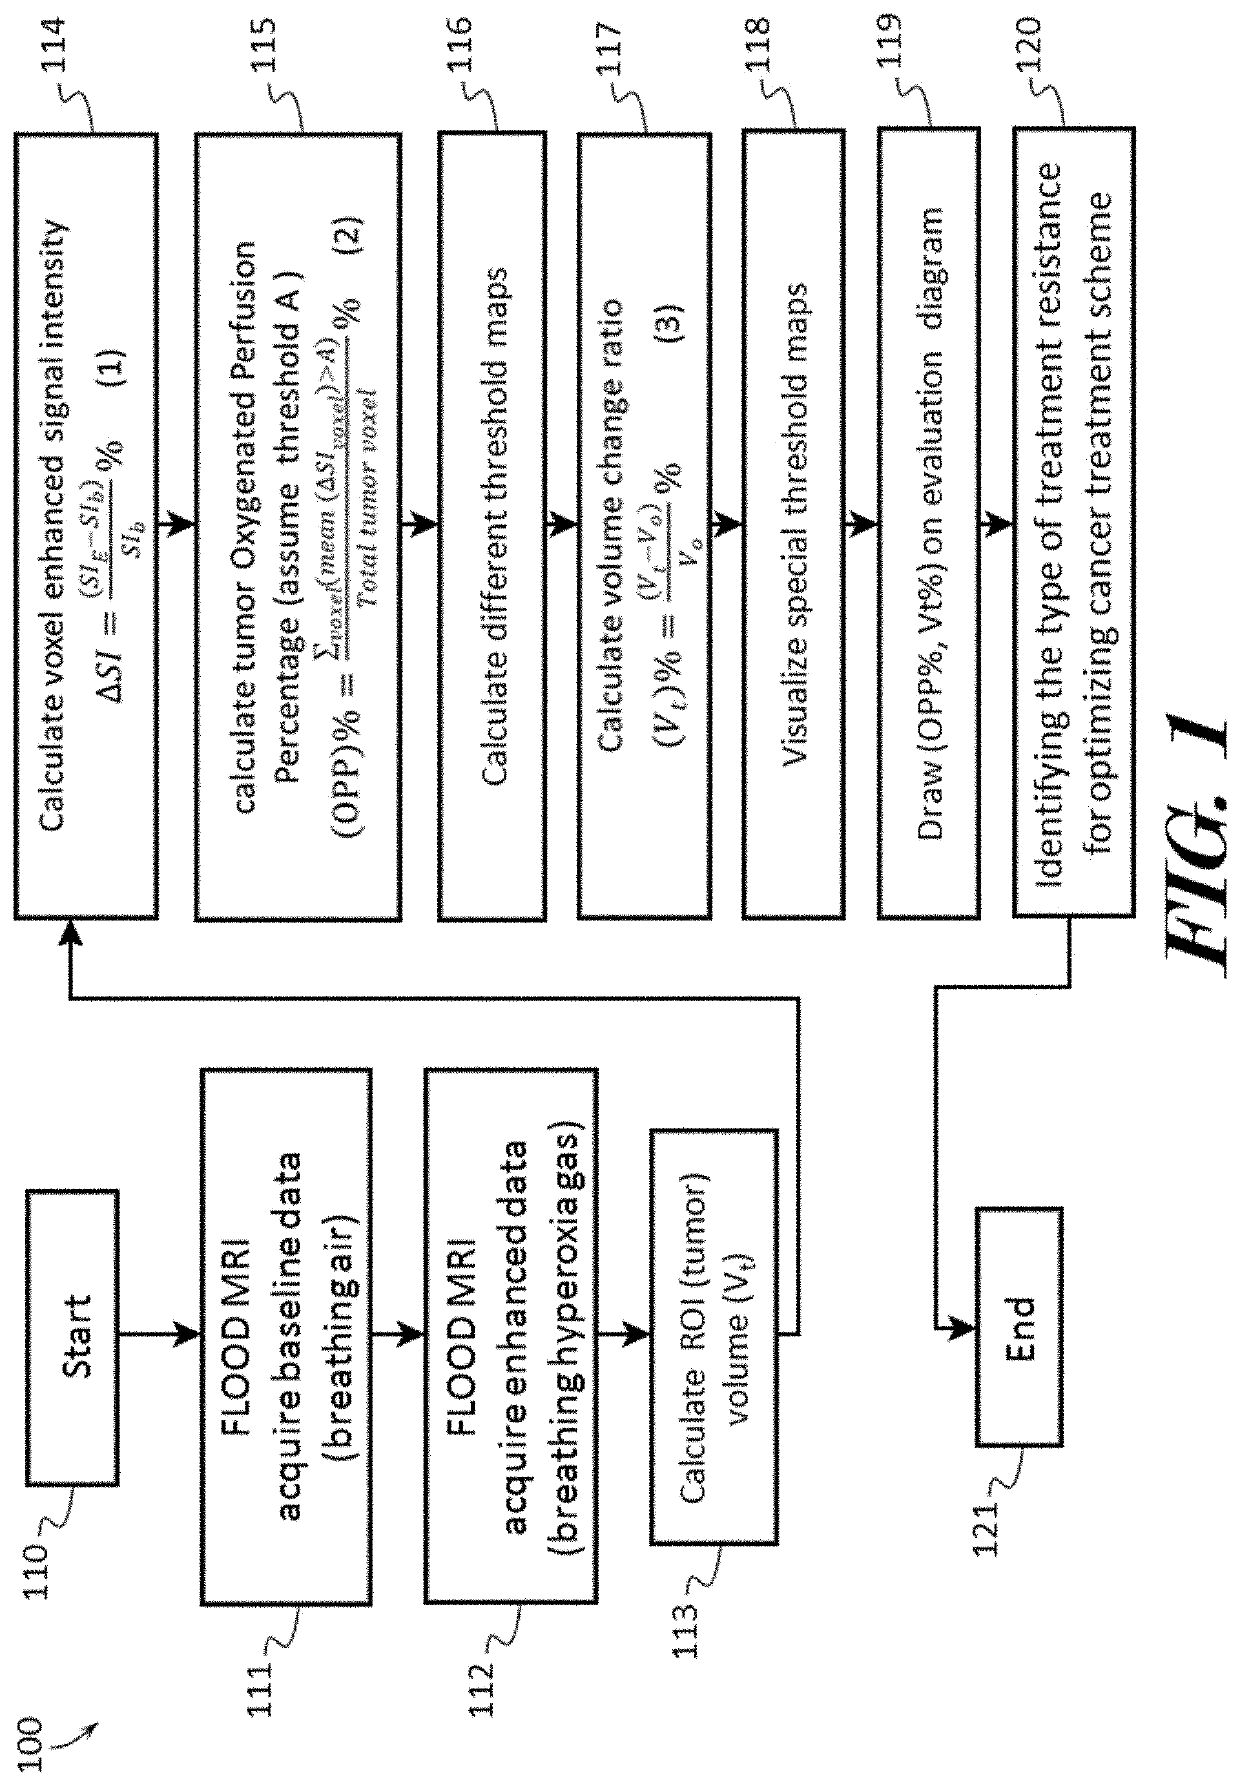
[0064]Based on MR imaging protocols and techniques, data processing may include automatically contouring tumor ROI region, calculating enhanced signal intensity of each voxel of tumor region. In some embodiments, the relative signal intensity (ΔSI) of tumor on a voxel-by-voxel basis may be calculated using the equation (from common knowledge):
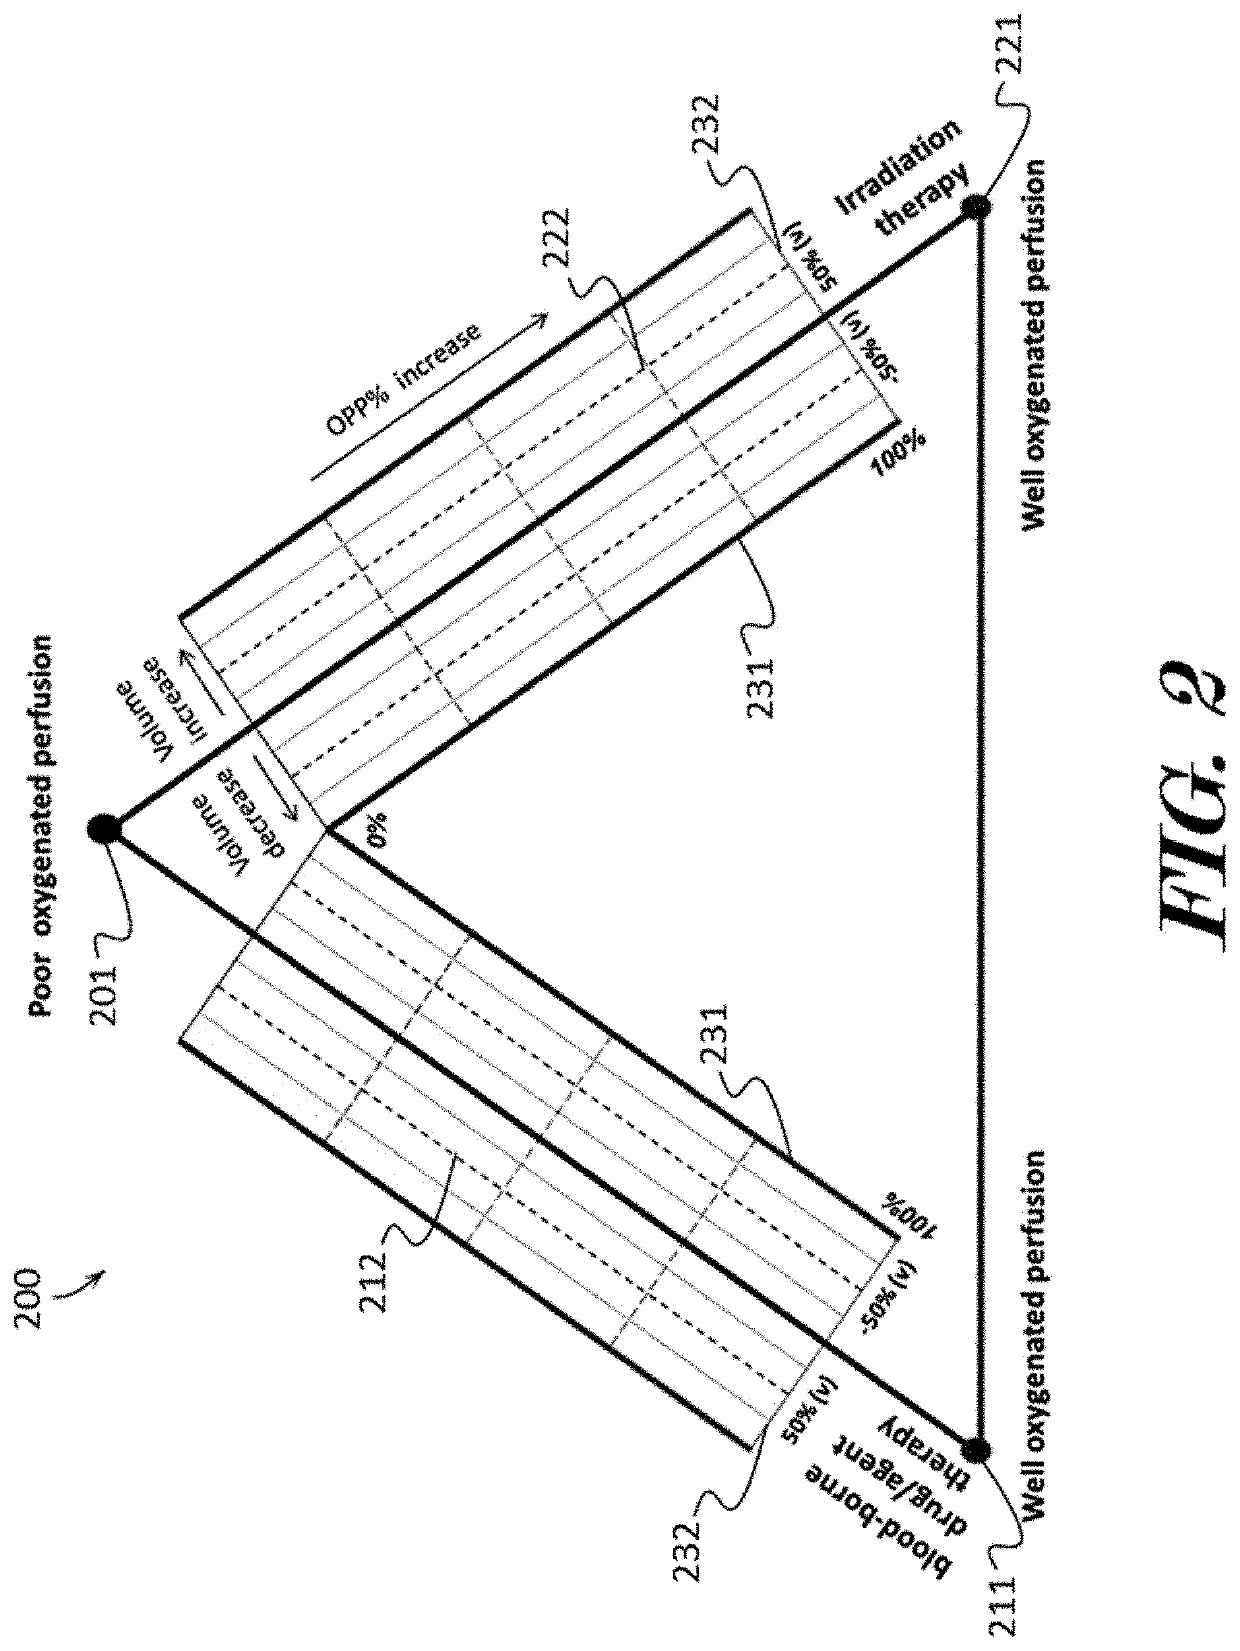
[0065]Where, the threshold A is selected as a percentage based on the MR imaging pulse sequence, TR / TE time, magnet strength of clinical scanner, sensitivity of coil, cancer site, and etc. For example, it can be assumed a standard threshold 10% for 1.5 T and 15% for 3 T MRI scanner. The lower OPP % may represent inefficient drug / agents' distribution which may be associated with ineffective treatment outcomes (FIGS. 4A-4C). Conversely, the higher OPP % of tumor may be, the better drug / agent's distribution and better microcirculation which may be associated with effective treatment outcomes (FIGS. 4D-4F).
[0066]For analysis of tumor microcirculation distribution, a multiplate threshold set may be used to generate the map with different threshold which is the OPP % pseudo color image for better visualization. The tumor pseudo color map may provide another way for visualizing tumor microcirculation distribution map.
[0067]Herein, although tumor microcirculation may be quantified by the OPP % parameter which is the relative value of each patient's inhaled hyperoxia gas, the OPP % cannot be used to measure the value of plasma drug concentration in tumor region. For example, the low OPP % of the tumor is related to the relatively small amount of fresh oxygenated blood flowing through and the relatively low drug / oxygen delivery capacity. It cannot be used to quantitatively measure the plasma drug concentration and the absolute value of pO2 in local region of the tumor. For radiotherapy, a lower OPP % case may only indicate the potential for hypoxia, which may lead to treatment barrier in radiation therapy. The advantage of using the relative value of OPP % is that the tumor microcirculation of all different tumors can be quantified and unified into a set of criteria for further evaluation.

Problems solved by technology

1. Using endogenous contrast agent dHbO2 and applying special imaging protocol and T2 weighted MRI technique to monitor tumor therapeutic response during treatment course. In preferred embodiments, oxygenated perfusion percentage data OPP % is to use threshold technique in processing dynamic contrast enhancement T2 weighted MRI data for quantitatively measuring patient tumor microcirculation during the course of treatment or before treatment. Current clinical diagnostic imaging modalities which use extrinsic contrast agents may have a limitation to monitor therapeutic response information during cancer treatment course due to change of vascular permeability. Many cancer treatments may often lead to significant change of permeability. In some embodiments, an imaging protocol and technique of the present invention may use endogenous contrast agent dHbO2 for non-invasively imaging tumor physiologic information (oxygenated perfusion) because oxygen in the blood can rapidly diffuse and exchange across the vessel wall independent of vascular permeability. The high-enhanced signal region represents a fresh oxygenated blood flow region and a good microcirculation region. Although such imaging protocols and techniques have been reported, a novel aspect of the present invention is that it is the first to enable the identification of the type of drug resistance in the cancer systemic treatment by novel technical methods.
2. Quantitatively analyzing tumor microcirculation. Although tumor microcirculation is a very important physiologic factors, to non-invasively evaluate tumor microcirculation in clinical routine remains a challenge. For dynamic contrast enhancement signals processing model, average of enhanced signal of all tumor region and its curve are often used to represent enhanced results which is not enough to evaluate whole tumor microcirculation. In preferred embodiments, the relative signal enhancement signal may be processed on voxel-by-voxel basis. An enhanced threshold may be set up to classify the level of fresh oxygenated perfusion inside tumor and all voxels of tumor which are more than threshold will be counted. Finally, the tumor microcirculation may be quantitatively evaluated as the percentage of tumor fresh oxygenated perfusion region. The higher the percentage of oxygenated perfusion region, the higher amount of fresh blood that flows in, and the better the microcirculation of the tumor, which may be related to possible future treatment outcomes. Medical research demonstrated that tumor microcirculation, as prognostic information, is associated with the effects of systemic therapy and radiotherapy.
3. Two parameters of the previous response and possible future response were used as a tumor treatment response information point. Changes in tumor volume are often used to assess treatment outcomes. However, tumor volumes in response to effective treatment are significantly delayed by days or weeks. The tumor volume information only reflects a result of previous treatment when measuring tumor during treatment course. The clinician wants to know both of this information to understand the previous treatment response of the tumor and the possible outcomes in order to make adjustment of treatment plan in time. Changes in tumor volume and tumor microcirculation may constitute a point in a two-dimensional coordinate system that represents previous treatment outcomes and possible future treatment outcomes. Visualization of measurement points (two-dimensional tumor response information) may be used to help track and identify different treatment resistances, thereby optimizing treatment strategies and reducing ineffective treatment.

Method used


Image

  • Method for precision cancer treatment by identifying drug resistance
  • Method for precision cancer treatment by identifying drug resistance
  • Method for precision cancer treatment by identifying drug resistance

Examples


Embodiment Construction

[0040]The terminology used herein is for the purpose of describing particular embodiments only and is not intended to be limiting of the invention. As used herein, the term “and / or” includes any and all combinations of one or more of the associated listed items. As used herein, the singular forms “a,”“an,” and “the” are intended to include the plural forms as well as the singular forms, unless the context clearly indicates otherwise. It will be further understood that the terms “comprises” and / or “comprising,” when used in this specification, specify the presence of stated features, steps, operations, elements, and / or components, but do not preclude the presence or addition of one or more other features, steps, operations, elements, components, and / or groups thereof.

[0041]As used herein, the term “cancer or tumor” refers to the mammalian, such as a human, solid tumor or solid cancer in any site which can be detected by Magnetic Resonance Imaging (MRI).

[0042]As used herein, the term ...


PUM


Abstract

A method for precision cancer treatment by identifying drug resistance is provided. In some embodiments, the method may include: detecting tumor oxygenated perfusion by having a patient breathe air to acquire MRI baseline data; inhalation of hyperoxia gas to generate higher than baseline HbO2 blood circulating in body to acquire MRI enhanced data; the region-of-interest (ROI), which in this case is a tumor volume (V0), and which may be performed by volume contour tracing/region-of-interest (ROI) analysis and 3D tumor volumetry methods; calculating voxel's enhanced signal intensity (ΔSI); calculating tumor oxygenated perfusion percentage (OPP %); selecting different threshold and calculating maps such as a reconstruction OPP % pseudo color map; calculating tumor volume change ratio (Vt %); overlaying reconstruction OPP % pseudo color map to original images for visualizing tumor response data; drawing or plotting the OPP % and Vt % on a cancer treatment response information diagram, and identifying the type of drug resistance, classifying the drug resistance being caused by poor drug distribution factor or cells-specific factor based on pooled collected data.

Description

CROSS REFERENCE TO RELATED APPLICATIONS[0001]This application is a continuation-in-part of U.S. Non-Provisional application Ser. No. 15 / 275,897, filed on Sep. 26, 2016, entitled “CANCER THERAPEUTIC WINDOW EVALUATION METHOD”, which claims the benefit of U.S. Provisional Application No. 62 / 233,682, filed on Sep. 28, 2015, entitled “CANCER TREATMENT EVALUATION METHOD”, the entire disclosures of which are incorporated by reference herein.FIELD OF THE INVENTION[0002]This patent specification relates to the field of identification methods of tumor drug resistance. More specifically, a non-invasive method for identifying drug resistance in cancer treatment, this patent specification relates to computer implemented method of identifying drug resistance in solid cancer systemic therapies for improving cancer treatment outcomes.BACKGROUND[0003]Although there are multiple therapeutic modalities (Chemotherapy, Radiotherapy, Immunotherapy, Molecular Targeted Therapy, etc.) available for cancer t...

Claims


Application Information

Patent Timeline
Patent Type & Authority Applications(United States)
IPC IPC(8): A61B5/055G06T7/00G06T7/33G06T7/35G16H50/30G16H30/20G06F17/18
CPCA61B5/055G06T7/0014G06T7/337G06T7/35G16H10/40G16H50/30G16H30/20G06F17/18G06T7/97A61B5/02028A61B5/0263A61B5/4312A61B5/4848A61B5/7275A61B2576/00G06T7/0016G06T2207/10088G06T2207/30068G06T2207/30104G16H10/60G16H20/10G16H30/40G16H70/40
Inventor JIANG, LAN
Owner JIANG LAN
Why Eureka
Try Eureka