
Method for automated analysis of apical four-chamber images of the heart

Inactive Publication Date: 2003-08-14
FLORIDA UNIV OF A FLORIDA
View PDF0 Cites 99 Cited by
  • Summary
  • Abstract
  • Description
  • Claims
  • Application Information

AI Technical Summary

Benefits of technology

[0316] During the inhalation of compressed air, intravenous injection of Albunex.RTM. caused opacification of both the left and right ventricular chambers of the heart. The contrast agent remained in the left ventricle for 17.+-.1 sec and in the right ventricle for 14.+-.1 sec. As the concentration of oxygen increased in the inhaled gas mixture. Albunex.RTM. produced contrast for shorter periods in the left ventricular chamber. At concentrations of 80% and 100% oxygen, Albunex.RTM. caused only brief periods of faint contrast and most injections of Aibunex.RTM. failed to create any contrast (10 of 13 injections and 12 of 14 injections, with respect to the percent oxygen). The duration of contrast in the left chamber correlated inversely with the partial pressure of oxygen in the arterial blood (r=0.824, p<0.001). In the right ventricle, Albunex.RTM. also produced shorter periods of contrast during inhalation of gases containing higher concentrations of oxygen. Unlike in the left ventricle, however, Albunex.RTM. created some contrast in the right ventricle even during the inhalation of 100% oxygen. The partial pressure of oxygen in the venous blood correlated inversely with the duration of contrast in the right ventricle (r=0.740, p<0.001). The inhalation of gas mixtures containing oxygen at concentrations greater than air also affected the quality of contrast produced by Albunex.RTM.. Video densitometric analysis also demonstrated a decrease in brightness with an increase in oxygen present in the inhaled gas mixture. The end-diastolic frame, which was measured five cardiac cycles after contrast entered the left ventricular chamber, demonstrated that AlbunexO produced contrast significantly less intense at concentrations of 50% oxygen or greater compared with compressed air or 20% oxygen. At this fifth end-diastolic image, however, Albunex.RTM. attenuated the ultrasound image during the inhalation of compressed air or 20% oxygen. This Albunex.RTM. induced attenuation of the cardiac image artificially lowered the brightness of the ultrasound signal when compressed air or 20% oxygen was inhaled. Assessed immediately after the cessation of attenuation. Albunex.RTM. produced an increase in video densities of 48.+-.7 units and 44.+-.8 units during the inhalation of compressed air or 20% oxygen, respectively. Compared with the postattenuation values of brightness, Albunex.RTM.t caused significant decreases in contrast intensity when gas mixtures of 40% oxygen or greater were inhaled.
[0325] As the gas mixture deviated further from air, the efficacy of Albunex.RTM. progressively decreased. The loss of contrast by Albunex.RTM. began to occur within a therapeutic range of oxygen concentrations (Luce and Hopewell, 1992). These data suggest that patients subjected to supplemental oxygen may experience less contrast (quality and duration) in the left ventricle after intravenous administration of Albunex.RTM.. Changes in dose-volume or injection rate may help improve the quality, of contrast produced by Albunex.RTM. when the subject inhales oxygen at concentrations used under clinical conditions (Wible Jr. et al., 1996).
[0326] The effects of inhaled gases on Albunex.RTM. contrast occurred in a fairly short period of time. To reverse this effect, however, compressed air needed to be inhaled for at least 10 to 15 mn before Albunex.RTM. again consistently produced contrast in the left ventricle. Thus in situations where the removal of supplemental oxygen for short periods is possible, Albunex.RTM. can regain the ability, to fill the left ventricular chamber with ultrasound contrast.Example 5Importance of Acoustic Power and Exposure Time for Optimal COntrast in Vvio

Problems solved by technology

Tracing of endocardial borders on two-dimensional echocardiograms, however, is tedious and the selected borders may be highly subjective.
Manually defining such boundaries becomes increasingly labor intensive when the analysis of a complete cardiac cycle is needed to provide a description of the systolic and diastolic wall motion pattern, or when a number of echocardiographic frames have to be processed in order to obtain an extended time-history of cardiac function.
However, most researchers have had difficulties with image enhancement and boundary detection with echocardiographic images because of the low signal-to-noise ratio and large discontinuities in such images.

Method used


Image

  • Method for automated analysis of apical four-chamber images of the heart
  • Method for automated analysis of apical four-chamber images of the heart
  • Method for automated analysis of apical four-chamber images of the heart

Examples


first embodiment

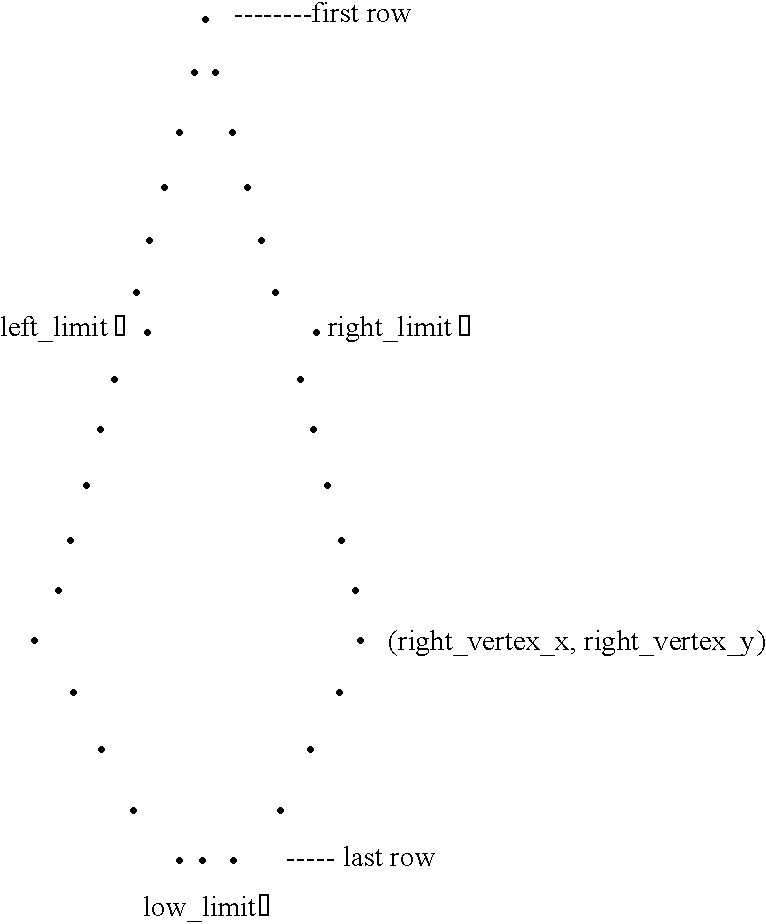
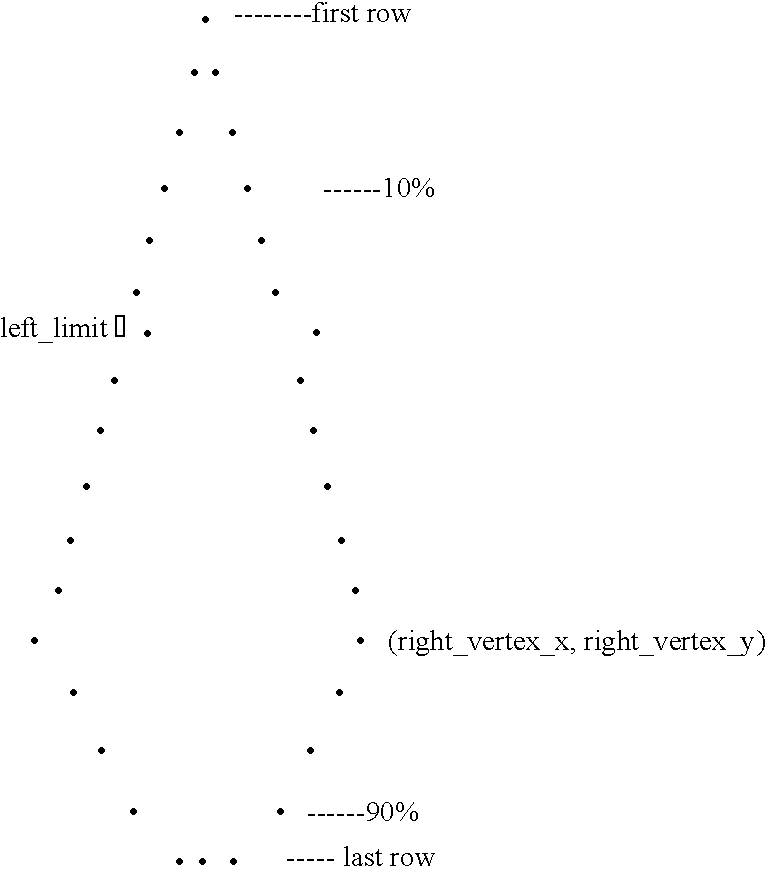
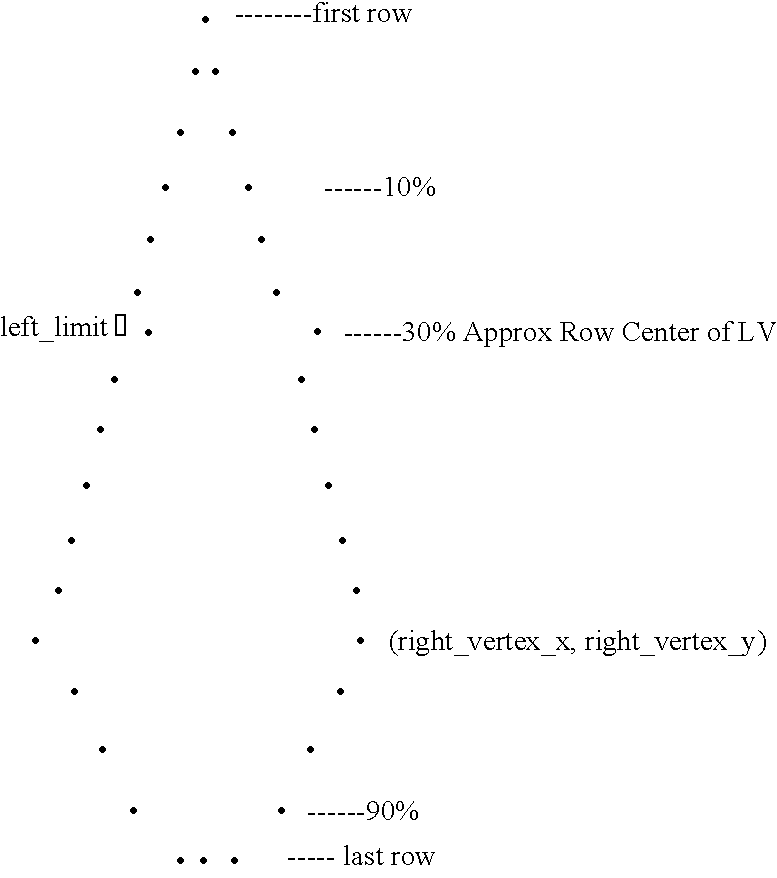
[0076] The first step in the automated process of the present invention is to determine the center-point of the left ventricle and a search region for border discrimination. The center-point is estimated in one embodiment by using circular arc filters to determine the approximate positions of the epicardial and endocardial borders. In another preferred embodiment, the center-point is estimated by first determining the position of the posterior epicardium using a circular arc filter, and then making an approximation of the positions of the right and left epicardium using elliptical arc filters. Once the center-point and search regions are estimated, the probable positions of the epicardial and endocardial borders are more closely approximated. In the inventive method, the probable positions of the epicardial and endocardial borders are approximated by generating amplitude distibutions along each oi a number of circular segments based on the computed center-point. In a second preferre...

example 1

A Method for Evaluation of Enhancement Operations in Two-Dimensional Echocardiographic Images

[0114] The purpose of this Example is to report the methods and results of a locally calculated peak-to-background ratio that can be used to objectively estimate the degree of enhancement achieved in a two-dimensional echocardiographic image.

[0115] Methods

[0116] Data Acquisition

[0117] Two-dimensional short-axis ultrasound images were obtained retrospectively from six patient studies performed for routine diagnostic reasons in the clinical echocardiography laboratory at the University of Florida (Gainesville, Fla.). A representative end-diastolic and end-systolic frame from each of these six patient studies was converted from videotape to digital format. Analog-to-digital conversion was carried out to produce a 256.times.240 pixel image at 4-bit depth (16 gray levels). From each of these images a 120.times.140 pixel region of interest was selected by manual windowing. The resulting 12 regions...

example 2

Automatic Identificaiton of Papillary Muscles in Left-Ventricular Short-Axis Echocardiographic Images

[0159] When screening left ventricular short-axis echocardiographic images. cardiologists partly depend on the wall motion and the wall thickness to make an assessment about the patient's cardiac function. Even though computation of wall motion and wall thickness are a simple task, if the endocardial and epicardial borders have been found, efforts at real-time (or near-real time) quantitation have met with limited success.

[0160] While a commercially available system has a feature referred to as Automated Border Definition (ABD), the feature uses a threshold method based on the integrated backscatter to identify edges tmroughout the entire image. As with any threshold method, the ABD feature can be visualized as a method that uses the ultrasound backscatter to create a new surface which has value one at locations with intensity above threshold (tissue) and zero at locations with inten...


PUM


Abstract

A method for quantitatively analyzing digital images of approximately elliptical body organs, and in particular, echocardiographic images is provided. In particular, methods are disclosed for obtaining short-axis apical four-chamber views of a heart, and particularly for obtaining high-quality automated images of particular regions of the heart muscle, as viewed along its long axis.

Description

[0002] The invention concerns systems for automatically analyzing echocardiographic digital images of the heart, especially two-dimensional images acquired using apical four-chamber view of the heart. The systems preferably employ a collection of matched filters on the images to automatically locate and measure features of the heart.DESCRIPTION OF RELATED ART[0003] Two-dimensional ultrasonic imaging is used as an important non-invasive technique in the comprehensive characterization of a number of body organs. In ultrasonic imaging, a sound pulse is sent along a ray from a transducer towards the organ that is being imaged. The pulse is attenuated and reflected when it hits a medium with an acoustic impedance different from that of the medium in which the pulse is traveling. The time the sound pulse takes in transit is a measure of the distance of the medium interface from the transducer. The amount of energy that is reflected is a measure of the difference in acoustic impedance acro...

Claims


Application Information

Patent Timeline
IPC IPC(8): G06T5/00G06T7/00
CPCG06T7/0012G06T7/0083G06T2207/30048G06T2207/10132G06T7/403G06T7/12G06T7/44
Inventor GEISER, EDWARD A.WILSON, DAVID C.
Owner FLORIDA UNIV OF A FLORIDA
Learn More