Test piece for assaying high density lipoprotein (hdl) cholesterol
- Summary
- Abstract
- Description
- Claims
- Application Information
AI Technical Summary
Benefits of technology
Problems solved by technology
Method used
Image
Examples
example 1
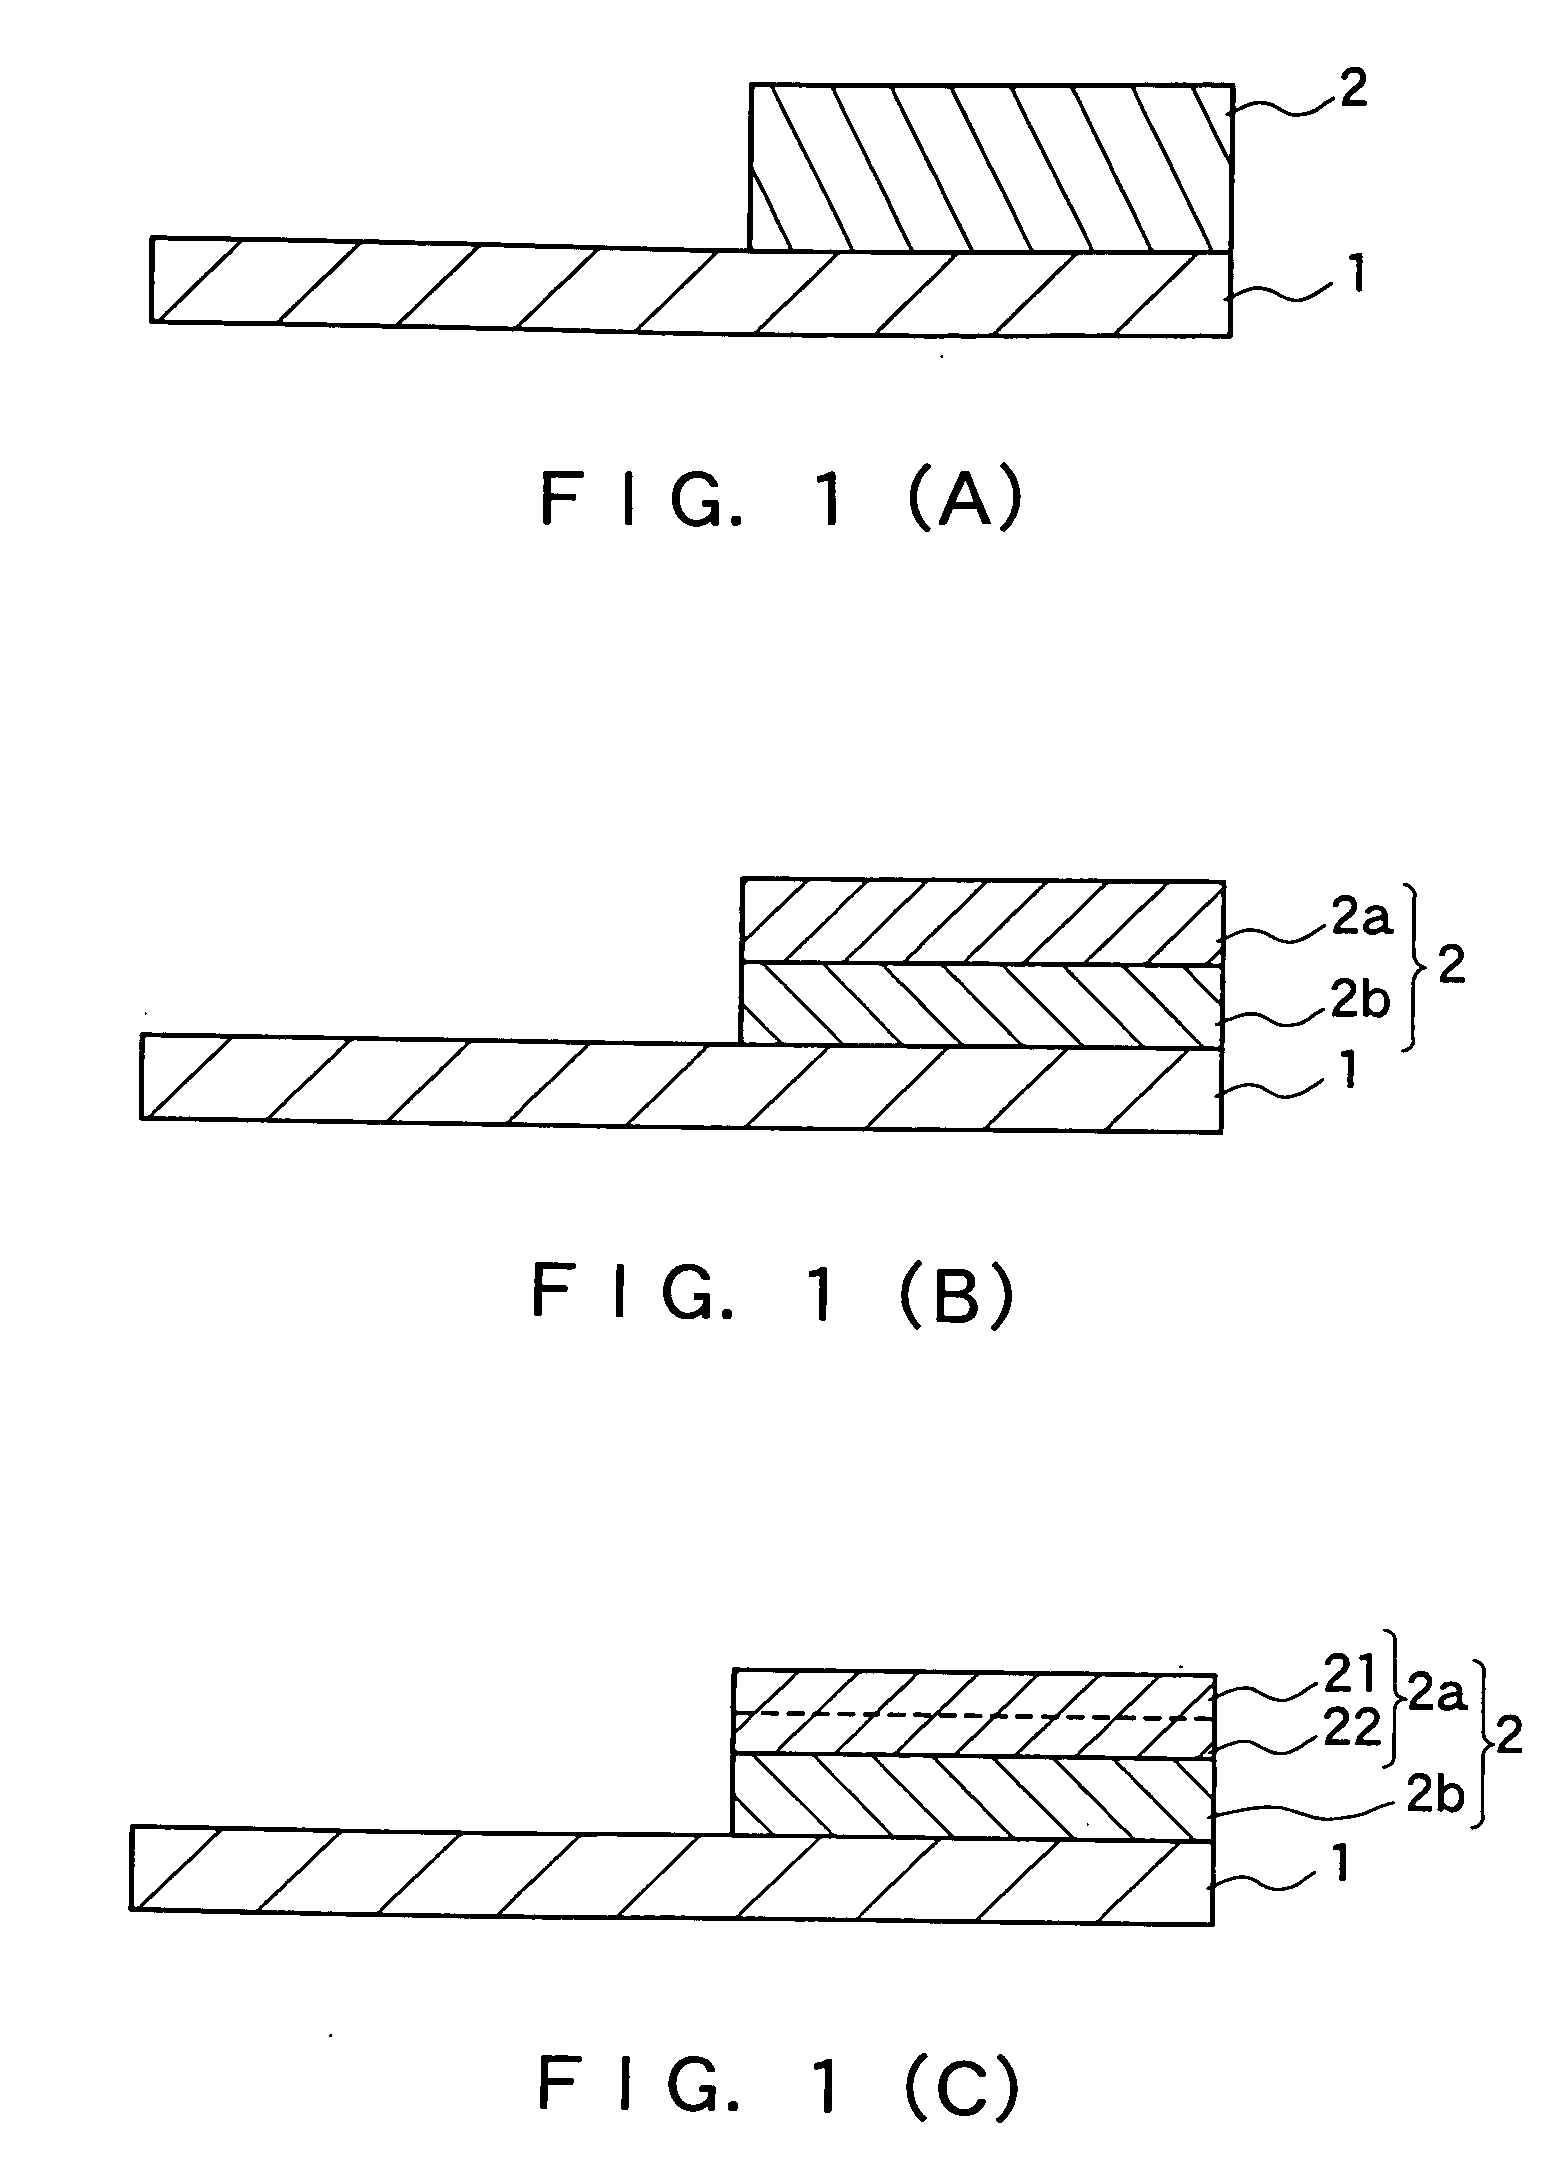
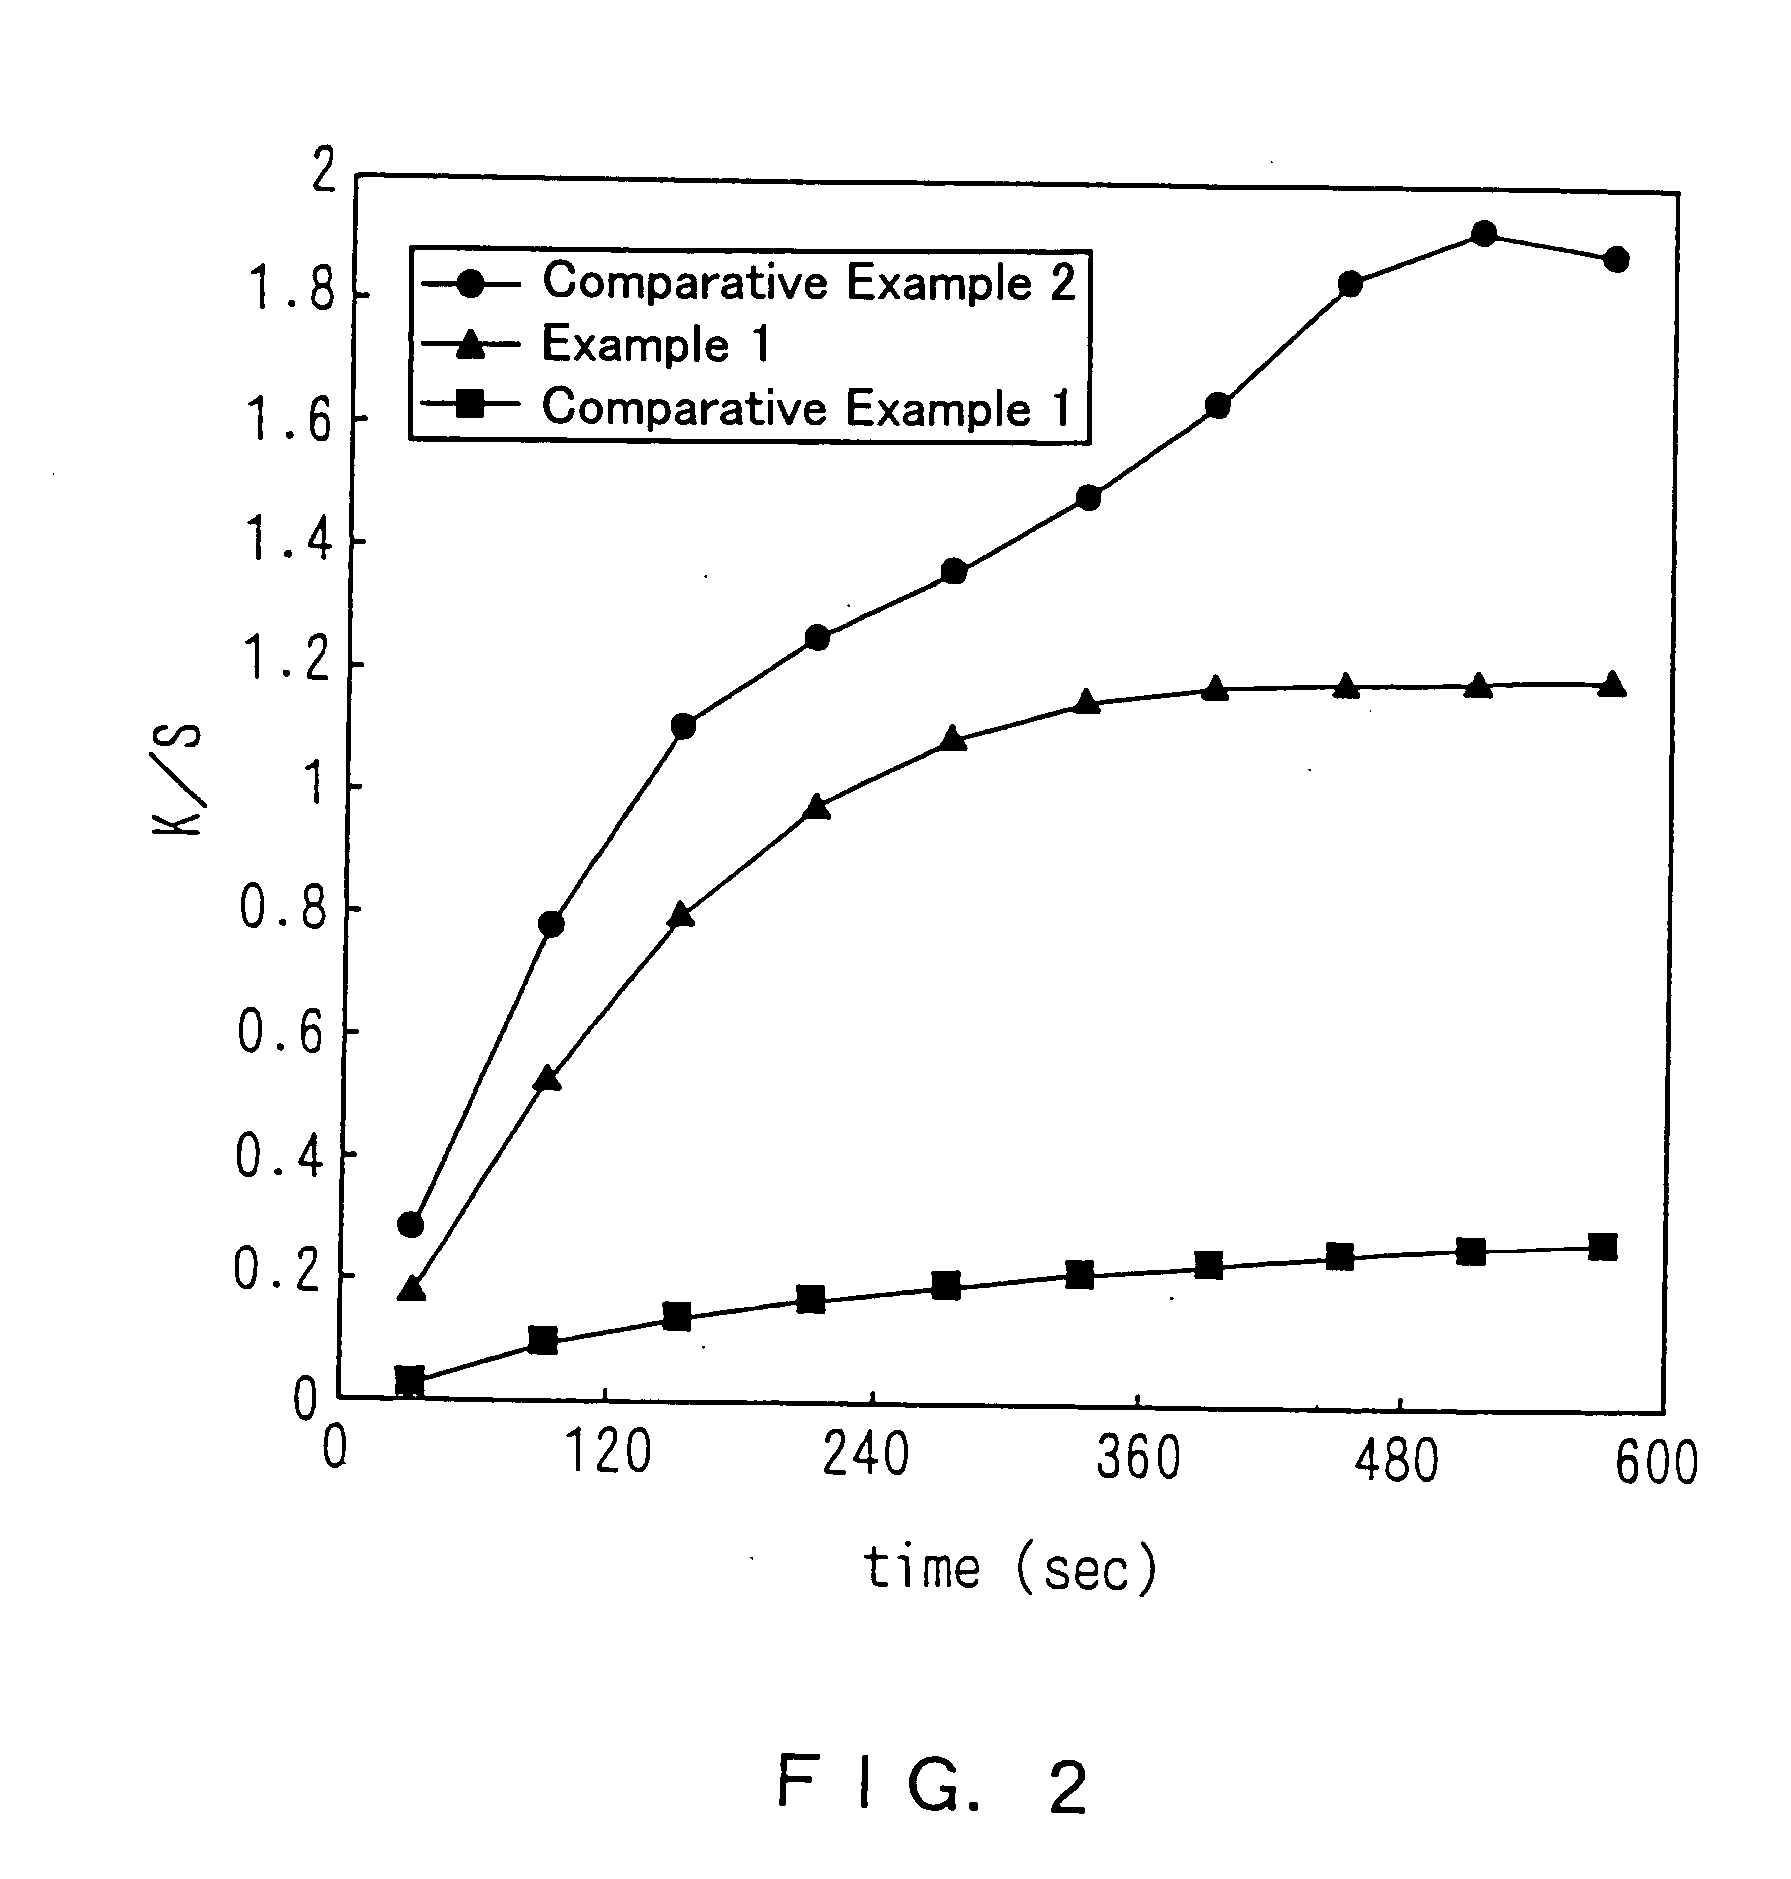
[0033] A solution for forming a detecting layer, having the following composition, was applied onto a white PET film (125 .mu.m thickness) so as to be 150 .mu.m in thickness and then dried at 40.degree. C. for 10 minutes. Thus, a detecting layer was formed. On the other hand, a polyethylene knit fabric (250 .mu.m thickness) was impregnated with an impregnating solution having the following composition, and then dried at 40.degree. C. for 10 minutes. After that, a coating solution was applied onto one surface of the polyethylene knit fabric and then dried at 40.degree. C. for 10 minutes. Thus, a sample supply layer was formed. Subsequently, distilled water was sprayed over the surface of the detecting layer, and the sample supply layer was laminated on the surface of the detecting layer so that the surface of the sample supply layer opposite to the surface onto which the coating solution had been applied was in contact with the surface of the detecting layer. The thus-obtained lamina...
example 2
[0037] Three types of test pieces (A, B, C) were produced in the same manner as in Example 1 except that the final concentrations of the first surfactant and the second surfactant were adjusted as shown in Table 1 below. With regard to 60 serum samples with a known HDL cholesterol concentration, a reflectance was measured in the same manner as in Example 1 using these three test pieces. Then, from the reflectance thus measured, the amount of the HDL cholesterol was calculated using the above-described "K / S" value. Then, the correlation between the thus-obtained concentration and the known concentration was examined. The results also are shown in Table 1 below.
2 TABLE 1 1st 2nd correlation surfactant surfactant coefficient (r) test piece A 1 wt % 1 wt % 0.87 test piece B 2 wt % 2 wt % 0.94 test piece C 4 wt % 4 wt % 0.97
[0038] As shown in Table 1, all of these three test pieces A, B, and C exhibited a high correlation coefficient.
example 3
[0039] The same test piece as than of Example 1 was produced. HDL cholesterol in 60 serum samples was measured in the same manner as in Example 2 using this test piece. HDL cholesterol in these samples was measured also by the aggregation method and the direct method as described in the following. Thereafter, the correlations between the measured value obtained by the test piece and that obtained by the aggregation method and between the measured value obtained by the test piece and that obtained by the direct method were examined. The graph of FIG. 3 shows the correlation between the measured value obtained by the test piece and that obtained by the aggregation method. The graph of FIG. 4 shows the correlation between the measured value obtained by the test piece and that obtained by the direct method.
[0040] (Aggregation Method)
[0041] Using a commercially available kit for measuring HDL cholesterol in serum (Eiken Chemical Co., Ltd., product name HDL-C55), the measurement was carri...
PUM
 Abstract
Description
Claims
Application Information
 - R&D
- Intellectual Property
- Life Sciences
- Materials
- Tech Scout
- Unparalleled Data Quality
- Higher Quality Content
- 60% Fewer Hallucinations
Browse by: Latest US Patents, China's latest patents, Technical Efficacy Thesaurus, Application Domain, Technology Topic, Popular Technical Reports.
© 2025 PatSnap. All rights reserved.Legal|Privacy policy|Modern Slavery Act Transparency Statement|Sitemap|About US| Contact US: help@patsnap.com


