QTL "mapping as-you-go"

Active Publication Date: 2005-01-20
PIONEER HI BRED INT INC
View PDF3 Cites 56 Cited by
  • Summary
  • Abstract
  • Description
  • Claims
  • Application Information

AI Technical Summary

Benefits of technology

The present invention provides a novel approach to monitoring QTL effects in plant populations and performing marker assisted selection in the context of plant breeding programs. The methods of the invention, designated “Mapping As-You-Go,” involve recursively reestimating and validating estimates of the effects of various alleles of a QTL throughout the breeding process ensuring that the estimates of QTL effects, i.e., QTL allele effects, remain relevant across

Problems solved by technology

Conducting such breeding programs requires extensive resources.
Despite such significant investments of resources, there is evidence that the gains of the past will be difficult to sustain with current methods (Smith (1998), supra).
A number of factors increase the difficulty of successfully employing a marker-based selection scheme for complex traits.
One major problem has been

Method used


Image

  • QTL "mapping as-you-go"
  • QTL "mapping as-you-go"
  • QTL "mapping as-you-go"

Examples


example 1

Simulation of the Mapping-As-You-Go Strategy

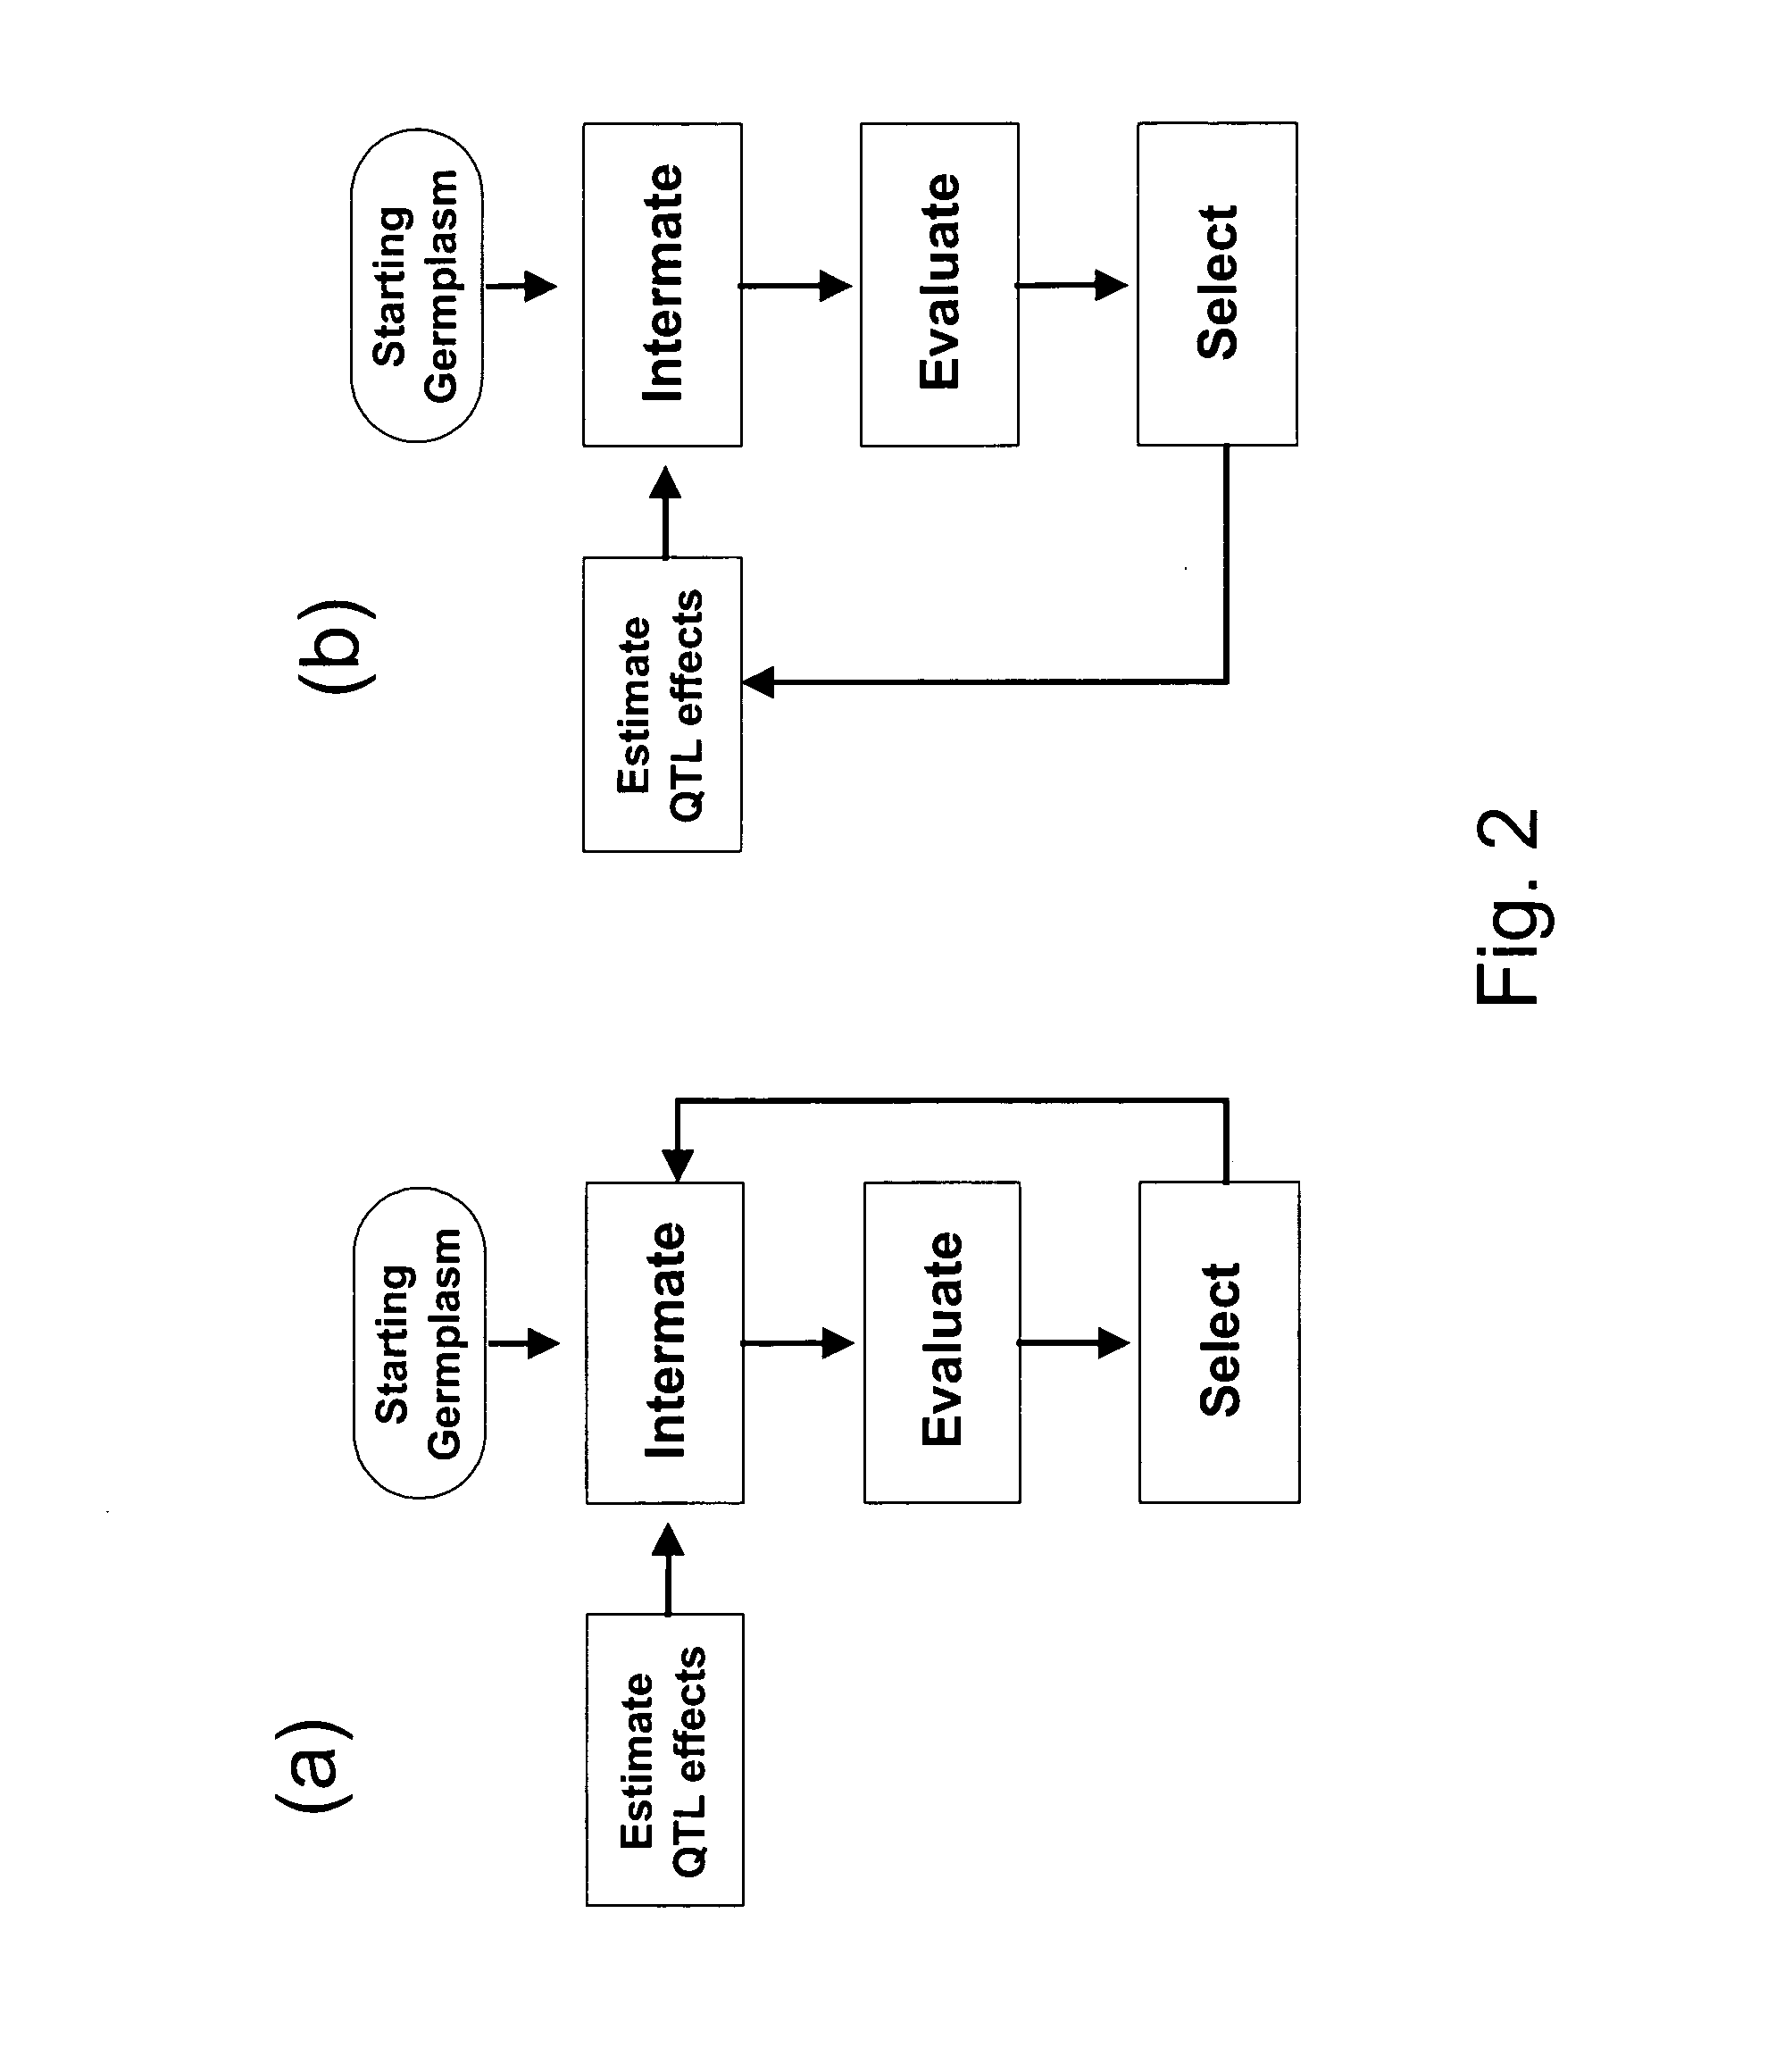
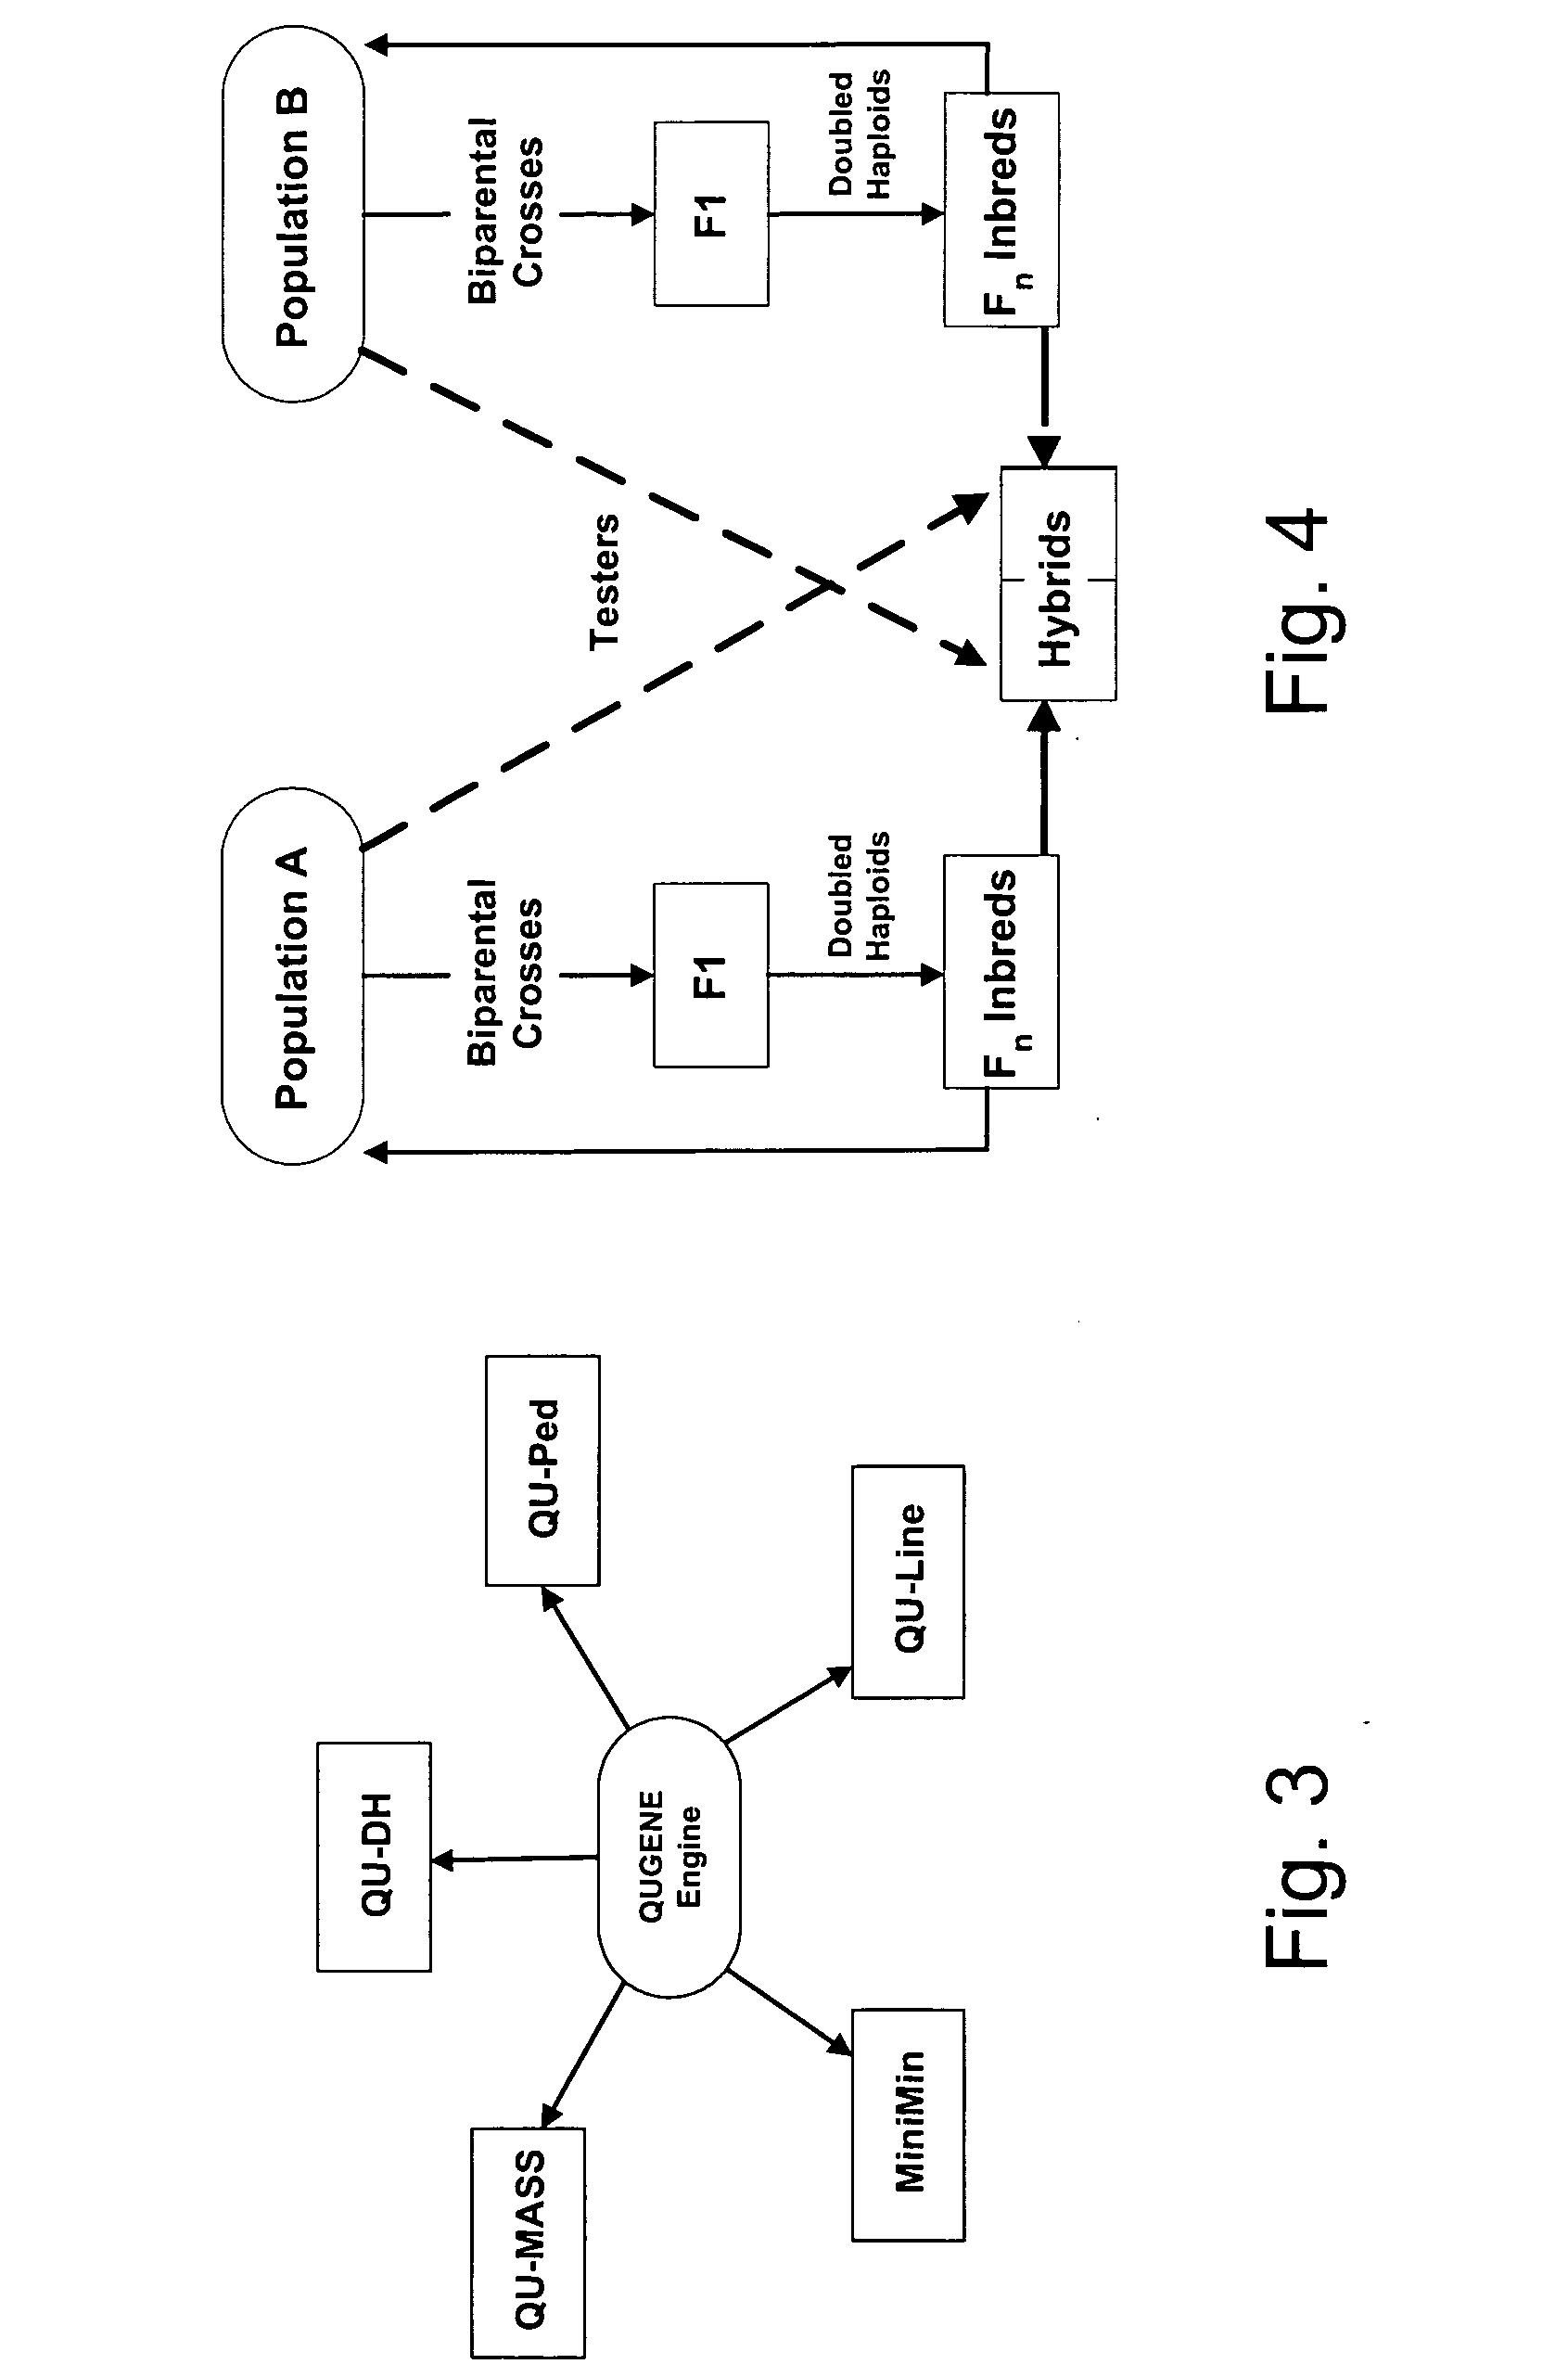
In this simulation, the MiniMin application module was run a series of times using a factorial combination of parameter values from the engine and application module. The MiniMin module implements a reciprocal recurrent breeding strategy as shown in FIG. 4. All genetic models have 24 independently segregating QTL (2 alleles per locus), each of which influences the trait on which selection was conducted.

Genetic effects were defined using the E(NK) notation (Cooper and Podlich, 2002). The value of K indicates the average number of loci that interact with a specified gene. For example, K=0 indicates that no other loci influence the genetic effects of the specified gene, that is, K=0 corresponds to an additive gene system. For K=1, digenic networks are in operation. For K=2, trigenic networks are in operation, etc. Heritability defines the level of error associated with the phenotype. Higher heritability values correspond to lower error le...

example 2

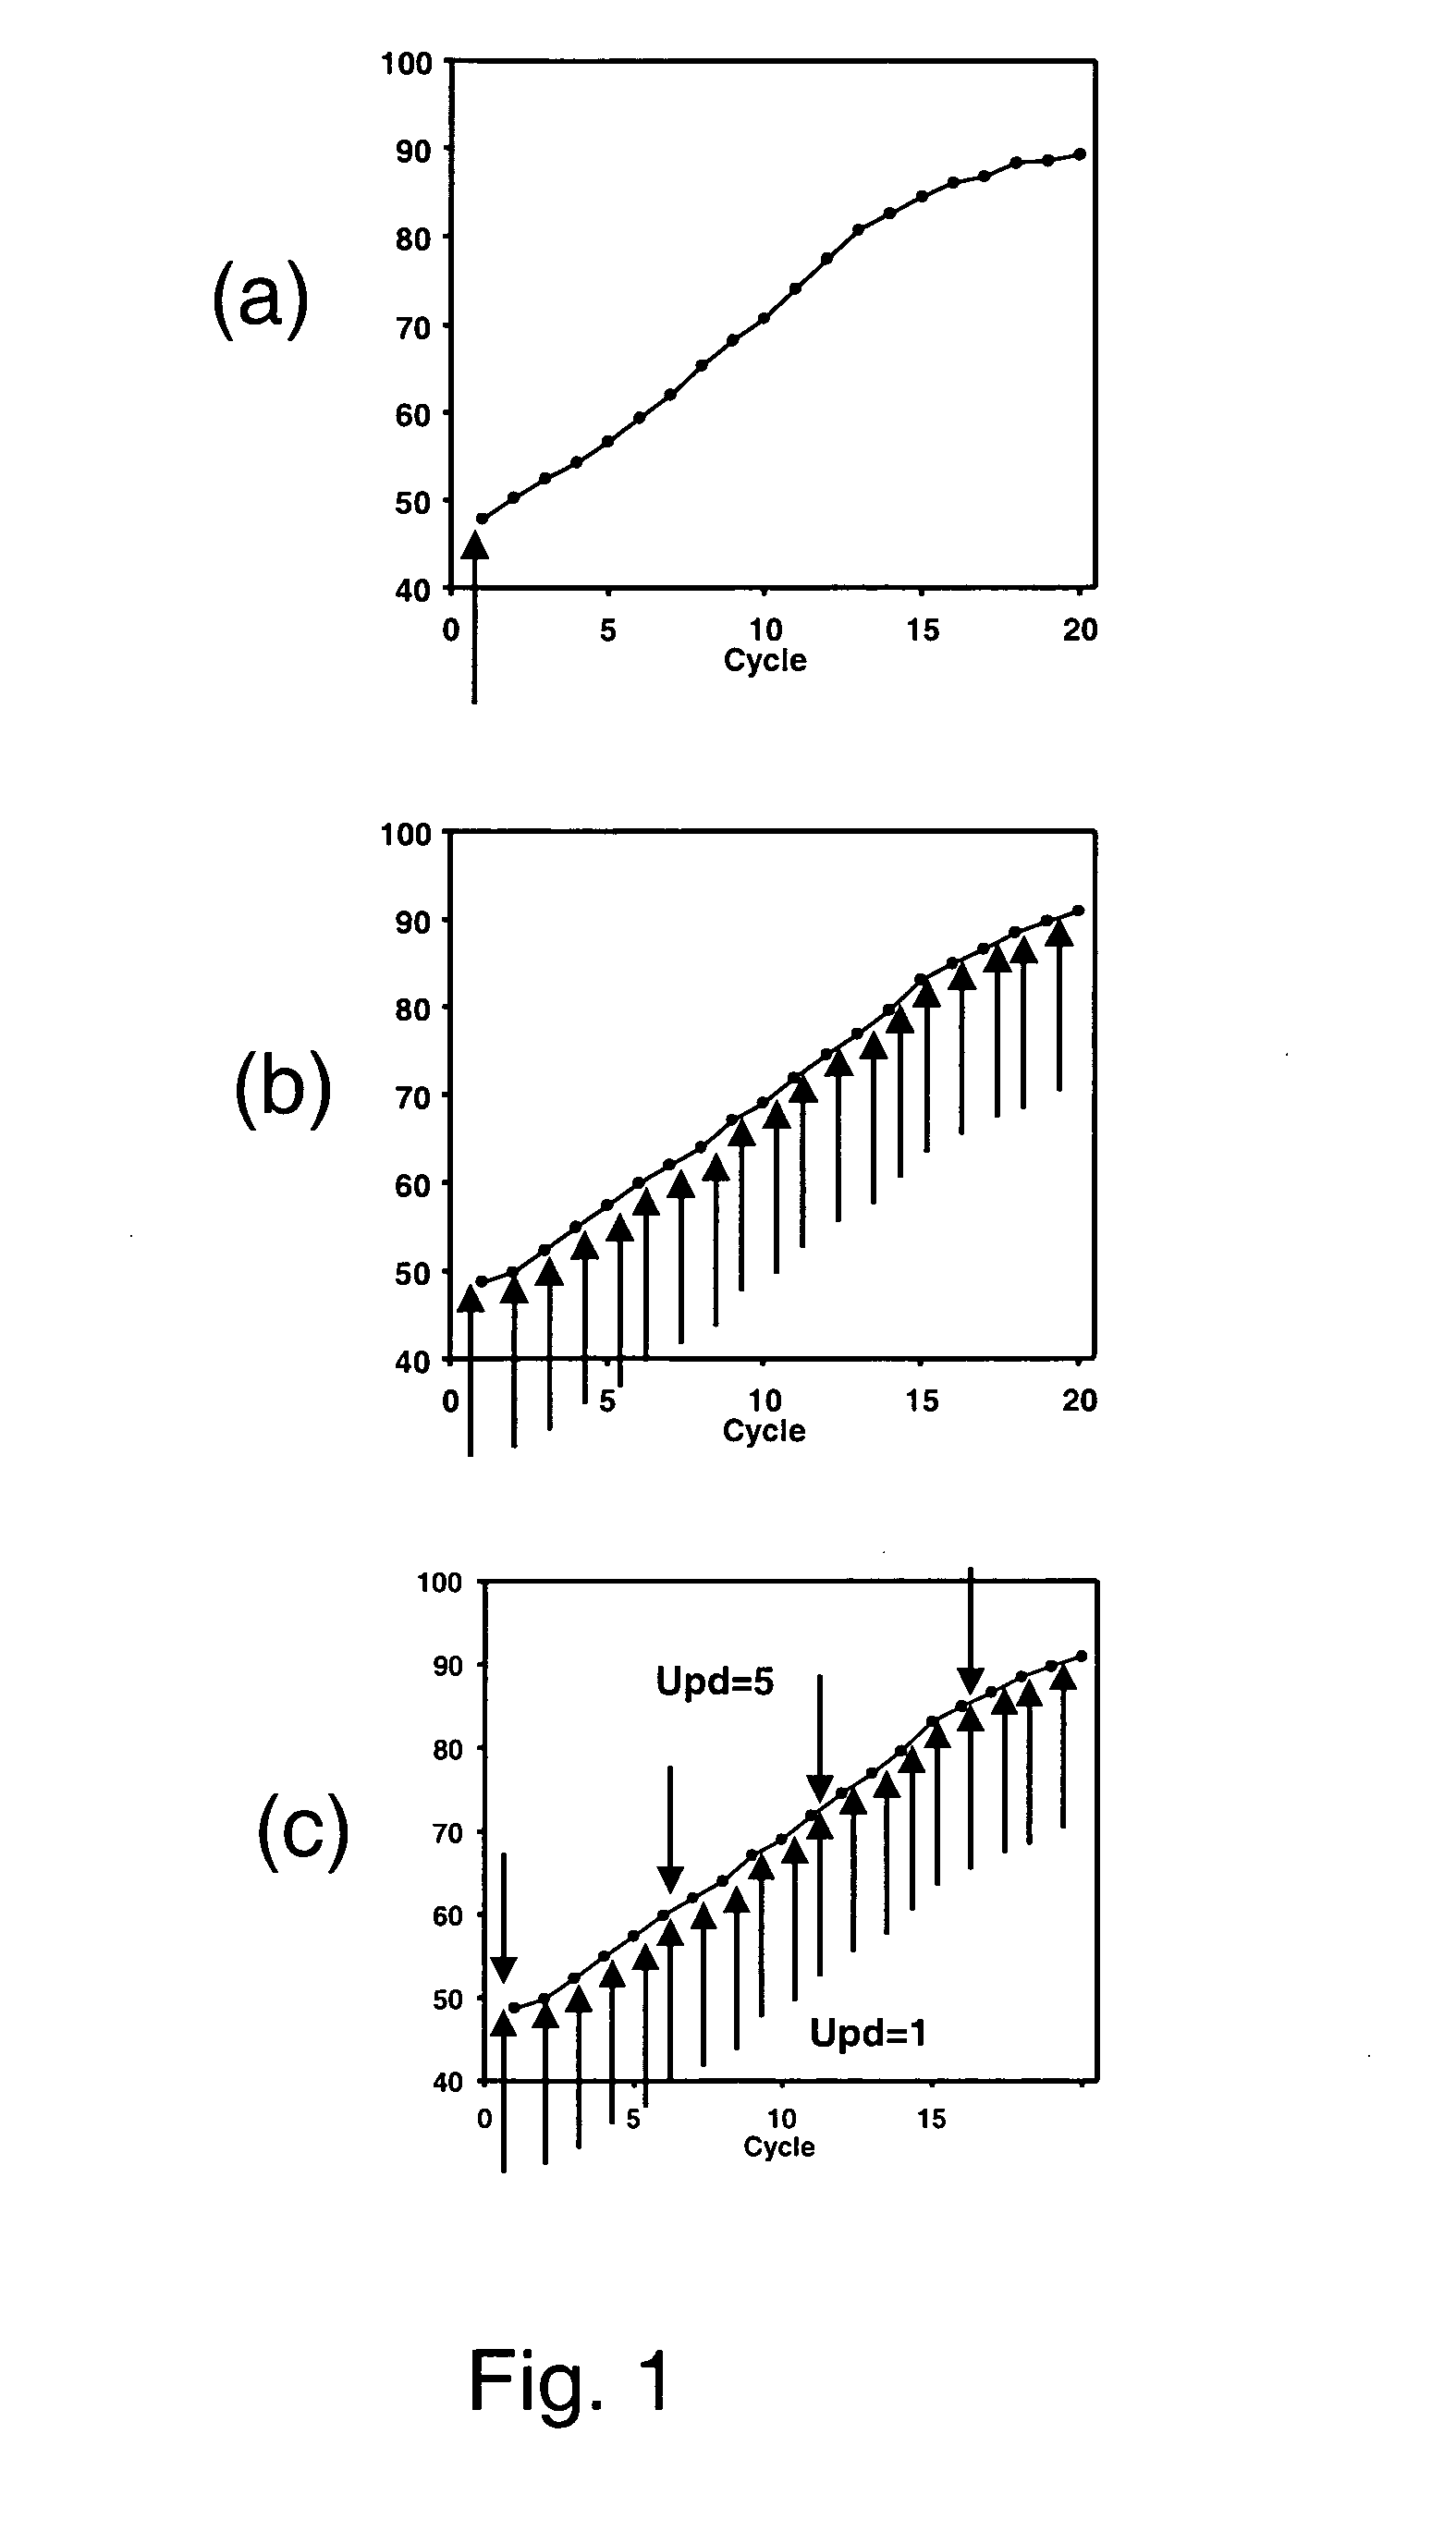
Comparison of Updating at Different Cycle Intervals in the Mapping-As-You-Go Strategy

This simulation investigated the power of the Mapping As-You-Go approach using different intervals of cycles to update QTL information. QTL effects were estimated at the start only, updated every cycle of the breeding program, or updated intermittently over the course of the breeding program (FIG. 1c). As described above, response was considered for a large range of genetic models and breeding scenarios.

As described in Example 1, the MiniMin module was run using a factorial combination of parameter values from the engine and application module. As above, all genetic models have 24 independently segregating QTL (2 alleles per locus), each of which exerts an influence on the phenotype.

Multiple levels of epistasis were evaluated: K=0 (additive) indicates that all genes were defined to have additive effects (i.e. the values of genotypes for one gene were not context dependent on the genotypes of o...

example 3

Application of the Mapping-As-You-Go Strategy to a Crop Growth and Development Model

Computer simulation using the QU-GENE software was employed to evaluate the Mapping As-You-Go approach to marker-assisted selection in a crop growth and development model. Gene-to-phenotype relationships were defined as described in Cooper et al (2002). Briefly, a look-up table of yield phenotypic values was computed prior to the simulation experiment. This table was created using a crop growth and development model to integrate the expression of four component traits (Transpiration Efficiency, Phenology, Osmotic Adjustment, Stay-green) within three general classes of environment type (Severe Terminal Stress, Mid-season Stress, Mild-terminal Stress). Numbers of genes and genetic effects were defined for each of the four component traits. The genetic effects were categorized into expression states for each of the traits. Thus, the gene-to-phenotype model was constructed such that specific genes infl...


PUM

PropertyMeasurementUnit
Correlation functionaaaaaaaaaa
Linkage disequilibriumaaaaaaaaaa

Abstract

This invention provides methods for monitoring QTL effects and marker assisted selection (MAS) involving providing a recursively determined correlation between one or more markers and a phenotype of interest.

Description

FIELD OF THE INVENTION The present invention relates to the mapping of phenotypic traits, e.g., QTL in plants. More particularly the present invention provides a method for efficiently mapping and selecting plants for phenotypic traits which are subject to the effects of epistasis and gene x environment interaction. BACKGROUND OF THE INVENTION Over the last 60 to 70 years, the contribution of plant breeding to agricultural productivity has been spectacular (Smith (1998)53rd Annual corn and sorghum research conference, American Seed Trade Association, Washington, D.C.; Duvick (1992) Maydica 37: 69). This has happened in large part because plant breeders have been adept at assimilating and integrating information from extensive evaluations of segregating progeny derived from multiple crosses of elite, inbred lines. Conducting such breeding programs requires extensive resources. A commercial maize breeder, for example, may evaluate 1,000 to 10,000 F3 topcrossed progeny derived from 1...

Claims


Application Information

Patent Timeline
IPC IPC(8): A01H1/04C12N15/82C12Q1/68G06F19/00
CPCC12Q1/68
Inventor PODLICH, DEANCOOPER, MARKWINKLER, CHRIS
Owner PIONEER HI BRED INT INC
Why Eureka
Try Eureka