Band distribution inspecting device and band distribution inspecting method

a technology for inspecting devices and bands, applied in the direction of frequency selective voltage/current level measurement, digital computer details, instruments, etc., can solve the problems of inability to determine data, long inspection time, complicated inspection apparatus, etc., and achieve simplified inspection devices, reduced inspection time, and suppressed inspection costs

Inactive Publication Date: 2005-03-17
MONTEREY RES LLC
View PDF3 Cites 5 Cited by
  • Summary
  • Abstract
  • Description
  • Claims
  • Application Information

AI Technical Summary

Benefits of technology

[0031] When the band distribution of the scattered oscillation signal is inspected, detailed data collection or data analysis necessary when the spectrum analyzer or digitizer is used is not necessary and only the band strength needs to be detected corresponding to the signal amplitude of a band pass signal or band signal for each frequency step, thereby the inspection time being reduced.
[0032] A high-speed, high-precision spectrum analyzer or digitizer, which is necessary when the fundamental frequency of a scattered oscillation signal is of a high frequency, is not necessary and no other high-speed, high-precision function circuit is needed if there is an oscillator section or frequency setting step of oscillating the fundamental oscillation signal with the fundamental frequency of a high frequency. Consequently, a general purpose inspecting device can be used and no additional device or additional step is needed except that the oscillator section or frequency setting step for achieving the fundamental frequency of a high frequency is provided. Thus, the inspecting device can be simplified and the inspection cost can be suppressed.

Problems solved by technology

However, although the conventional measuring method is an effective method if detailed data analysis is necessary on development stage or fault analysis stage or the like, it comes that data unnecessary for determination on whether or not the outgoing inspection on a device is acceptable is also acquired.
Thus, it takes long hours to acquire such unnecessary data and process the acquired data, so that it takes a long inspection time for the outgoing inspection, which is a problem to be solved.
The inspection apparatus having such a function are expensive and if these functions are provided separately from the general purpose inspecting device, the inspecting apparatus may be complicated.
Consequently, an increase in inspection cost on the outgoing inspection is induced.
It may take long hours to exchange command and data through the interface even if the measurement by the analyzer is completed, so that the inspection time may be increased.
The reason why this method is adopted is that a method for compensating for data by sampling every cycle and deviating the sampling timing gradually is incapable of catching up the frequency variation.

Method used


Image

  • Band distribution inspecting device and band distribution inspecting method
  • Band distribution inspecting device and band distribution inspecting method
  • Band distribution inspecting device and band distribution inspecting method

Examples


first embodiment

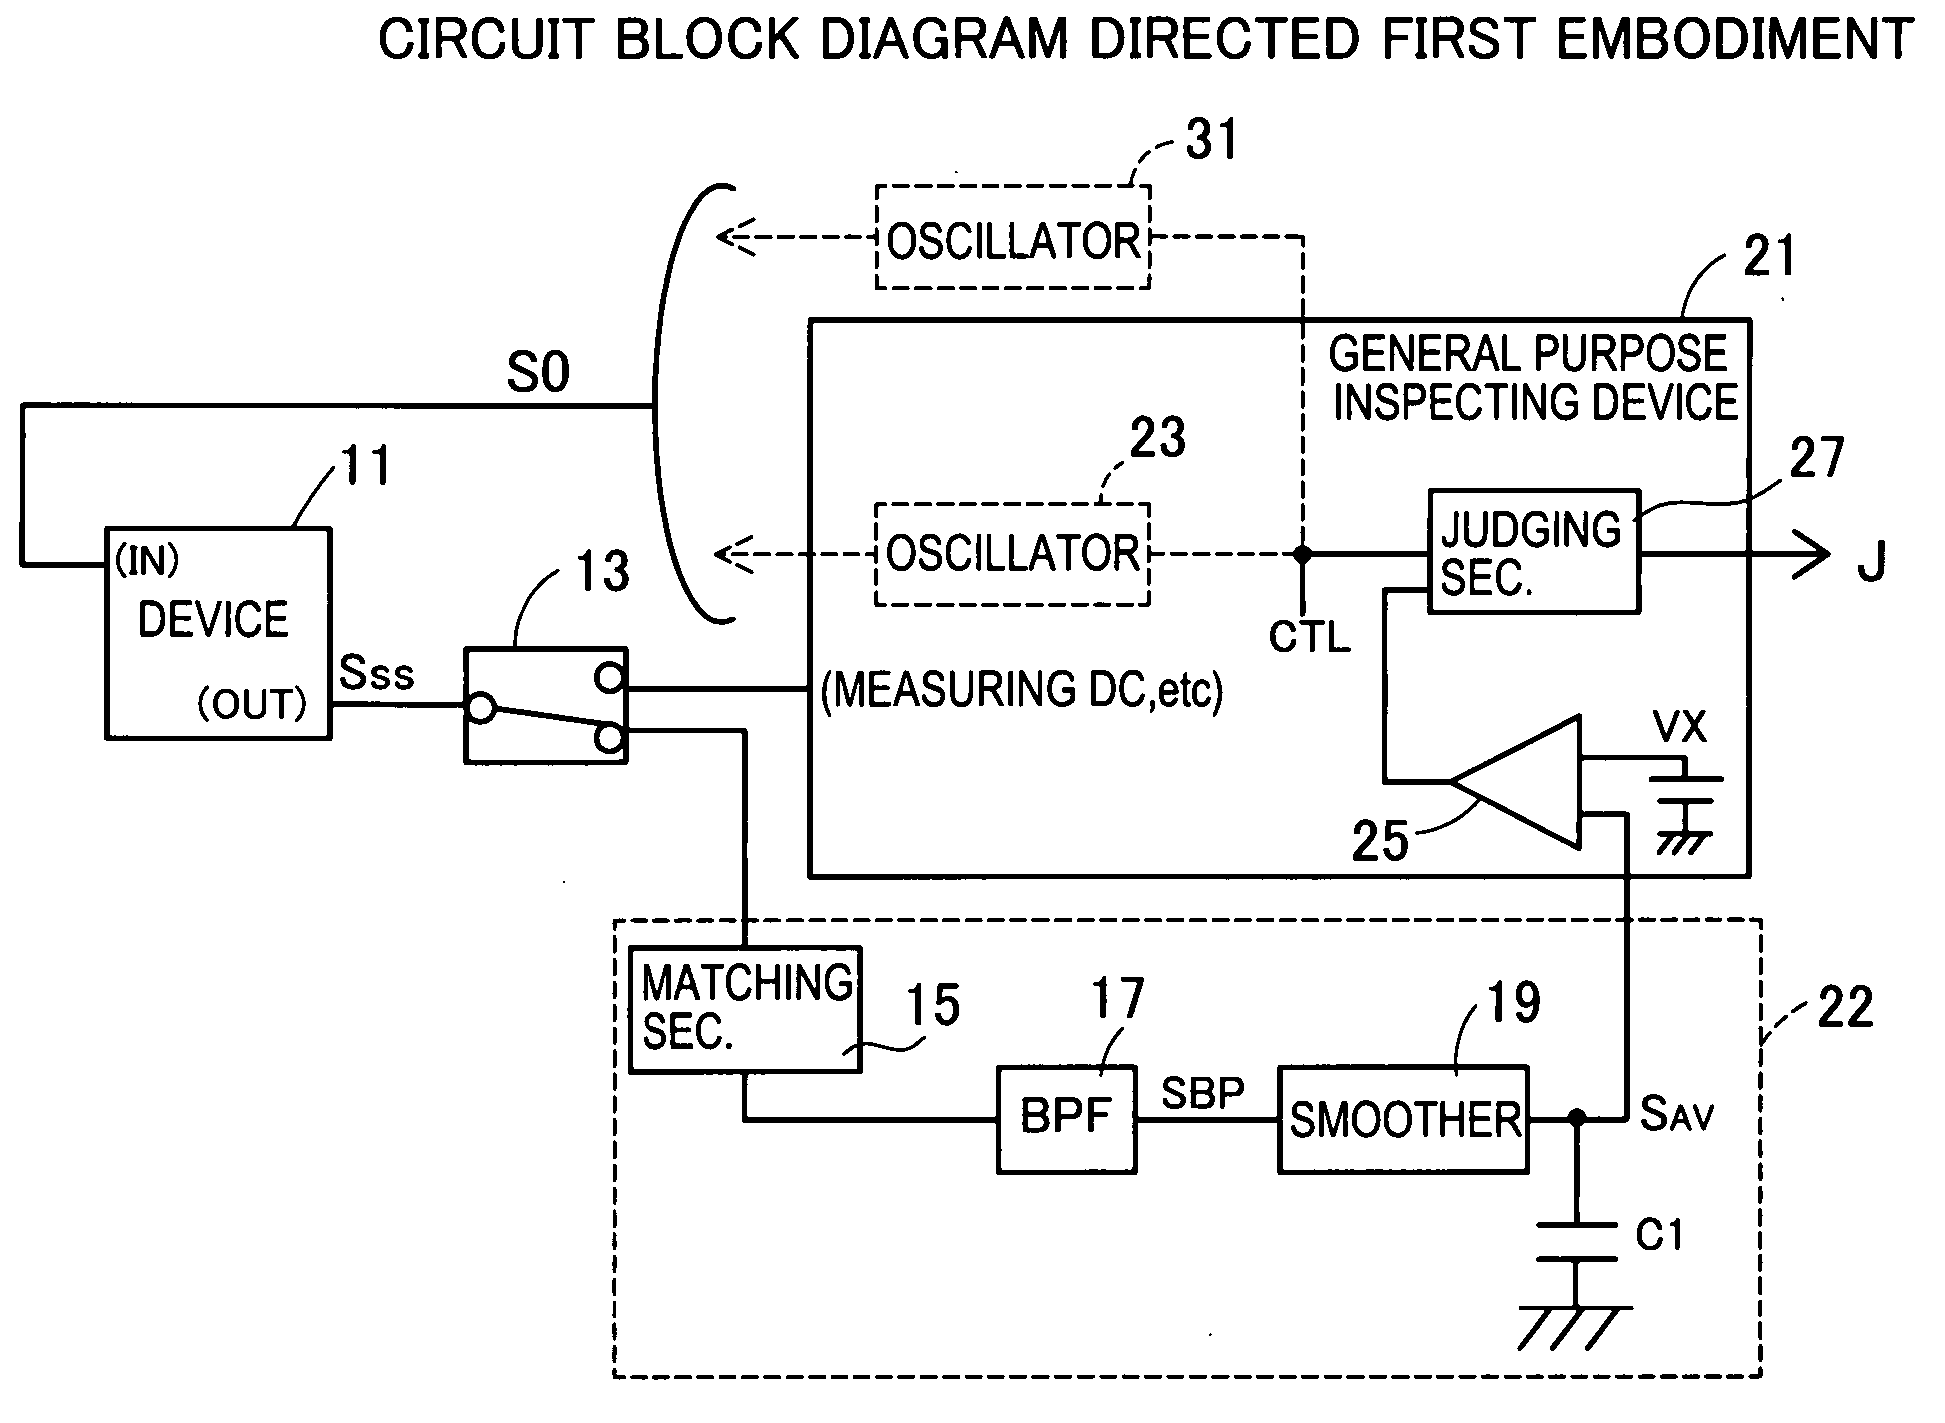
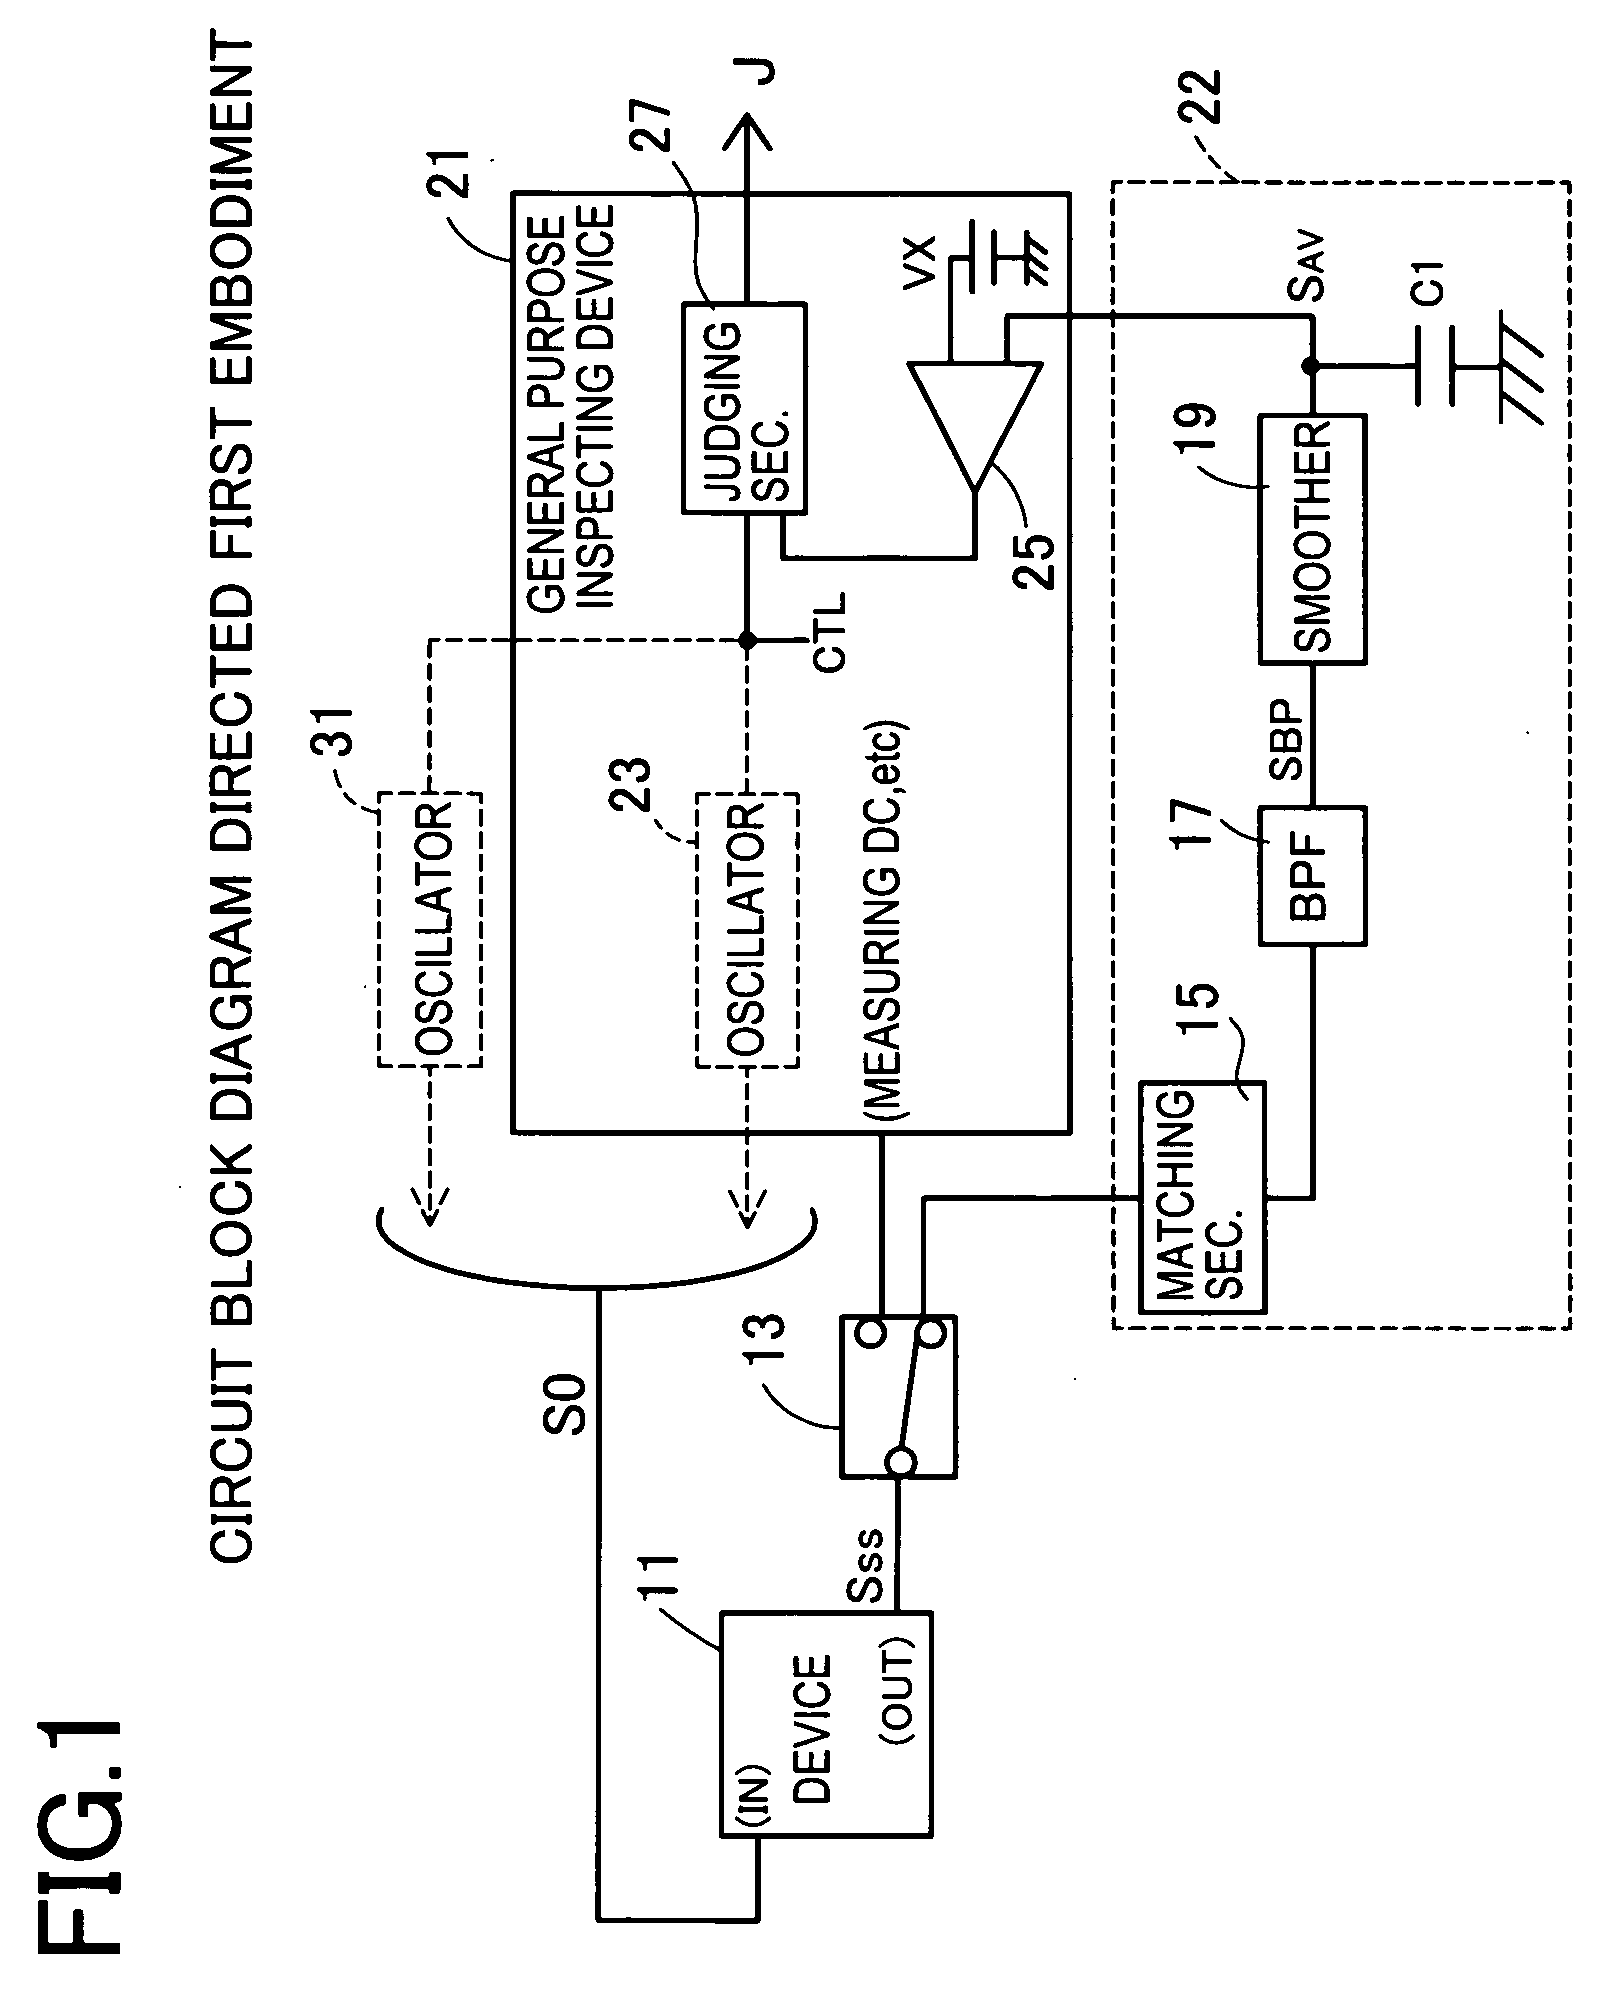
[0045]FIG. 1 is a circuit block diagram of a band distribution inspecting device of the This figure shows a spectrum scattering clock generator (hereinafter referred to as SSCG) device 11 in which the scattered oscillation signal SSS in which the oscillation frequency is scattered is outputted from an OUT terminal to the fundamental oscillation signal s0 of a fundamental frequency f0 inputted to an IN terminal.

[0046] The OUT terminal of a device 11 is connected to a general purpose inspecting device 21 or a band distribution detecting section 22 through a relay 13. The connection to the general purpose inspecting device 21 is for DC measurement about input / output voltage, current and the like on the OUT terminal. The connection to the band distribution detecting section 22 is for inspecting the band distribution on the oscillation frequency in the scattered oscillation signal SSS outputted from the OUT terminal. The band distribution detecting section 22 is a section for detecting ...

second embodiment

[0070]FIG. 5 shows an example of an inspection method for inspecting the band distribution of the scattered oscillation signal SSS in the band distribution inspecting device (FIG. 4) of the A following description will be carried out with reference to the band distribution inspecting device shown in FIG. 4.

[0071] Because according to the second embodiment, the fundamental frequency of the fundamental oscillation signal S0 is fixed to f0, the scattered oscillation signal SSS varies in frequency with a deflection width ΔfSS with respect to the fundamental frequency f0. Therefore, only a pair of switches of plural switches ( . . . 12A-12E, . . . ), ( . . . 14A-14E . . . .) are turned ON. and the switches are changed over successively. Consequently, only a filter of plural band pass filters ( . . . 17A-17E, . . . ) is selected successively and the inspection is carried out by shifting the pass band successively within the band of the scattered oscillation signal SSS.

[0072] In step 11 ...

third embodiment

[0098] According to the band distribution inspecting device and band distribution inspecting method of the third embodiment, the period of the frequency variation of the scattered oscillation signal SSS can be detected according to the frequency of the swell of the RMS output which is an output signal from the smoother 19 by providing with the frequency counter 42 which is an example of the frequency counter. Further a change in signal of the RMS output is analyzed by providing with the digitizer 51, which is an example of the frequency analyzer so that the characteristic of the frequency variation in the scattered oscillation signal SSS can be detected. The period of the frequency variation in the scattered oscillation signal SSS which varies in frequency, the symmetry of its deflection, distortion in waveform generated upon the deflection and the like are detected as the signal strength.

[0099] According to the first and second embodiments, the spectrum analyzer or digitizer is not...


PUM


Abstract

An object of this invention is to provide a band distribution inspecting device and band distribution inspecting method capable of carrying out inspection on whether or not a scattered oscillation signal oscillated containing a frequency variation from the fundamental frequency with the fundamental frequency as a reference point has a band distribution rapidly, with a simple way and at a cheap price. A scattered oscillation signal SSS inputted to a band distribution detecting section 22 is outputted as a predetermined band pass signal SBP through a band pass filter 17 having a predetermined pass band of a predetermined narrow-band width Δf within a band distribution. This signal is converted to a root-mean-square value by a smoother 19, smoothed by a capacitor C1 and transferred to a general purpose inspecting device 21 as a DC signal SAV. The DC signal SAV is compared with a predetermined voltage value VX by a comparator 25 and its comparison result is judged by a judging section 25 and then, an inspection result is outputted as a judging signal J. As a result, an edge frequency in the band distribution of the scattered oscillation signal SSS and disturbance of frequency variation within/out of the band and dullness in waveform and the like can be inspected for.

Description

CROSS-REFERENCE TO RELATED APPLICATIONS [0001] This application is based upon and claims the benefit of priority from each of the prior Japanese Patent Application No. 2003-319243 filed on Sep. 11, 2003, the entire contents of which are incorporated herein by reference. BACKGROUND OF THE INVENTION [0002] 1. Field of the Invention [0003] The present invention relates to a band distribution inspecting device and band distribution inspecting method for measuring a frequency distribution in a scattered oscillation signal oscillated containing a frequency variation from the fundamental frequency and particularly, to a band distribution inspecting device and band distribution inspecting method for determining a band distribution in the frequency variation in a short time. [0004] 2. Description of Related Art [0005] In recent years, electronic apparatuses such as personals computer and printers have become highly functional so that high-speed operation and high-density integration have bee...

Claims


Application Information

Patent Timeline
Patent Type & Authority Applications(United States)
IPC IPC(8): G01R23/165G01R19/00G01R23/00G01R31/28
CPCG01R31/2824G01R19/0007
Inventor ONO, YASUKAZUOKADA, KOJIMATSUNAMI, HIROYUKI
Owner MONTEREY RES LLC
Why Eureka
Try Eureka