Network analysis tool

a network analysis and tool technology, applied in the field of data analysis, can solve the problems of inability to actually “analyze” the data captured by the analyzer, inability to analyze the data by and high time consumption of manual or brute force analysis of these traces, so as to facilitate more efficient and thorough analysis of measured components

Active Publication Date: 2005-03-17
VIAVI SOLUTIONS INC
View PDF20 Cites 207 Cited by
  • Summary
  • Abstract
  • Description
  • Claims
  • Application Information

AI Technical Summary

Benefits of technology

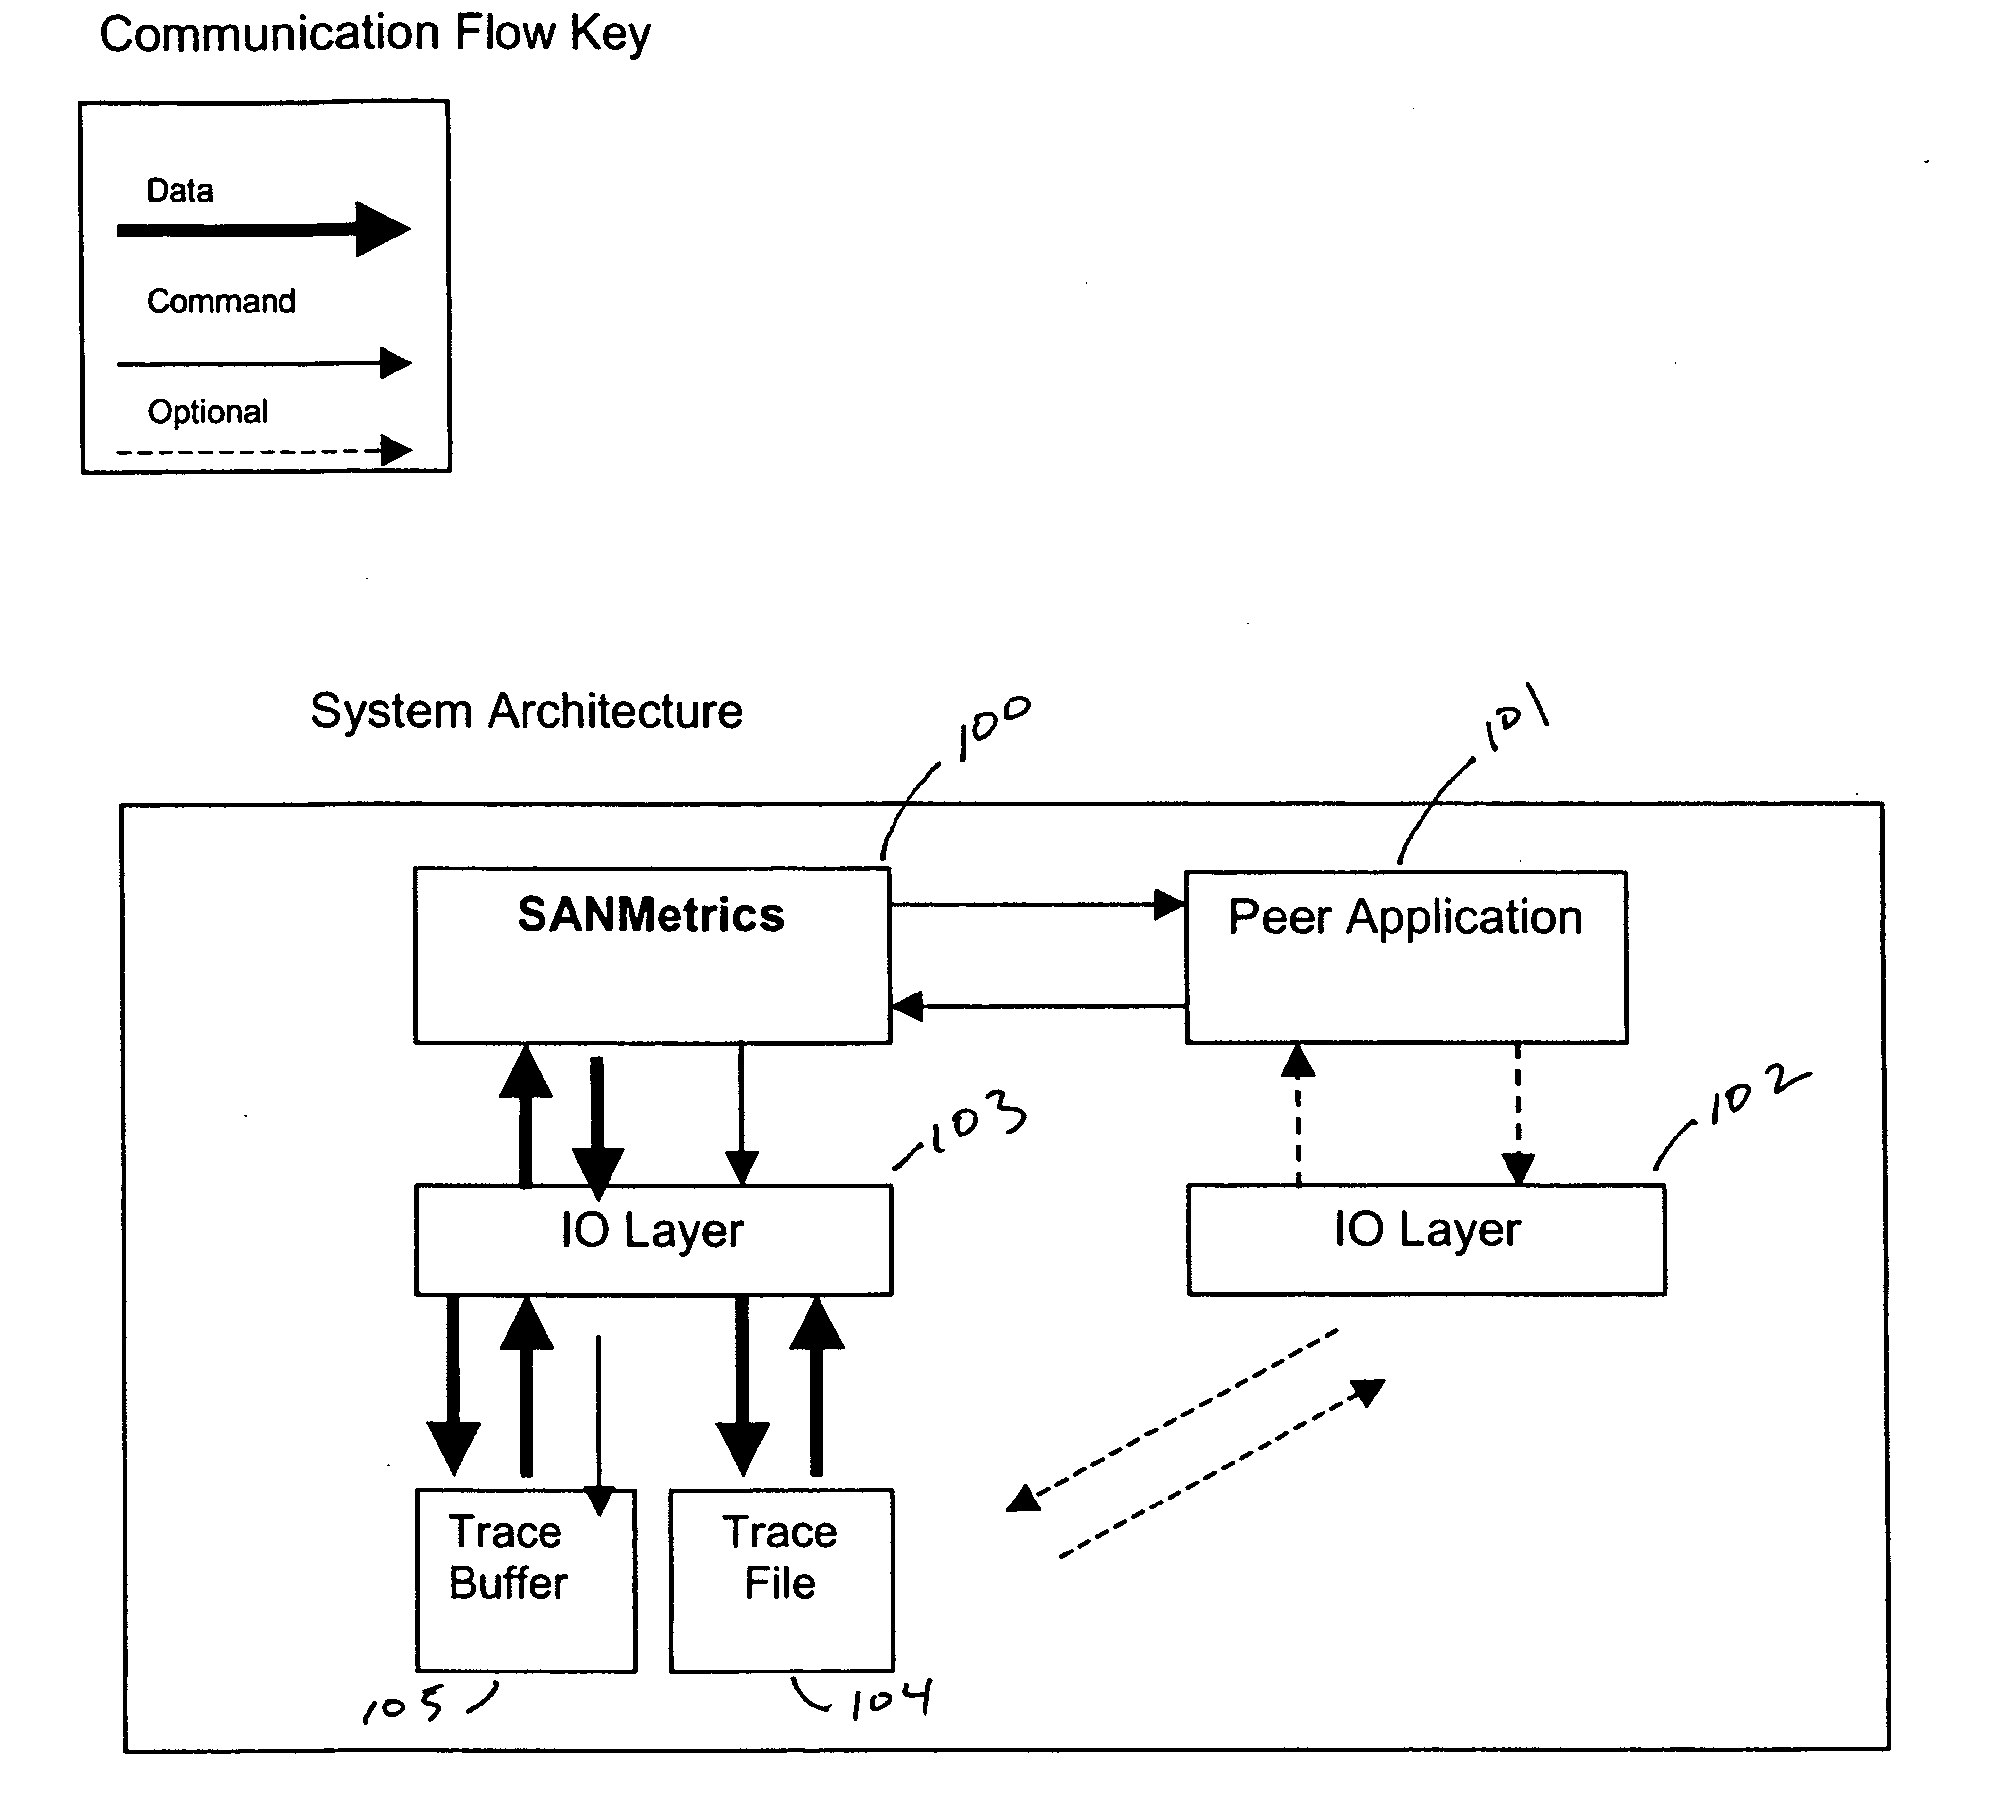
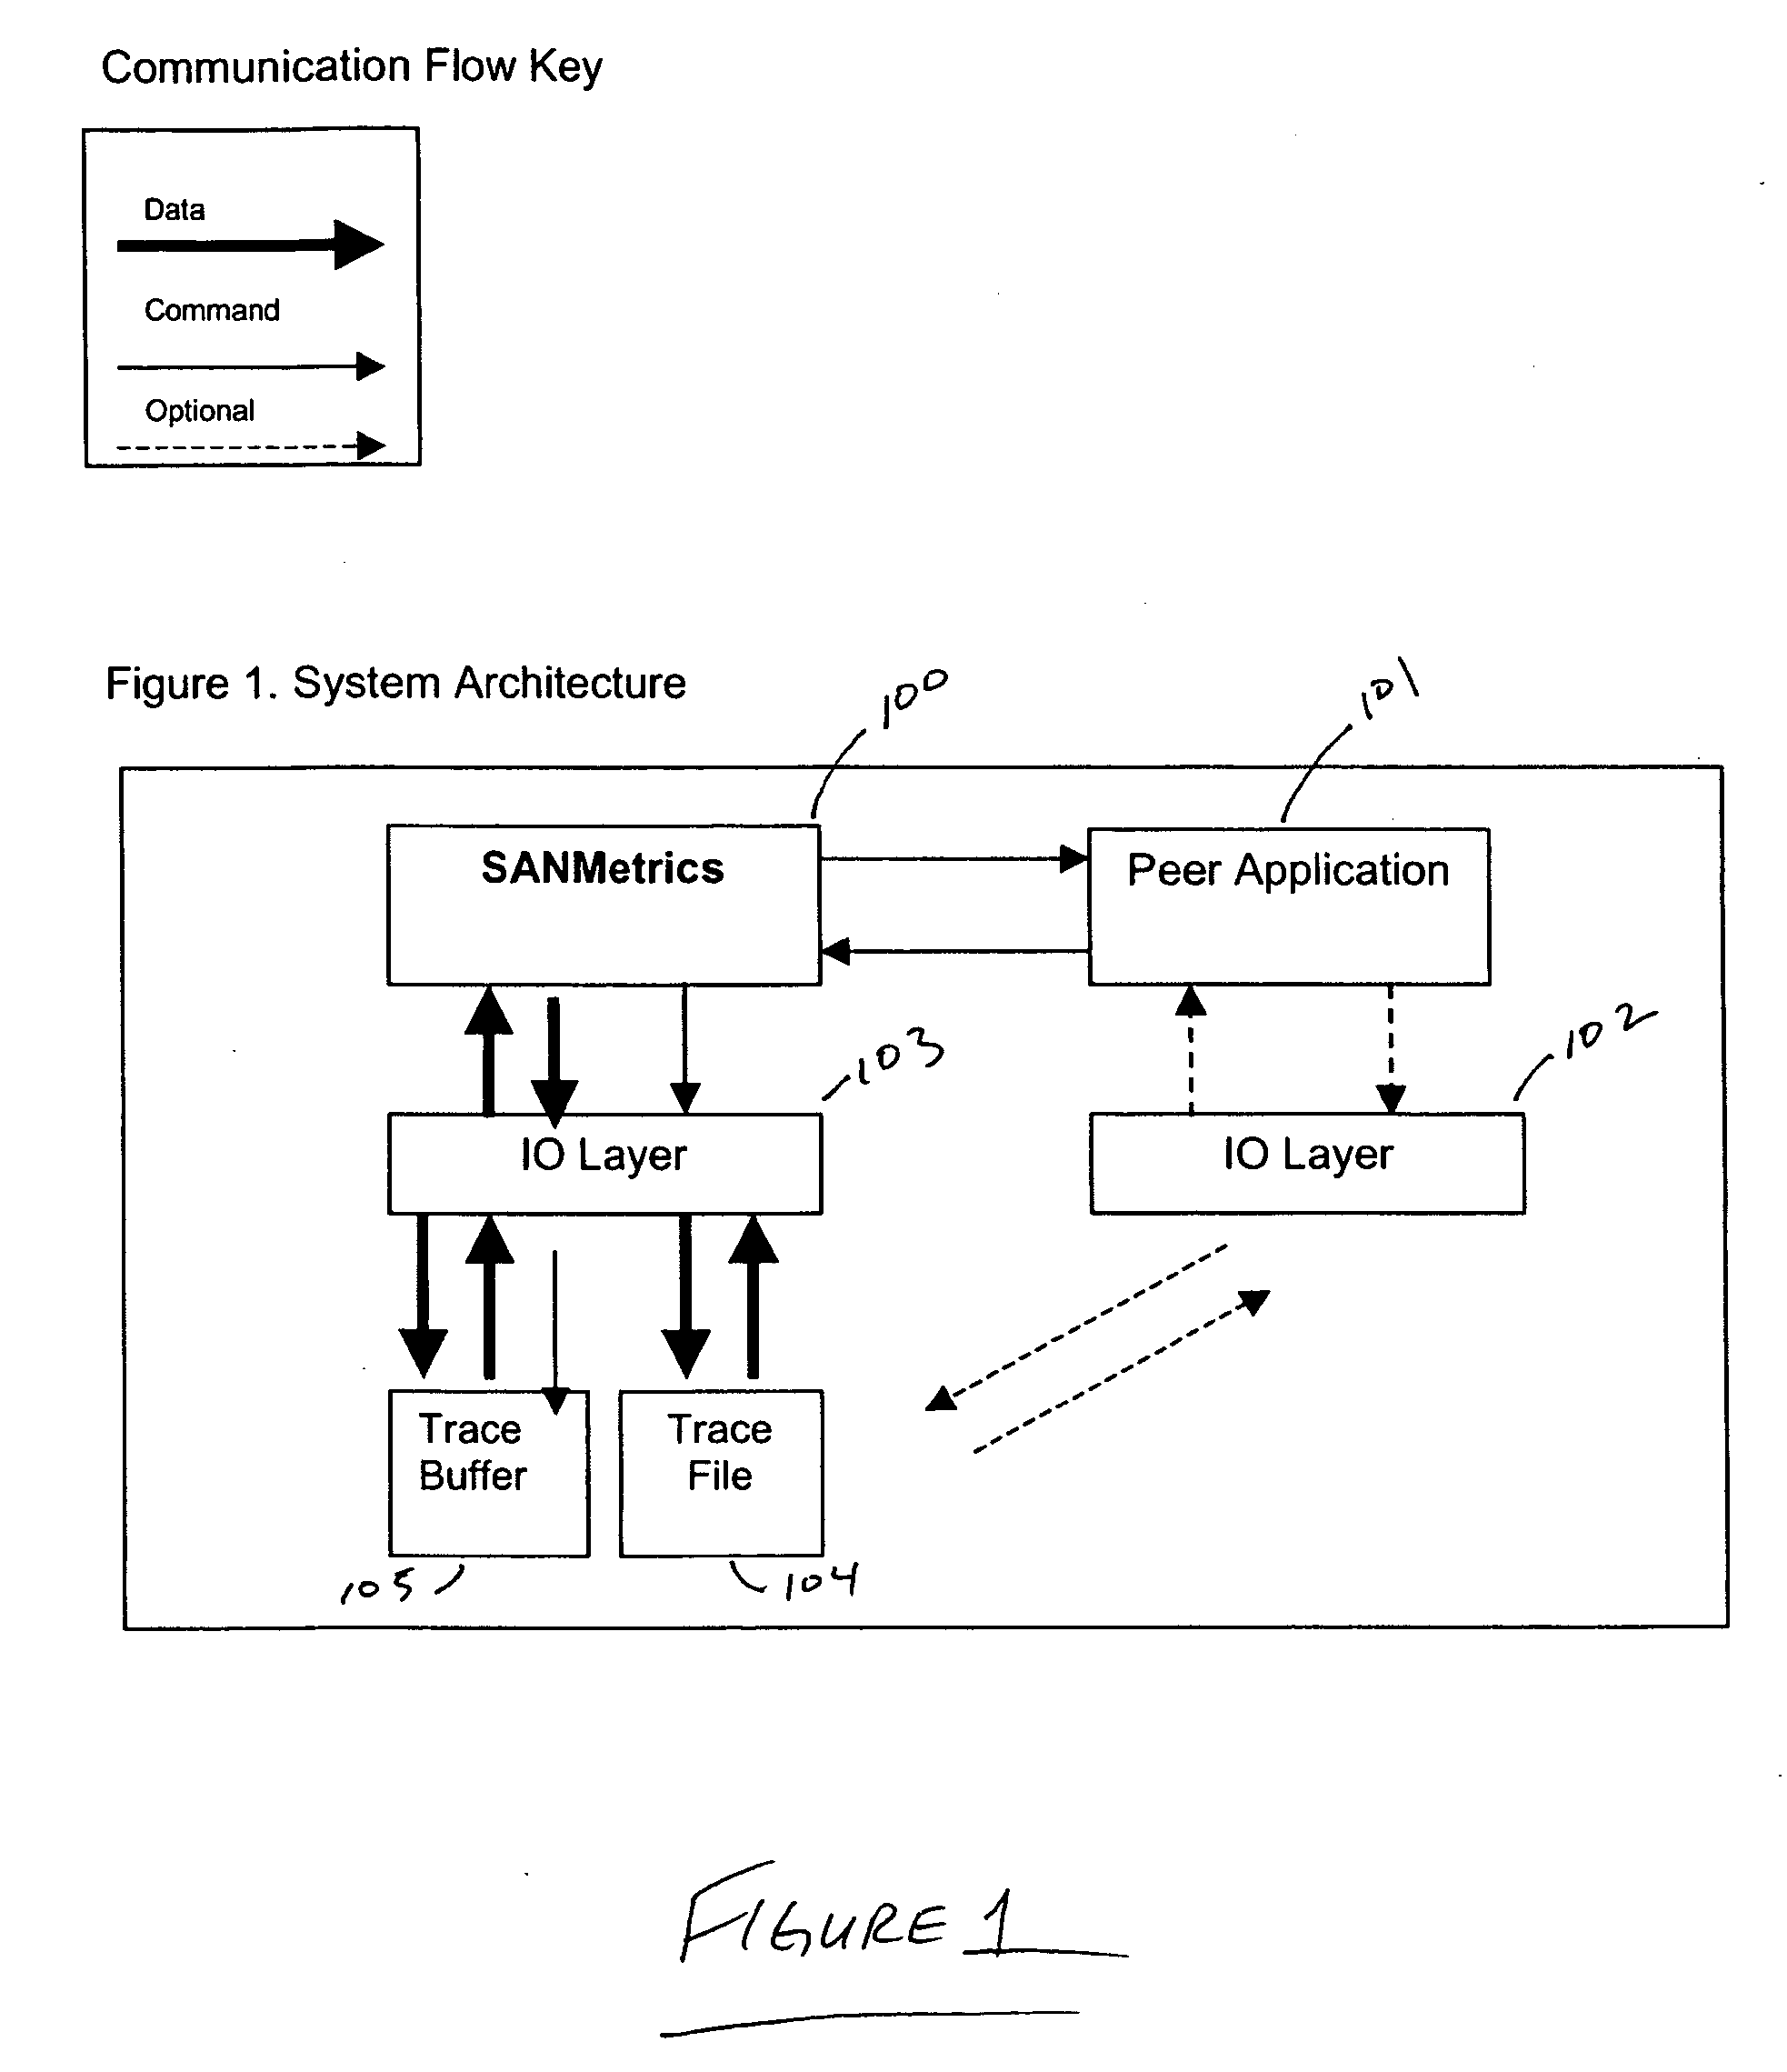
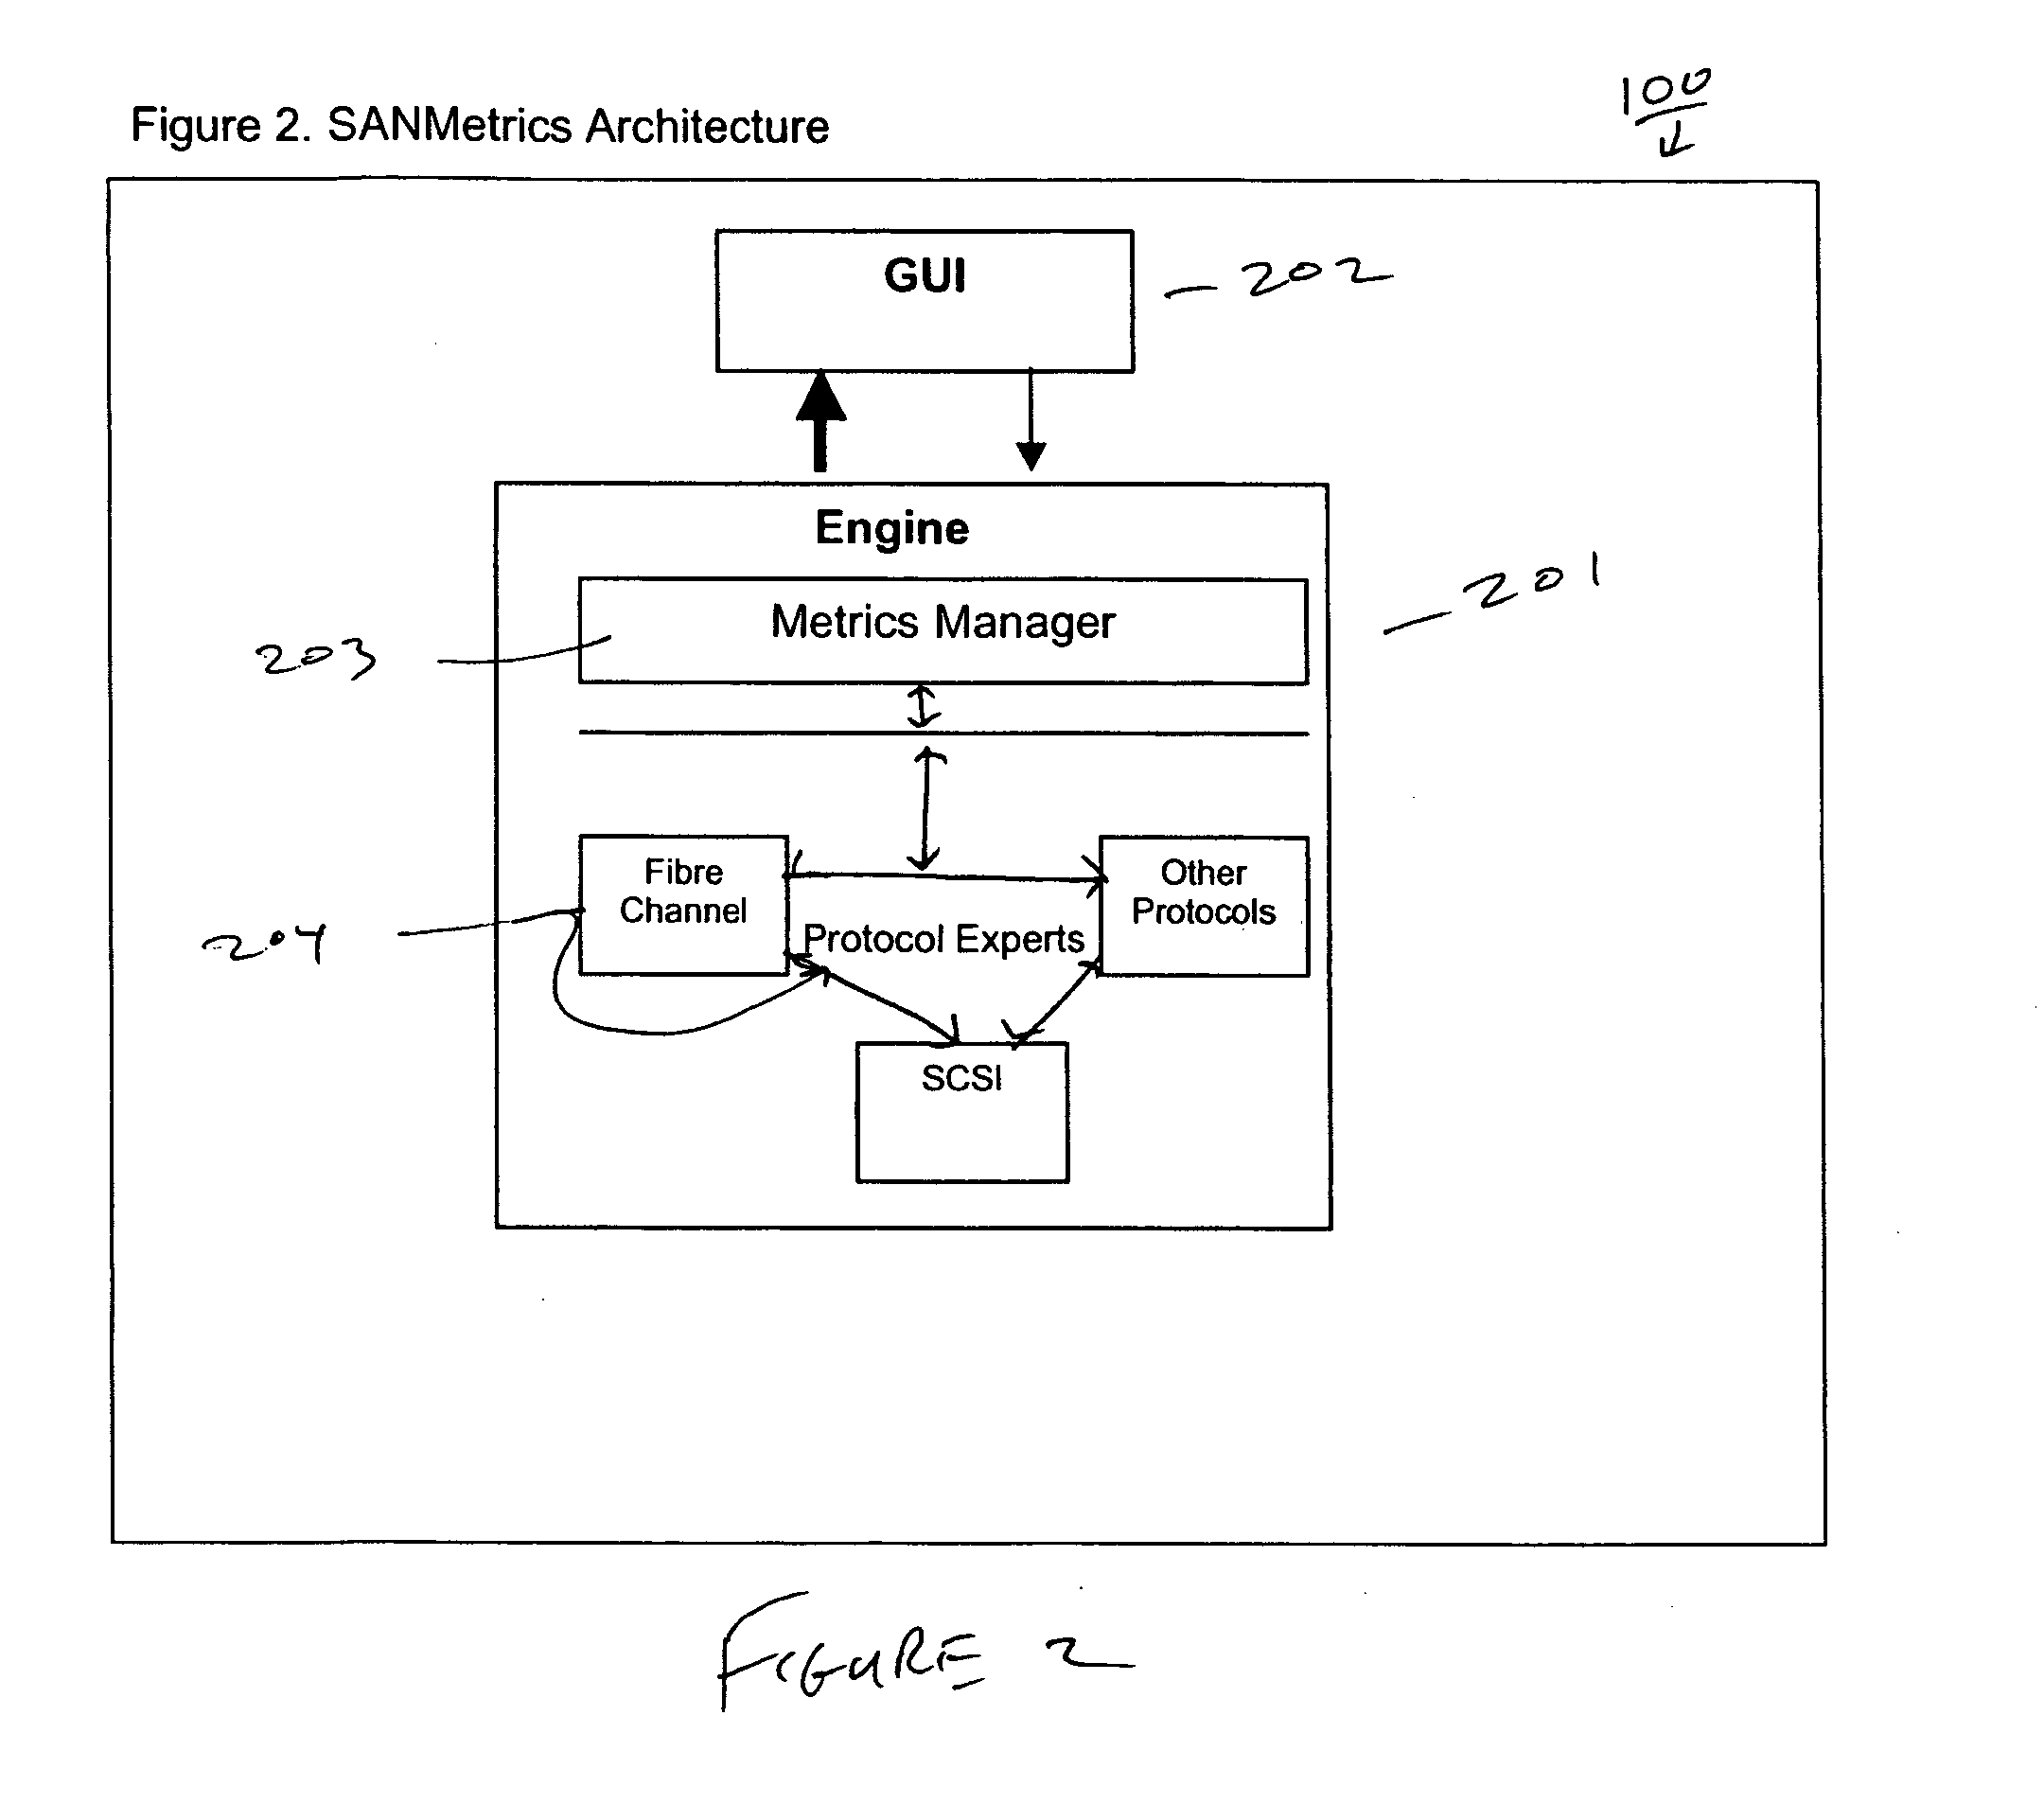
[0013] Embodiments of the invention further provide a software package configured as an expert analysis tool for FC, FCP-SCSI, Gigabit Ethernet, IP, TCP, FCIP and iSCSI traffic captured with a protocol analyzer. Traces from any valid Gigabit Ethernet topology or FC topology (arbitrated loop, public loop, Switch Fabric, etc.) are supported by the software package of the invention. The package is primarily designed for SCSI (FCP-SCSI and iSCSI) analysis and the transport layers that deliver SCSI data on high-speed FC and Gigabit Ethernet links, however, the package may also be used for other FC protocols (FICON, VI, IP) as well as any embedded Gigabit Ethernet protocol. Further, the package is configured to be expanded to cover essentially any desired topology or protocol. The package includes a plurality of expert analysis advanced protocol debugging and performance analysis features. In operation, the package processes collected trace data, rebuilding upper layer protocols to allow for detailed analysis of all protocols present within the trace. From the processed data, the package may present three main views of trace data. Each of these views allow for detailed error, behavioral, and statistical analysis of occurrences within the trace. These views are designed to facilitate more efficient and thorough analysis of measured components. The three views may generally be describes as a Debug View, which provides a topological layout of the network and a list of expert errors and warnings found within the trace data. The package includes over 600 implemented Error, Warning and Informational Events covering everything from violations in protocol to signaling issues. Another view is the Graph View, which presents a time based view of the trace in a single graph. Over 700 different metrics can be added to the graph to allow for analysis of behaviors and performance of devices. The measurements allow for detailed analysis of single pairs of devices. The user can drill into the trace through simple zooming techniques to further identify behaviors in the trace. Another view is the Report view, which presents summary and detailed reports showing behavior throughout the entire trace or current zoom within the trace. This view can also produce pending exchange reports detailing FC, FCP-SCSI, TCP, and iSCSI open conversations for any location within a trace.

Problems solved by technology

As a result, networks present a complicated arrangement of devices in various topologies capable of supporting different protocols.
Performance statistics relate to quality of service issues, such as traffic delays, the number of packet collisions, and the number of message packets dropped.
One limitation with many existing protocol analyzers is that such analyzers do not actually “analyze” the data captured by the analyzer.
Since a trace file may easily contain several million entries, manual or brute force analysis of these traces is extremely time consuming.
Trace viewers often allow the administrator to search through the trace for specific commands or lists of associated commands, however, the trace viewers do not assist the user with any analysis other than to find particular types of commands that the user searches for.
Unfortunately, the continued rapid growth in network installations and expansions often requires that less experienced personnel be made responsible for administration, and as such, the analysis process is further complicated and degraded in quality.
Another limitation with conventional tools that perform a very limited degree of real intelligent analysis (as opposed to merely capturing data) do not support numerous data transmission technologies (including several emerging and popular technologies) such as FC.
However, system performance limitations may be introduced as a result of inefficient system configuration, e.g., where a legacy device on a network bus determines the overall bus speed.

Method used


Image

  • Network analysis tool
  • Network analysis tool
  • Network analysis tool

Examples


Embodiment Construction

[0028] Definitions

[0029] Prior to discussing embodiments of the invention, it may be helpful to establish some definitions for terms used in the network analysis art. The following definitions are applicable to embodiments of the invention: frame, CONTEXT [Fibre Channel], An ordered vector of words that is the basic unit of data transmission in a Fibre Channel network. A Fibre Channel frame consists of a Start of Frame Word (SOF) (40 bits); a Frame Header (8 Words or 320 bits); data (0 to 524 Words or 0 to 2192 ten bit encoded bytes; a CRC (One Word or 40 bits); and an End of Frame (EOF) (40 bits). cf. data frame; frame content, CONTEXT [Fibre Channel], The information contained in a frame between its Start-of-Frame and End-of-Frame delimiters, excluding the delimiters; FC-1, CONTEXT [Fibre Channel], The Fibre Channel protocol level that encompasses 8B / 10B encoding, and transmission protocol. Specified in FC-PH; FC-2, CONTEXT [Fibre Channel], The Fibre Channel protocol level that e...


PUM


Abstract

Embodiments of the invention provide a method for determining errors and metrics in a computer network. The method includes positioning an analyzer in communication with the network, capturing a data trace of the network with the analyzer, determining a network device topology from a first processing of the data trace, building user layer protocols using a second processing of the data trace and the determined device topology, determining errors in the network device topology using protocol experts applied to the user layer protocols in conjunction with the determined device topology, and displaying at least one of the device topology and the determined errors to a user.

Description

BACKGROUND OF THE INVENTION [0001] 1. Field of the Invention [0002] The present invention generally relates to data analysis, and more particularly, the present invention relates to intelligent analysis of one or more traces received from a protocol analyzer in communication with data transfer or storage network. [0003] 2. Description of the Related Art [0004] Networks represent shared access arrangements in which several network devices, such as computers or workstations (collectively termed “stations”), are interconnected by a common communications medium that allows the users of the stations to share computing resources, such as file servers, printers, and storage, as well as application software and user work product. The communication medium between the stations may be wired, such as coaxial, twisted pair, or fiber optic cable, or a wireless communications medium, such as cellular or radio frequency (RF) transmission systems. The respective networks may range from bridged segme...

Claims


Application Information

Patent Timeline
Patent Type & Authority Applications(United States)
IPC IPC(8): G06F11/00G06F11/25G06F11/273
CPCG06F11/2294G06F11/2257
Inventor KLOTZ, STEVEMANN, JASON DAVIDMCDANIEL, TIMOTHY LANE
Owner VIAVI SOLUTIONS INC
Why Eureka
Try Eureka