
Method for selecting drug sensitivity-determining factors and method for predicting drug sensitivity using the selected factors

a drug sensitivity and factor technology, applied in the field of selecting drug sensitivitydetermining factors and predicting drug sensitivity using selected factors, can solve the problem that the method has not yet been developed

Inactive Publication Date: 2005-06-02
F HOFFMANN LA ROCHE & CO AG
View PDF2 Cites 11 Cited by
  • Summary
  • Abstract
  • Description
  • Claims
  • Application Information

AI Technical Summary

Benefits of technology

[0007] The present invention provides a method for selecting drug sensitivity-determining genes using extensive gene expression data, high-density nucleic acid array to detect the expression of selected genes, and PCR probes and primers. The present invention further provides a method for predicting the drug sensitivity of unknown specimens using genes selected by the above method, and a computer device for predicting drug sensitivity. The method of the present invention allows the classification of unknown specimens and helps the planning of diagnostic and therapeutic methods based on drug sensitivity. Particularly, the present invention provides a method that specifies genes that greatly contribute towards the antitumor activity of a drug through revealing the correlation between the antitumor effect and microarray data, and further predicts the antitumor effect of the drug on specimens with unknown sensitivity based on the expression data of these genes.
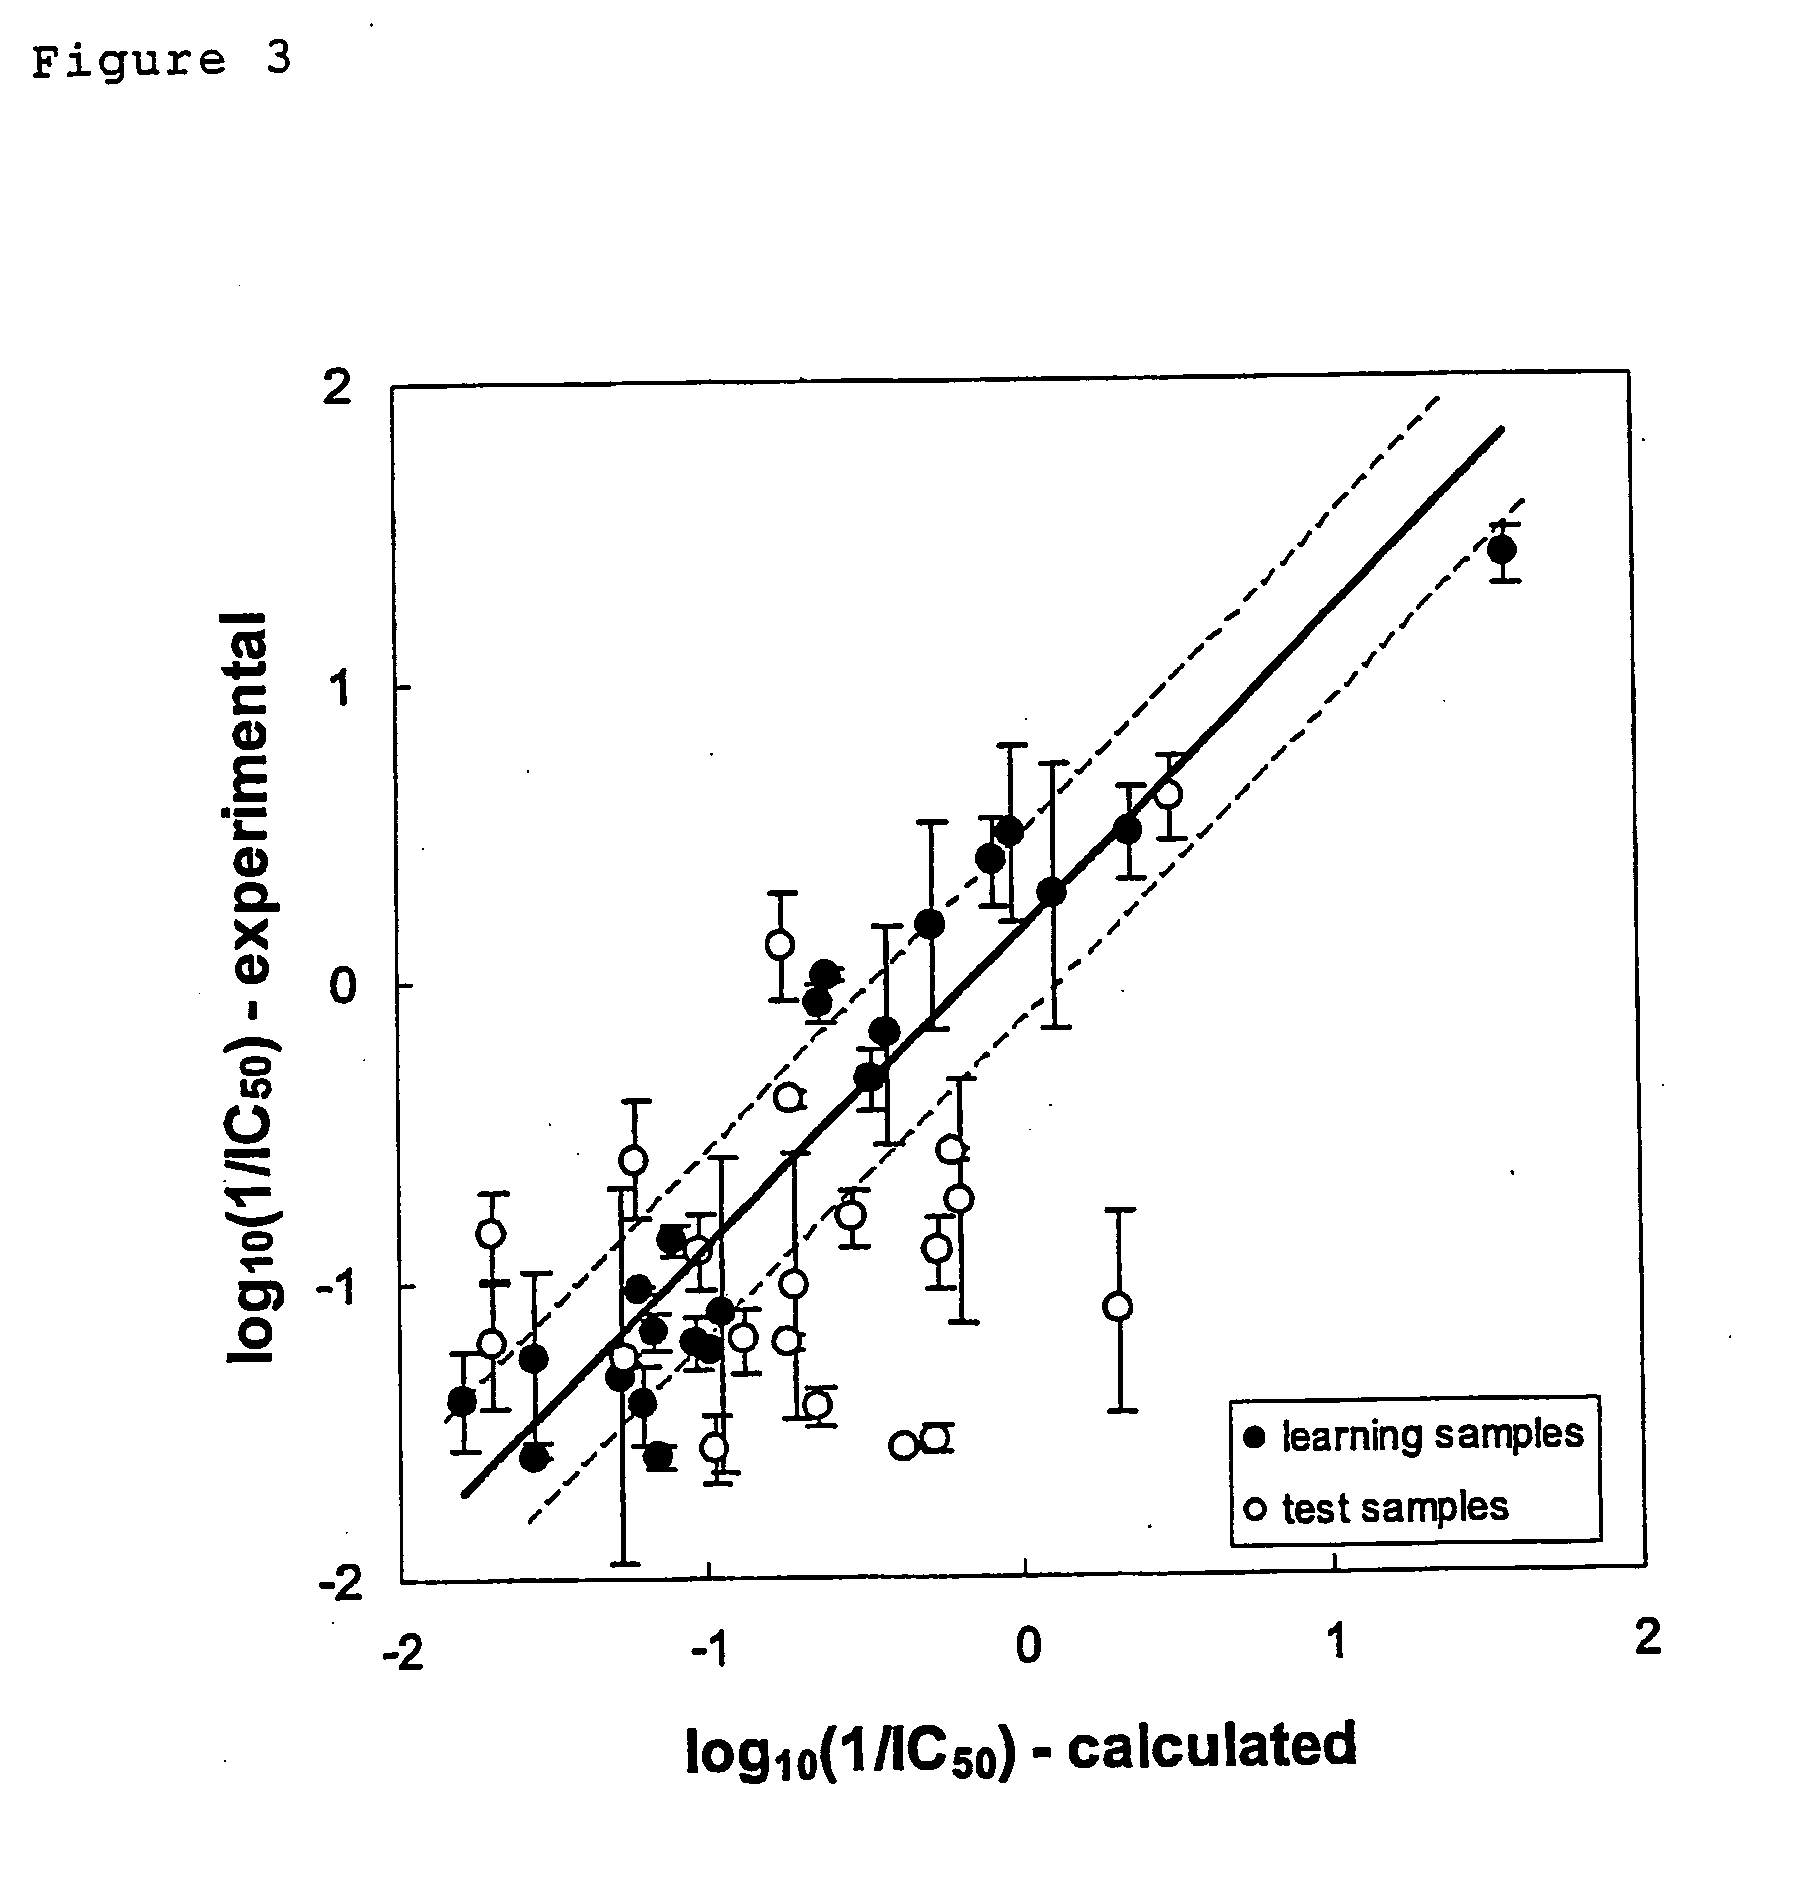
[0008] Although it is essential in health care to develop techniques that quantitatively predict the antitumor effect of a particular drug prior to administration using gene expression data, such methods have not yet been developed. Using a novel multivariate analysis technique that can overcome the statistical constraints described above, the present inventors developed a model to accurately predict the sensitivity of specimens with unknown sensitivity by quantitatively determining a correlation between the antitumor effect and a gene expression profile. To achieve this object, the present inventors used the partial least squares method type 1 (PLS1), which is a novel multivariate analysis method that has been used in the fields of econometrics and chemometrics. This analysis method comprises deriving principal components from extensive gene expression data, such as microarray data, and drug sensitivity data, such as an antitumor effect, and subjecting the two principal components again to simple regression analysis. The use of principal components enabled the circumvention of the following statistical constraints: i) the respective gene expression events are not independent of one another; and ii) the number of genes is overwhelmingly greater than the number of specimens. PLS type 2 (PLS2) of the partial least squares method (PLS) enables one to identify important genes commonly affecting the sensitivity to drugs based on, for example, the relationship between the cells and expression of multiple genes as well as relationship between the cells and the sensitivity to multiple drugs. On the other hand, PLS type 1 (PLS1) enables one to identify important genes for the sensitivity to particular drugs based on, for example, the relationship between the cells and expression of multiple genes as well as the relationship between the cells and the sensitivity to particular drugs. As described in the Examples herein, the present inventors experimentally measured drug sensitivities in vitro and in vivo specifically for cancer cell lines derived from colon cancer, lung cancer, breast cancer, prostate cancer, pancreatic cancer, gastric cancer, neuroblastoma, ovarian cancer, melanoma, bladder cancer, and acute myelocytic leukemia. Further, the expression of 10,000 or more types of genes in the cancer cell lines using DNA microarray was analyzed. Then, they analyzed the expression data and drug sensitivity data of these genes by PLS1, and thus constructed a model by which drug sensitivity can be predicted from the expression of the genes. This technique enabled the inventors to determine the degrees of contribution of the respective genes that were involved in the determination of drug sensitivity by the coefficients for the respective analyzed genes. Thereby, it was possible to select only those groups of genes having high degrees of contribution towards sensitivity.
[0009] Further, the present inventors reconstructed the PLS1 model using a group of selected genes with a high degree of contribution towards the determination of sensitivity, thereby developing a system that predicts sensitivity with a high degree of precision using a small number of genes. To achieve this system, first, the present inventors used a sequential method, specifically, the modeling power (MP) method. In the MP method, the greater the MP value (Ψ) of a gene is, the more significant the correlation of the gene is considered to be. The MP value was determined for the expression of each gene, and then genes with higher MP values were selected to greatly reduce the number of genes used in model construction. Thus, the inventors selected only genes that highly contributed towards drug sensitivity and succeeded in constructing a model. The square of the predictive correlation coefficient (Q2) of the constructed PLS1 model was significantly increased.

Problems solved by technology

Although it is essential in health care to develop techniques that quantitatively predict the antitumor effect of a particular drug prior to administration using gene expression data, such methods have not yet been developed.

Method used


Image

  • Method for selecting drug sensitivity-determining factors and method for predicting drug sensitivity using the selected factors
  • Method for selecting drug sensitivity-determining factors and method for predicting drug sensitivity using the selected factors
  • Method for selecting drug sensitivity-determining factors and method for predicting drug sensitivity using the selected factors

Examples


example 1

Analysis and Prediction of the Antitumor Effect In Vitro or in the Xenograft Model for 4-[Hydroxy-(3-methyl-3H-imidazol-4-yl)-(5-nitro-7-phenyl-benzofuran-2-yl)-methyl]benzonitrile Hydrochloride

Drug Sensitivity Test

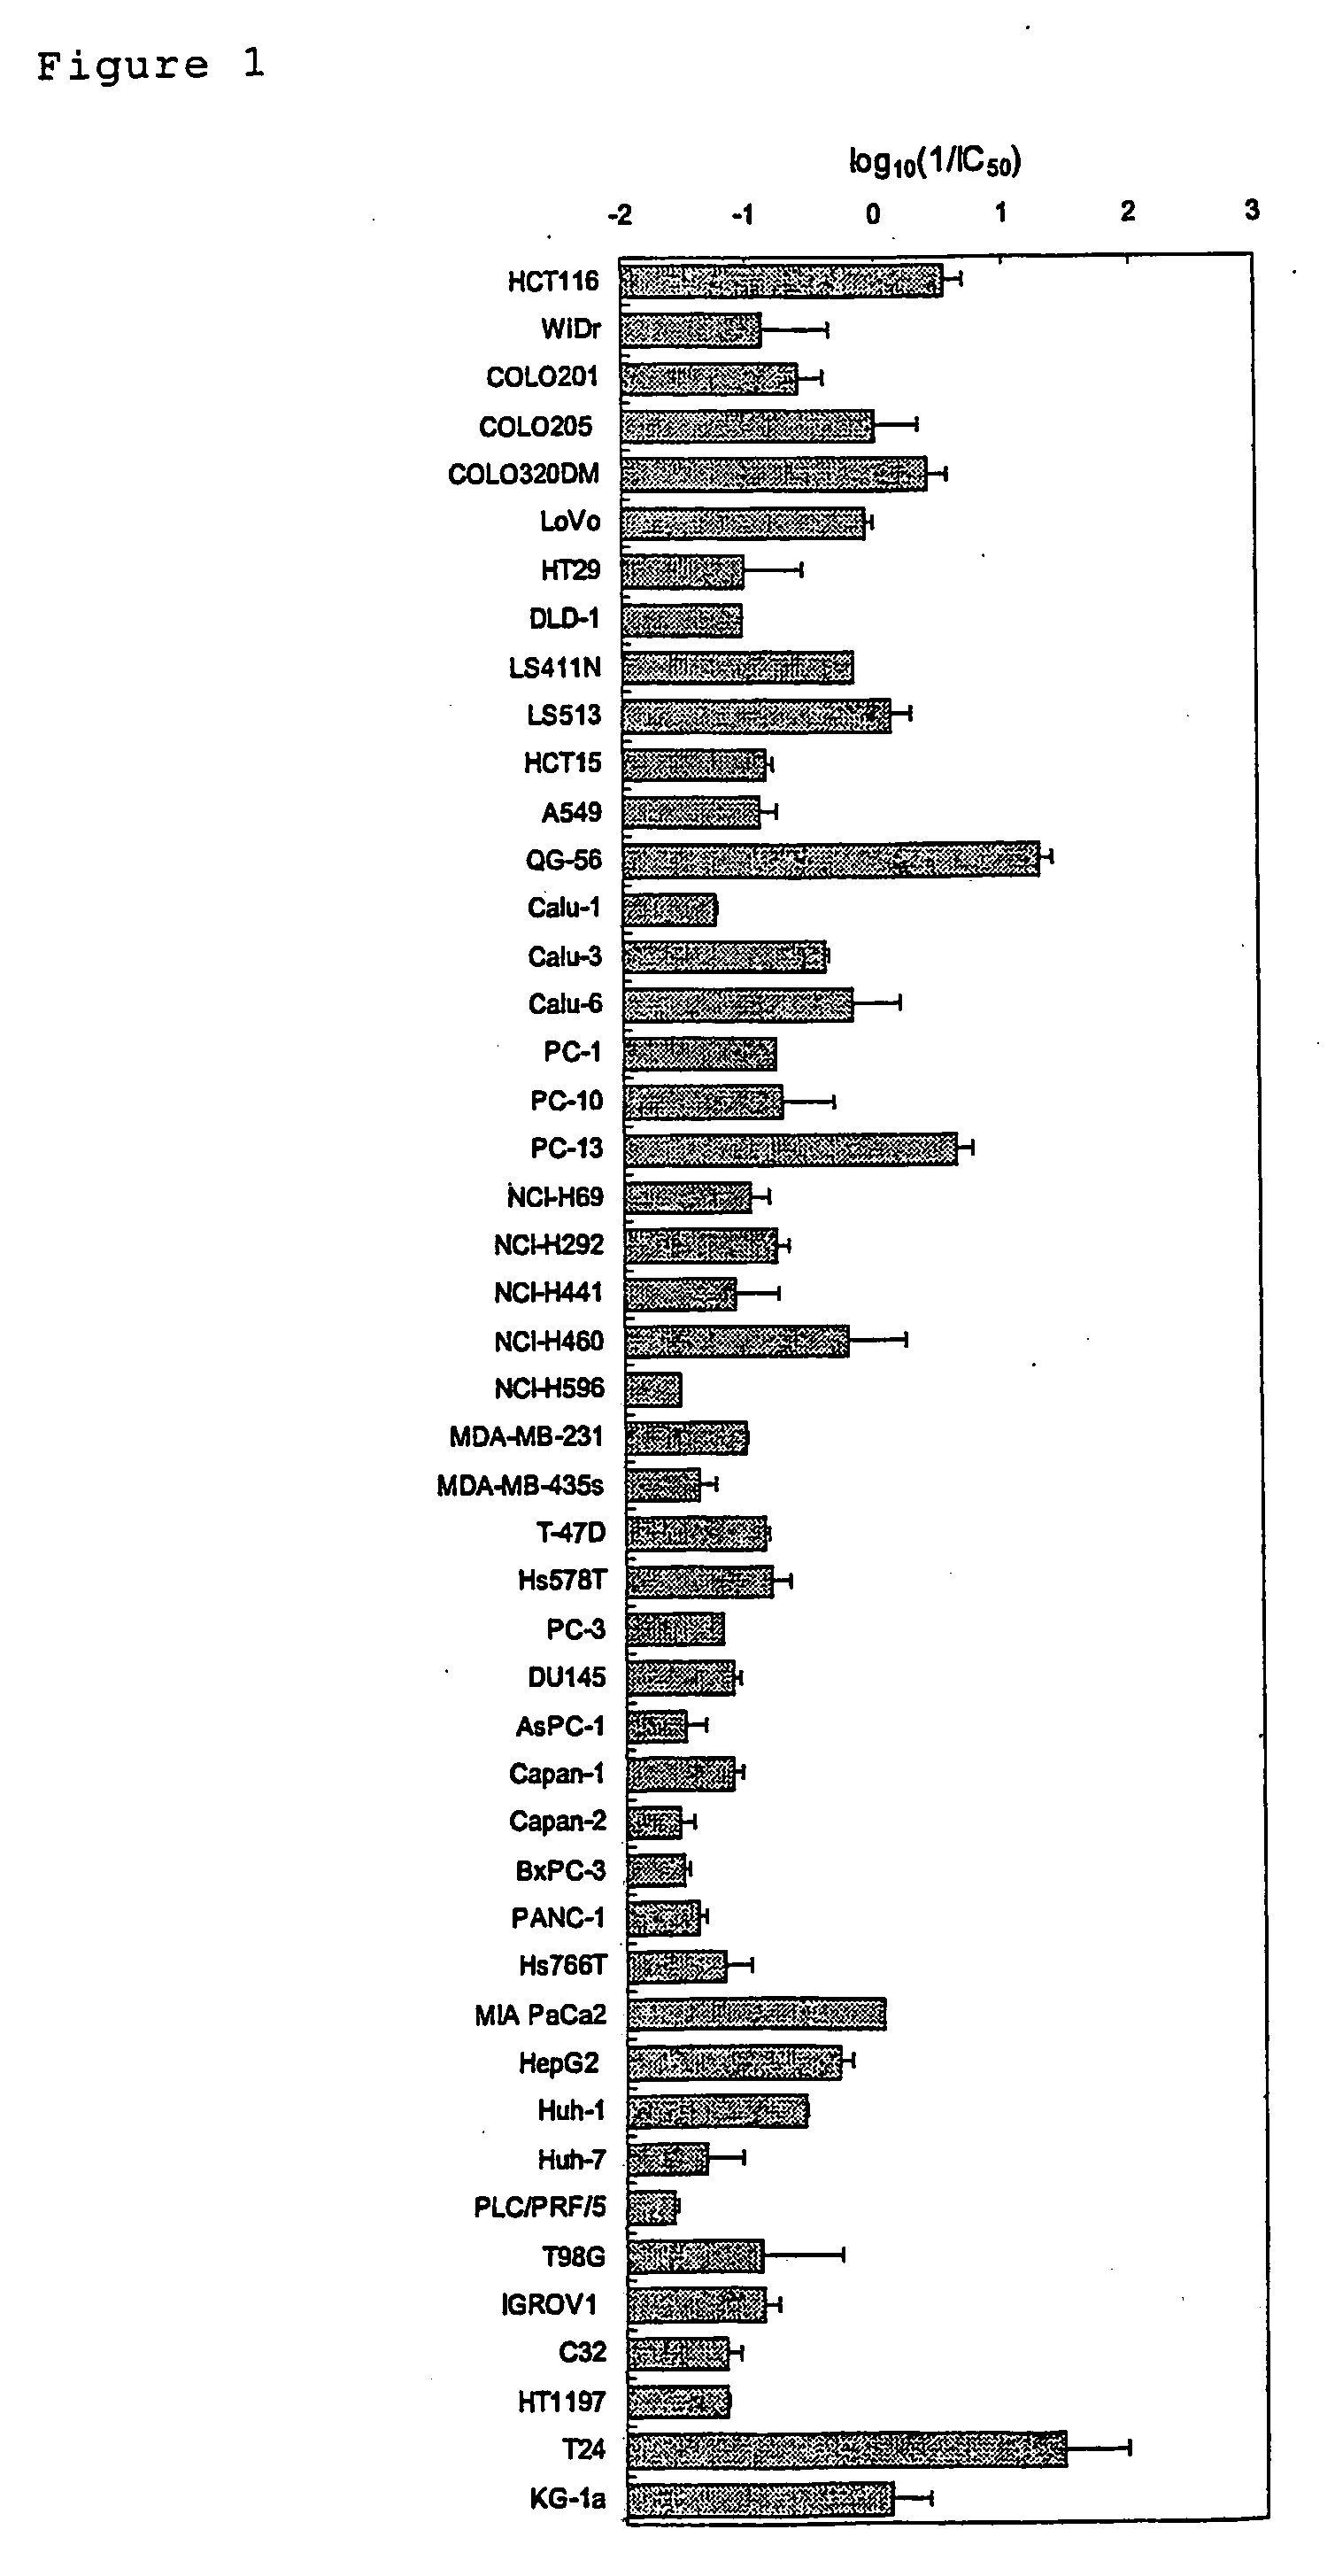
[0193] The in vitro drug sensitivity test was carried out with a cell proliferation assay in a micro-titer plate using the MST-8 colorimetric method. The human cancer cells used were HCT116, WiDr, COLO201, COLO205, COLO320DM, LoVo, HT29, DLD-1, LS411N, LS513, and HCT15 (all of the above are colon cancer cell lines); A549, QG56, Calu-1, Calu-3, Calu-6, PC1, PC10, PC13, NCI-H292, NCI-H441, NCI-H460, NCI-H596, and NCI-H69 (all of the above are lung cancer cell lines); MDA-MB-231, MDA-MB-435S, T-47D, and Hs578T (all of the above are breast cancer cell lines); PC-3, and DU145 (all of the above are prostate cancer cell lines); AsPC-1, Capan-1, Capan-2, BxPC3, PANC-1, Hs766T, and MIAPaCa2 (all of the above are pancreatic cancer cell lines); HepG2, Huh1, Huh7, and PLC / PRF / 5 (a...

example 2

Analysis and Prediction of the Antitumor Effect for Xeloda® in the Xenograft Model for Sensitivity-Unknown Cell Lines (Categorization Model)

Drug Sensitivity Test

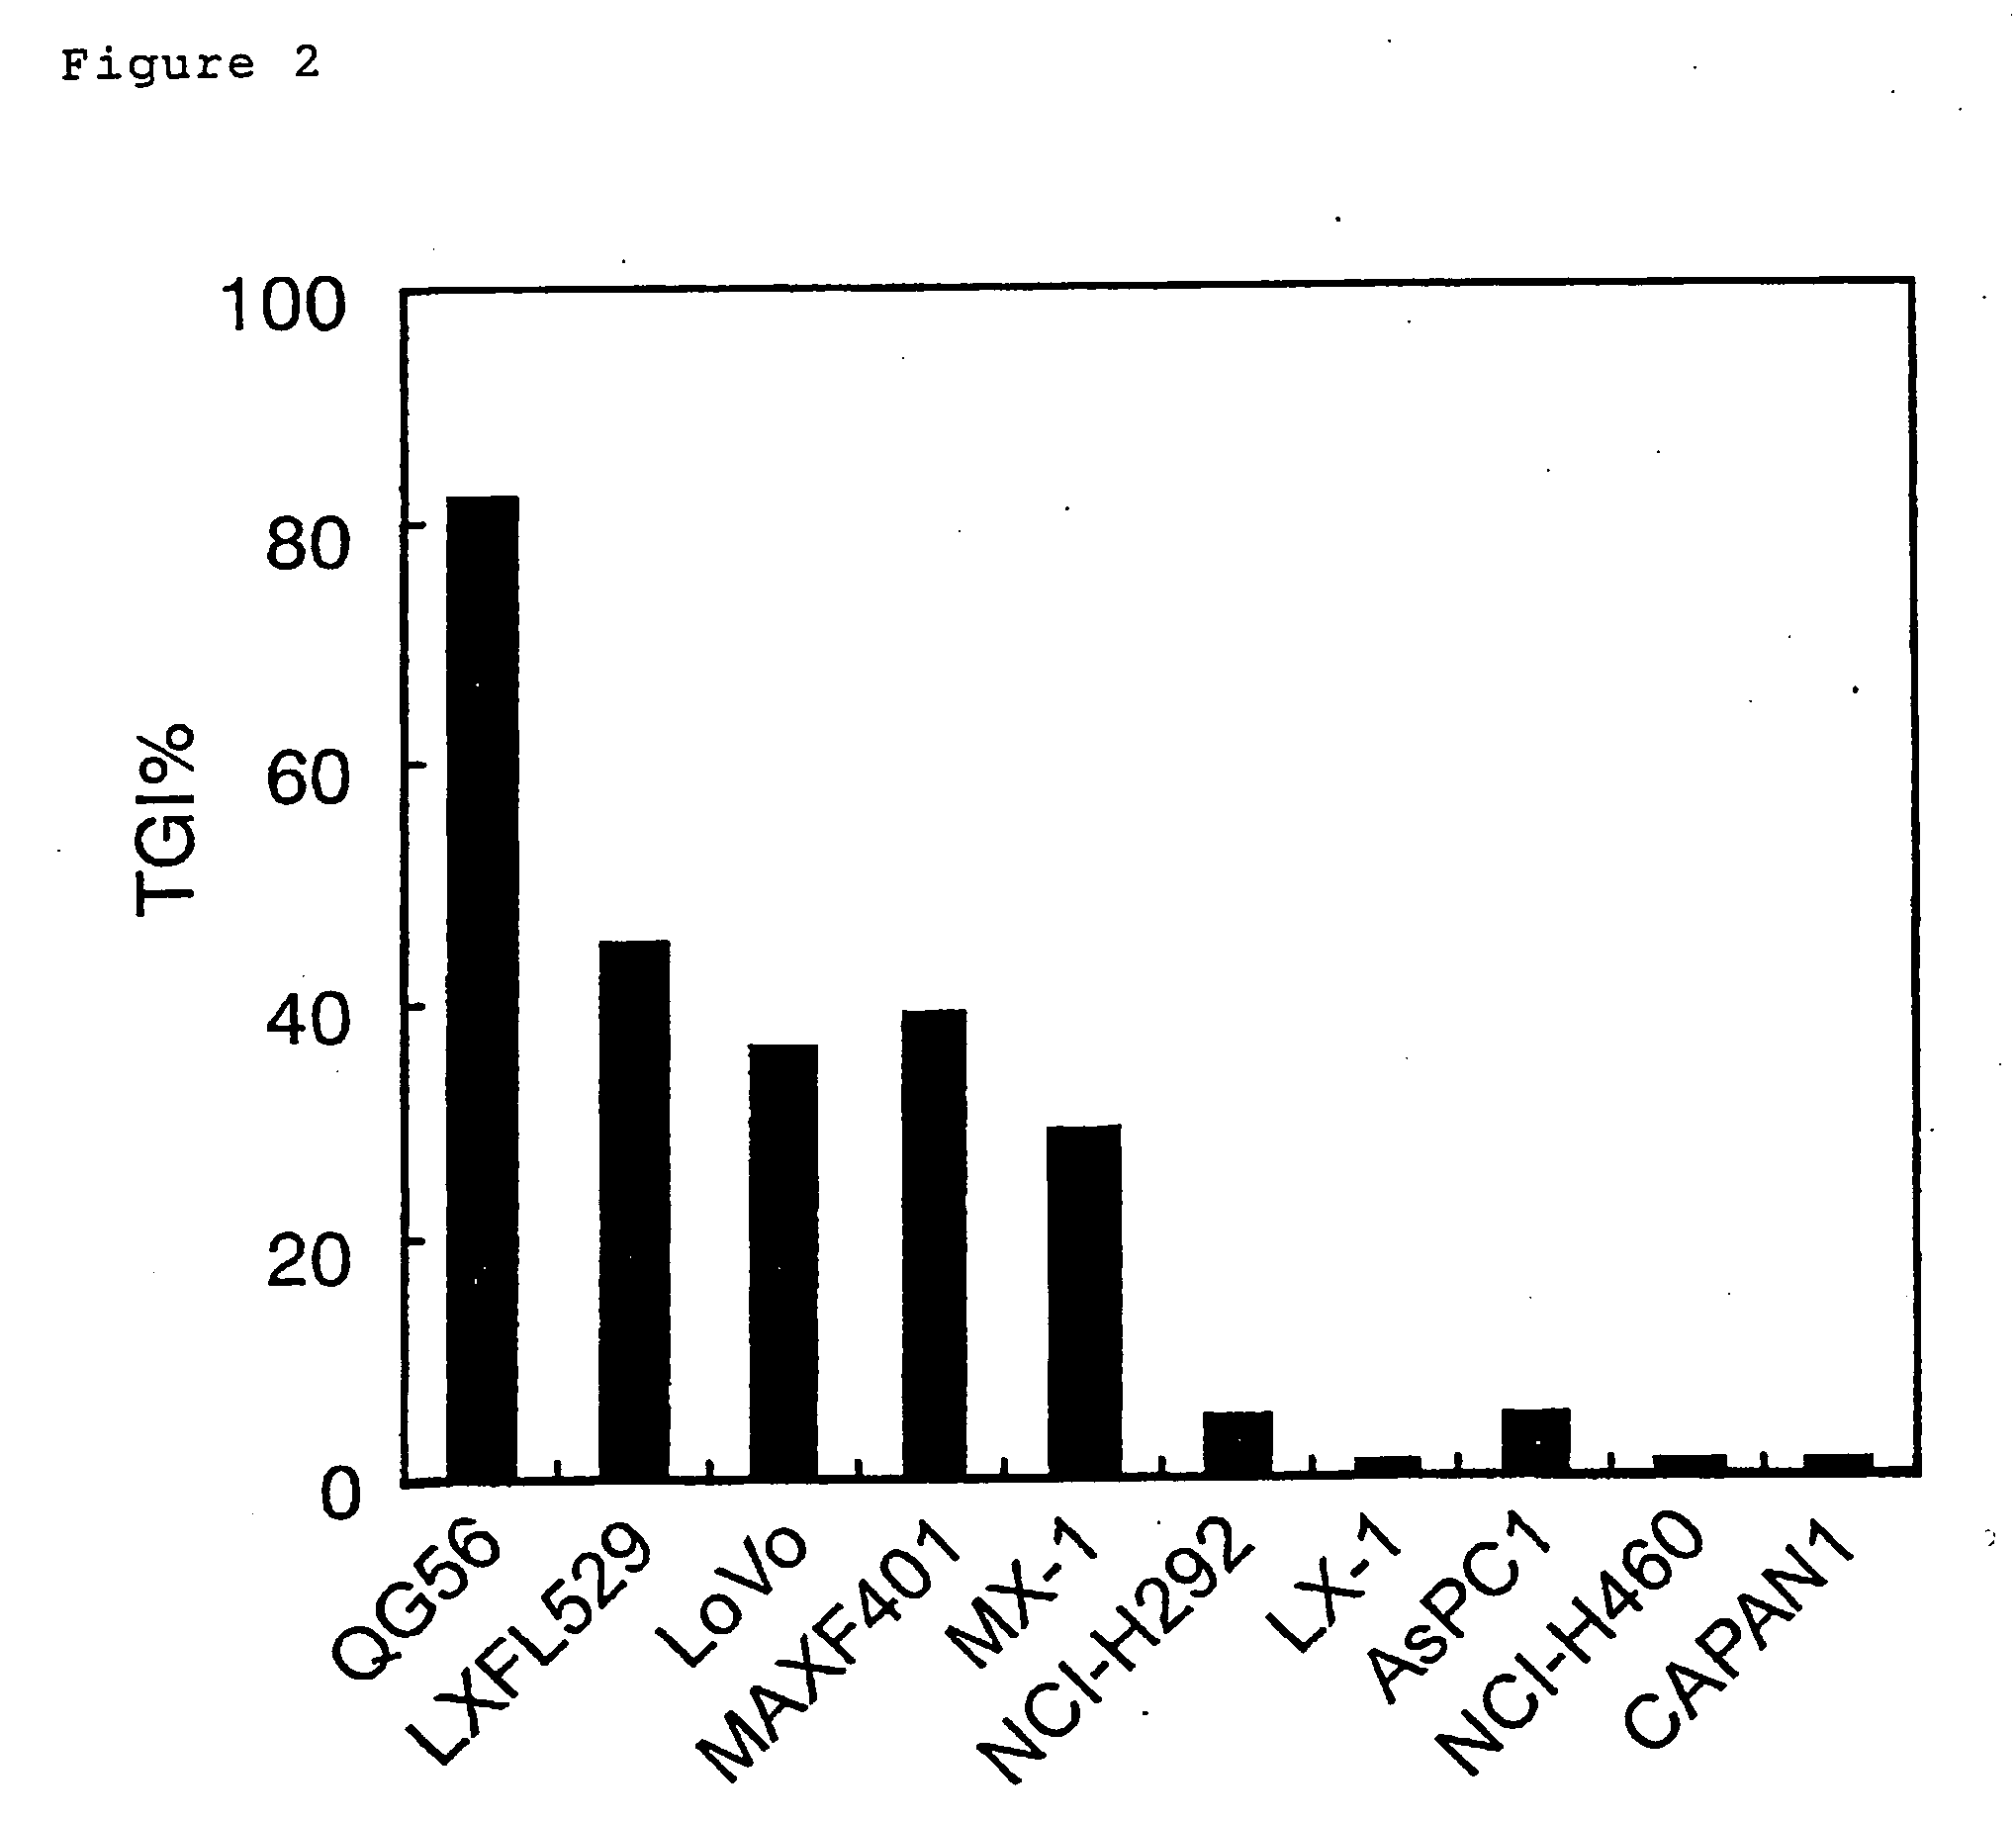
[0203] The antitumor effect of Xeloda® (capecitabine) in the xenograft model was assayed using 26 cell lines: DLD-1, LoVo, SW480, COLO201, WiDr, and CX-1 (all of the above are colon cancer cell lines); QG56, Calu-1, NCI-H441, and NCI-H596 (all of the above are lung cancer cell lines); MDA-MB-231, MAXF401, MCF7, ZR-75-1 (all of the above are breast cancer cell lines), AsPC-1, BxPC-3, PANC-1, and Capan-1 (all of the above are pancreatic cancer cell lines); MKN28 and GXF97 (all of the above are gastric cancer cell lines); SK-OV-3 and Nakajima (all of the above are ovarian cancer cell lines); Scaber and T-24 (bladder cancer cell line); Yumoto (uterine cancer cell line); and ME-180 (endometrial cancer cell line). The therapeutic experiment was carried out as follows. For example, in the case of LoVo (colon cancer cell line), 5...


PUM

PropertyMeasurementUnit
volumeaaaaaaaaaa
modeling power valueaaaaaaaaaa
densityaaaaaaaaaa

Abstract

Based on drug sensitivity data and extensive gene expression data, a model was constructed by multivariate analysis with the partial least squares method type 1. Further, the model was optimized using modeling power and genetic algorithm. Thereby, the degree of contribution of the respective genes to drug sensitivity was determined to select genes with a high degree of contribution. In addition, the levels of gene expression in specimens were analyzed, and then the drug sensitivity was predicted based on the model. The predicted values agreed well with those drug sensitivity values determined experimentally. The drug sensitivity-predicting method provided by the present invention enables assessment of the effectiveness of a drug prior to administration using small quantities of specimens associated with diseases such as cancer. Since this enables the selection of the most suitable drug for each patient, the present invention is very useful in improving a patient's quality of life (QOL).

Description

TECHNICAL FIELD [0001] The present invention relates to a method for selecting drug sensitivity-determining factors using gene expression data and a method for predicting the drug sensitivity of unknown specimens using the determining factors selected. The present invention particularly relates to techniques for identifying genes that greatly contribute towards antitumor activity by revealing the correlation between antitumor effects and microarray data, and also techniques that predict antitumor effects of specimens with unknown sensitivity based on gene expression data. BACKGROUND ART [0002] Although known anti-tumor drugs are not very effective in general, their side effects can be very serious and remarkably deteriorate a patient's quality of life (QOL). In order to improve the therapeutic effect and patients' QOL, it is necessary to predict the therapeutic effect an anti-cancer drug would have on a patient prior to the administration, and select an appropriate drug. [0003] Sinc...

Claims


Application Information

Patent Timeline
Patent Type & Authority Applications(United States)
IPC IPC(8): G01N33/53G16B40/00C12M1/00C12N15/09C12Q1/68G01N33/574G01N37/00G06F17/17G06F19/00G06K9/62G16B20/00G16B25/20
CPCC12Q1/6837C12Q1/6886C12Q2600/106G06F19/24G06F19/18G06F19/20C12Q2600/158G16B20/00G16B25/00G16B40/00G16B25/20
Inventor AOKI, YUKOHASEGAWA, KIYOSHIISHII, NOBUYAMORI, KAZUSHIGE
Owner F HOFFMANN LA ROCHE & CO AG
Learn More