

Nitorgen doped silicon wafer and manufacturing method thereof
- Summary
- Abstract
- Description
- Claims
- Application Information
AI Technical Summary
Benefits of technology
Problems solved by technology
Method used
Image

Examples
embodiment 1
[0101] An example of predicting the BMD density to be obtained in a case where a wafer manufactured from a crystal whose cooling rate around 1100° C. during crystal growth is 3.5° C. / minute undergoes an epitaxial growth process is shown. Here, the effects of the nitrogen concentration and the temperature and time of a high-temperature pre-process (hereinafter referred to as “hydrogen baking process” in some cases) performed to eliminate natural oxide films before the epitaxial growth are predicted by a method according to the present invention.
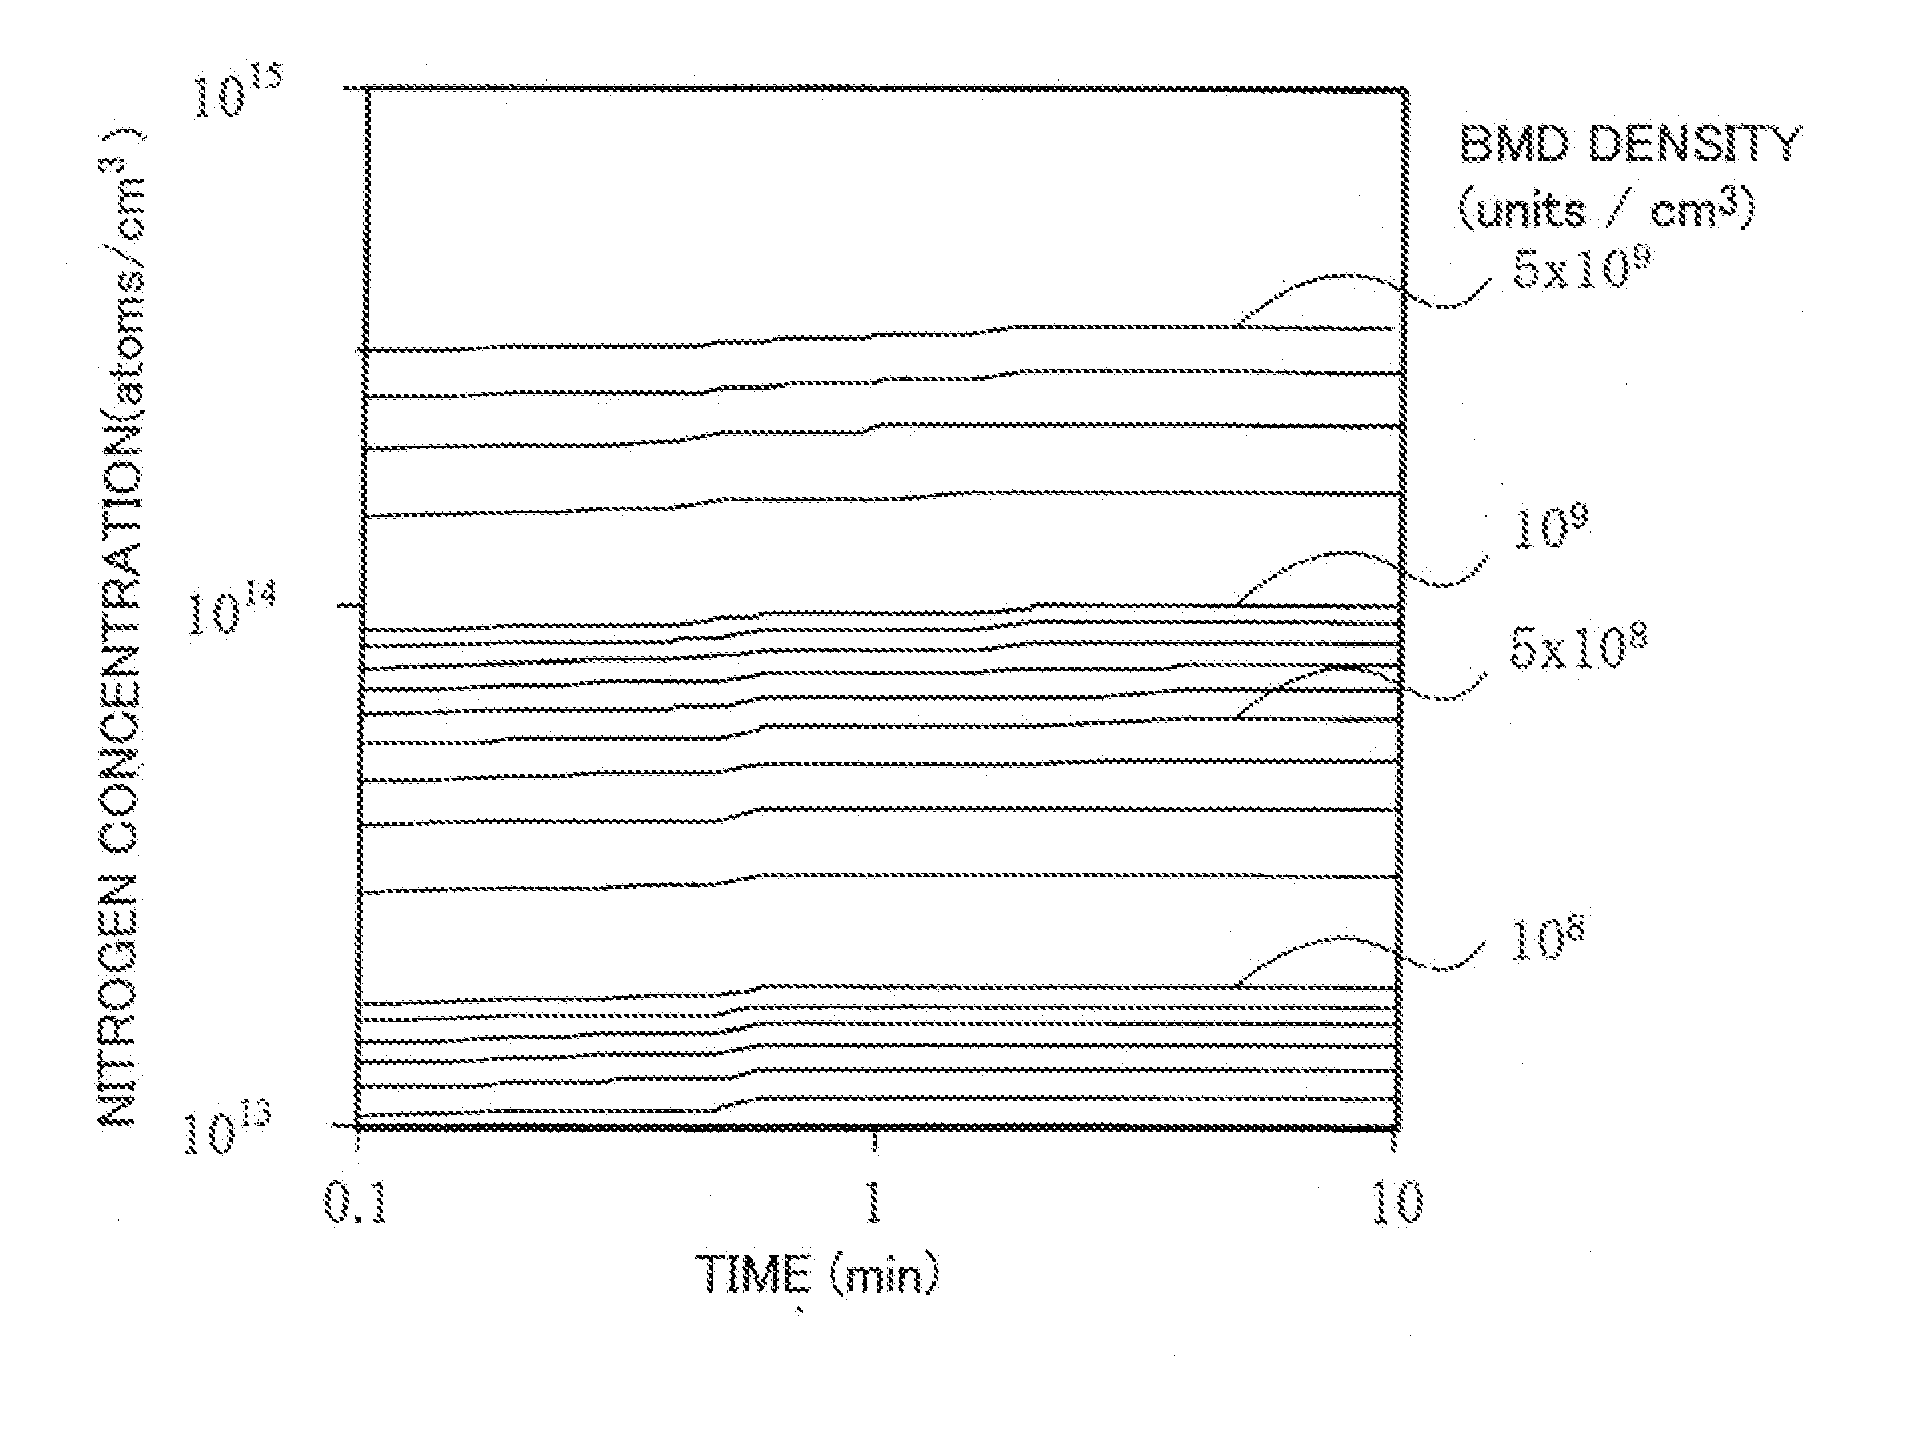
[0102]FIGS. 8, 9 and 10 show the relation of the BMD density vs. the holding time at a given pre-process temperature and nitrogen concentration, when the cooling rate around 1100° C. during crystal growth was set to 3.5° C. / minute, the oxygen concentration at the time was set to 12.0×10¹⁷ atoms / cm3, the thermal annealing time from 500° C. to the pre-process temperature was set to 1 minute, and the pre-process temperature was set to each of 11...
embodiment 2
[0105] An example in which the effects of the heat treatment temperature and time of pre-annealing performed before an epitaxial growth process and the nitrogen concentration on the BMD density are predicted by a method according to the present invention is shown. The calculation method is the same as that shown in Embodiment 1.
[0106]FIGS. 11, 12 and 13 show the relation of the BMD density vs. the annealing time and nitrogen concentration, when the cooling rate around 1100° C. during crystal growth was set to 3.5° C. / minute, the oxygen concentration time from 500° C. in the epitaxial process was set to 1 minute, the epitaxial temperature was set to 1200° C., the epitaxial process time was set to 1 minute, and the pre-annealing temperature was set to each of 750° C., 800° C., and 850° C. Each of the contour lines in the figures represents a BMD density, and some of the lines are provided with their specific BMD density values. From these figures, the conditions for obtaining the BMD...
embodiment 3
[0107] An example in which the effects of the heat treatment temperature and time of pre-annealing performed before the high-temperature annealing process and the nitrogen concentration on the BMD density are predicted by a method according to the present invention is shown.
[0108] The cooling rate around 1100° C. during crystal growth was set to 3.5° C. / minute, and the oxygen concentration was set to 12.0×10¹⁷ atoms / cm3. FIGS. 14 and 15 show the relation of the BMD density vs. the annealing time and nitrogen concentration, when the pre-annealing temperature was set to each of 750° C. and 800° C., respectively in case of the thermal annealing rate from 800° C. to 1000° C. was set to 10° C. / minute, the thermal annealing rate from 1000° C. was set to 1100° C. was set to 2° C. / minute, the thermal annealing rate from 1100° C. to 1200° C. was set to 1° C. / minute, and the holding time at 1200° C. was set to 1 hour in a high-temperature annealing process. Each of the contour lines in the f...
PUM
 Abstract
Description
Claims
Application Information