Efficient method to predict integrated circuit temperature and power maps

Inactive Publication Date: 2008-01-31
UNIV OF CALIFORNIA SANTA CRUZ
View PDF6 Cites 47 Cited by
  • Summary
  • Abstract
  • Description
  • Claims
  • Application Information

AI Technical Summary

Benefits of technology

[0008] In one aspect, the present invention provides a fast and accurate computational method to predict the surface temperature of an IC. Using the approach of the present invention, referred to herein as “power blurring,” the temperature distribution associated with a given multi-element power distribution can be computed with calculation times three orders of magnitude faster than that using FEA and predicted hot spot temperatures within 1° C. as compared to those of FEA for both steady-state and transient thermal simulations. The invention therefore provides significant benefit to the design of an integrated circuit, assisting in the minimization of localized heating and consequently increasing both IC performance and lifetime.
[0009] According to one embodiment of the invention, a computer-implemented method for calculating a temperature distribution associated with a design of an integrated circuit includes representing a power usage on the surfac

Problems solved by technology

With increasing temperatures, the sub-threshold leakage power, interconnect delay and crosstalk noise also increase.
Furthermore, high temperature operation reduces the lifetime of an IC, and increases the cost of an IC's thermal package.
This thermal analysis is complicated by the spatial and temporal non-uniform heating found in contemporary microprocessors, resulting in certain regions, known as “hot spots,” exceeding the mean operating temperature.
However, their accuracy comes at the price of long execution times, and exhaustive CPU and memory usage.
While this method is accurate, it is computationally very time consuming.
Consequently, it is not practical for use with a very large number of nodes in a chip, or for use with routing and pla

Method used


Image

  • Efficient method to predict integrated circuit temperature and power maps
  • Efficient method to predict integrated circuit temperature and power maps
  • Efficient method to predict integrated circuit temperature and power maps

Examples


Embodiment Construction

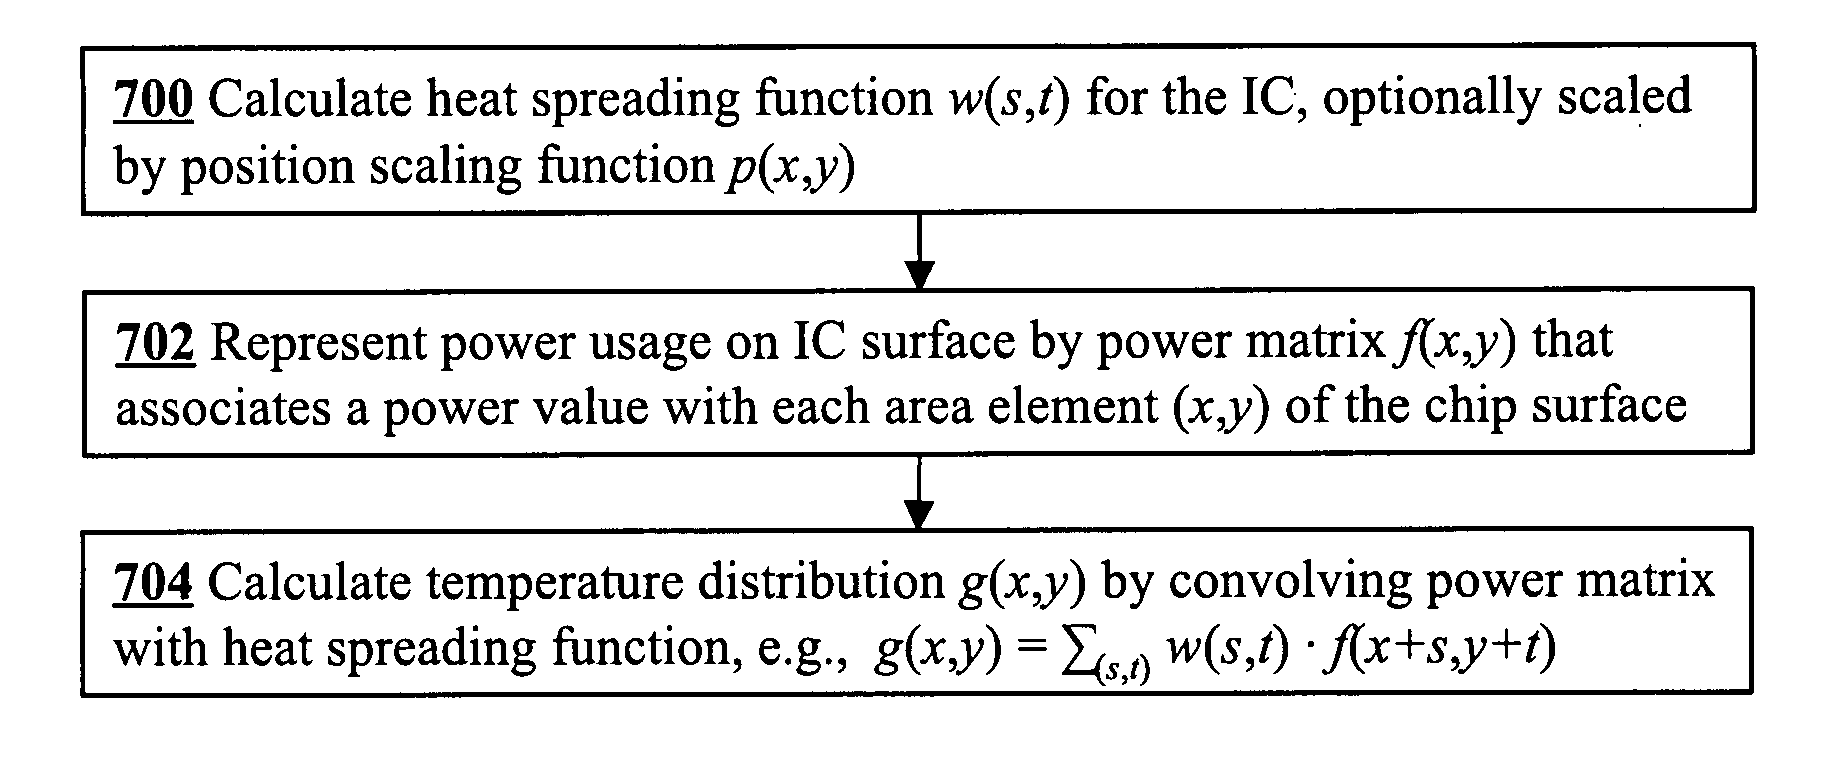
[0019] A key feature of the present invention is the technique of computing an IC temperature distribution by convolving a power matrix with a heat spreading function, or mask. To better understand this unique approach, it is helpful to recall how convolution is used in the field of image processing for image blurring. The intensity levels of pixels (x,y) of a black and white digital image are represented by a matrix of numerical values, f (x,y). The process of spatial filtering (e.g., blurring) computes a new intensity value g (x,y) of each pixel in an image by convolution of f with another matrix w, known as a mask, to produce the blurred image g. The mask w (s,t) determines how the intensity of each pixel (x,y) is spread to nearby pixels (x+s,y+t). For example, the 3×3 mask w⁡(s,t)=[0.050.100.050.100.400.100.050.100.05]

spreads 60% of a pixel's intensity to adjacent pixels, with 10% being spread to adjacent pixels to the right, left, up, and down, and 5% being spread to the four...


PUM


Abstract

The temperature distribution associated with a design of an integrated circuit is calculated by convoluting a surface power usage represented by a power matrix with a heat spreading function. The heat spreading function may be calculated from a simulation of a point source on the integrated circuit using a finite element analysis model of the integrated circuit or other techniques. To account for spatial variations on the chip, the heat spreading function may be made dependent on position using a position scaling function. Steady-state or transient temperature distributions may be computed by using a steady-state or transient heat spreading function. A single heat spreading function may be convolved with various alternative power maps to efficiently calculate temperature distributions for different designs. In an inverse problem, one can calculate the power map from an empirically measured temperature distribution and a heat spreading function using various de-convolution techniques. While the forward problem is analogous to image blurring, the inverse problem is analogous to image restoration.

Description

CROSS-REFERENCE TO RELATED APPLICATIONS [0001] This application claims priority from U.S. provisional patent application No. 60 / 791,628 filed Apr. 12, 2006, which is incorporated herein by reference.STATEMENT OF GOVERNMENT SPONSORED SUPPORT [0002] N / A FIELD OF THE INVENTION [0003] This invention relates generally to the design of semiconductor integrated circuits. More specifically, it relates to methods for the efficient computational simulation of temperature and power distributions associated with semiconductor chip designs. BACKGROUND OF THE INVENTION [0004] As power densities in integrated circuits (ICs) increases with faster clock frequencies and smaller die size, controlling circuit temperatures has become an important aspect of IC design. With increasing temperatures, the sub-threshold leakage power, interconnect delay and crosstalk noise also increase. Furthermore, high temperature operation reduces the lifetime of an IC, and increases the cost of an IC's thermal package. C...

Claims


Application Information

Patent Timeline
IPC IPC(8): H01L21/66
CPCG06Q10/04G06F30/39G06F2119/06G06F2119/12
Inventor SHAKOURI, ALIKEMPER, TRAVISZHANG, YANMILANFAR, PEYMANMARTIN HERIZ, VIRGINIAWANG, XI
Owner UNIV OF CALIFORNIA SANTA CRUZ
Why Eureka
Try Eureka