Gene Detecting Method

Inactive Publication Date: 2008-11-06
KYUSHU UNIV
4 Cites 5 Cited by

AI-Extracted Technical Summary

Problems solved by technology
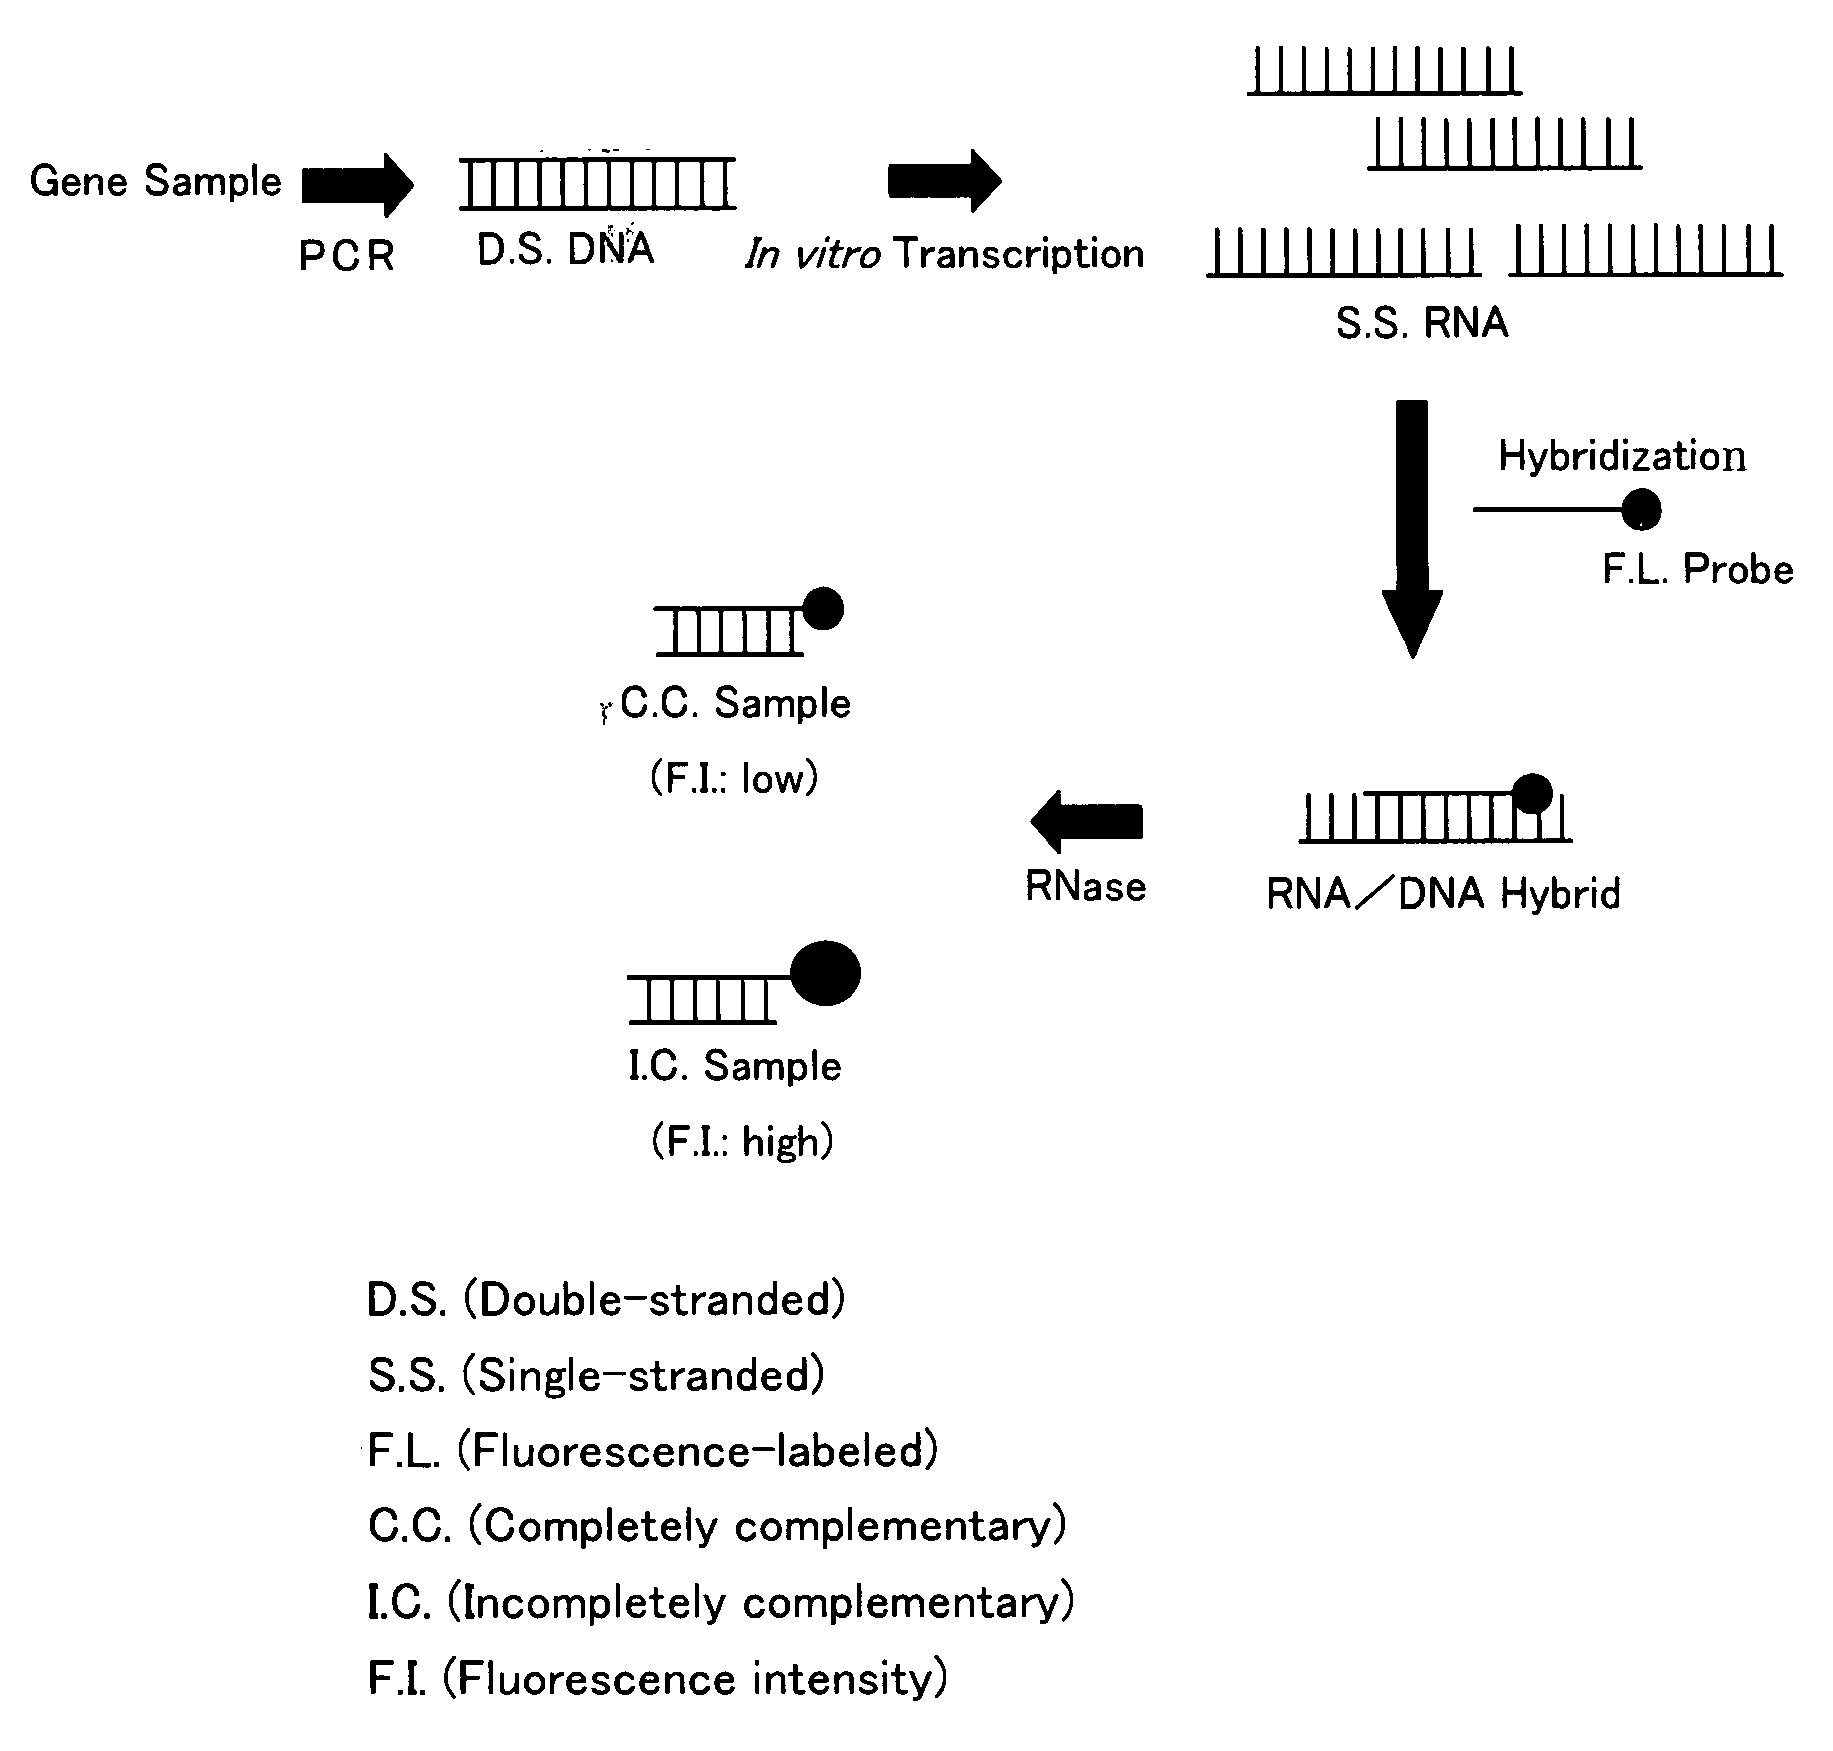
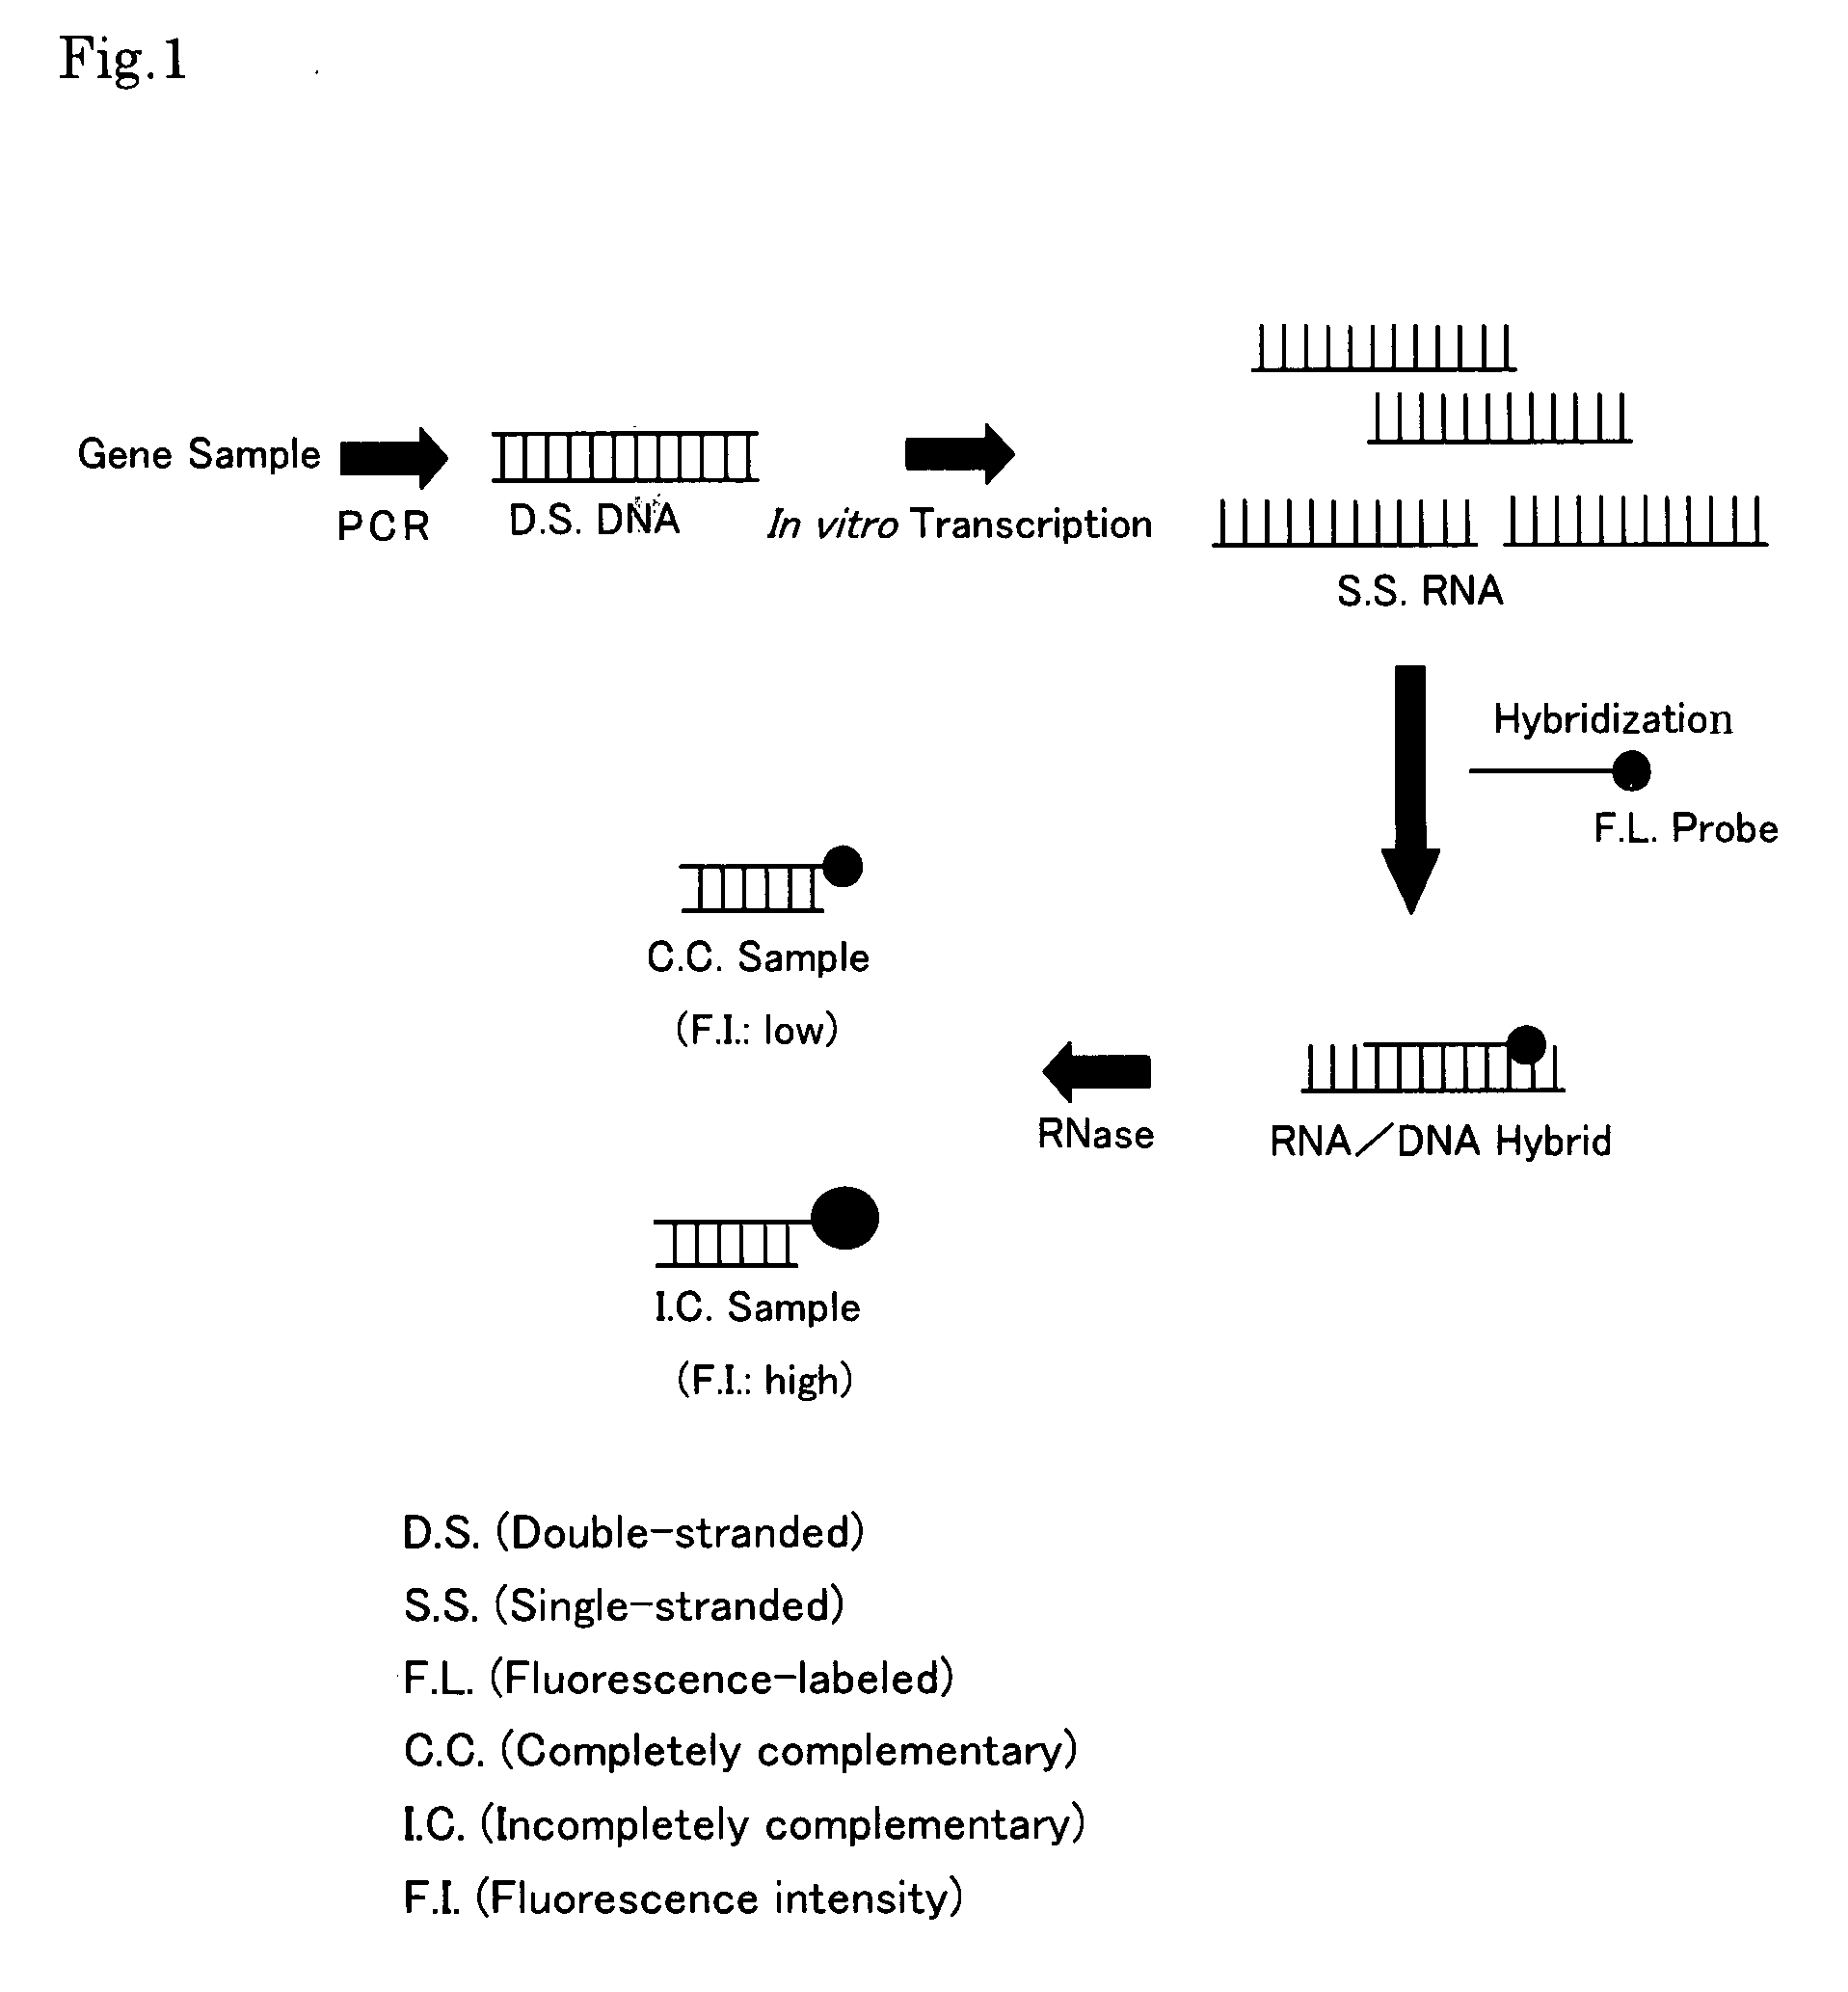
However, these conventional methods have a drawback that only a limited amount of DNA is obtained by the RCR reaction and, a high level of knowledge and skill are needed for obtaining reproducible and reliable results.
Shortc...

Method used

[0024]As a first step of the gene detecting method in accordance with the present invention, a target gene sample (sample of the gene to be examined) and a control gene sample (sample of a gene having a wild-type or standard-type base sequence with respect to the target gene) are subjected to PCR (polymerase chain reaction), wherein the present invention features a subsequent step of synthesizing a large amount of single-stranded RNA from the PCR products as template, thereby achieving a quantum increase in sample amount. Thus, primers for use in the amplification of the respective gene samples by PCR in the present invention include not only a base sequence specific to the genes as in a usual PCR reaction, but also a RNA polymerase promoter sequence at the 5′-end thereof.
[0038]Thus, according to the fluorometry in which there is used RNA hybridized with a fluorescence-labeled probe and a fluorescence-quenching probe, a greatly enhanced rate of fluorescence quenching is attained, thereby enabling a highly accurate detection of the mutation or the presence/absence of a specific base in a target gene.
[0041]According to the prese...

Benefits of technology

[0013]By subjecting the PCR products to the in vitro transcription reactions in accordance with the present invention, the gene samples can be prepared in the form of single-stranded RNA in concentrations more than 100 times the amount of sample in the conventional method. Thus, it is possible to overcome the issue of low reliability experienced by the conventional method owing to the limited amount of sample obtained solely by a PCR reaction. The method of ...

Abstract

Disclosed is a gene detecting method for determining mutation of a specific base or presence/absence of a specific base in a target gene. There are provided a the target gene sample and a control gene sample having a base sequence which is wild-type or standard-type with respect to the target gene. The method comprises steps of (i) independently subjecting the target gene sample and the control gene sample to a PCR reaction for amplification, using primers having an RNA polymerase promoter sequence at the 5′-end thereof, (ii) independently subjecting the double-stranded DNAs produced by said PCR reaction from the target gene sample and from the control gene sample, to an in vitro transcription reaction to form a single-stranded RNA, (iii) independently hybridizing the single-stranded RNAs with a fluorescence-labeled probe composed of a single-stranded DNA having a base sequence complementary to at least part of the base sequence of the control gene and being combined with a fluorescent dye, to form an RNA/DNA hybrid, and then (iv) comparing the fluorescence intensity of the RNA/DNA hybrid derived from the target gene sample with that of the RNA/DNA hybrid derived from the control gene sample.

Application Domain

Technology Topic

Image

  • Gene Detecting Method
  • Gene Detecting Method
  • Gene Detecting Method

Examples

  • Experimental program(4)

Example

EXAMPLE 1
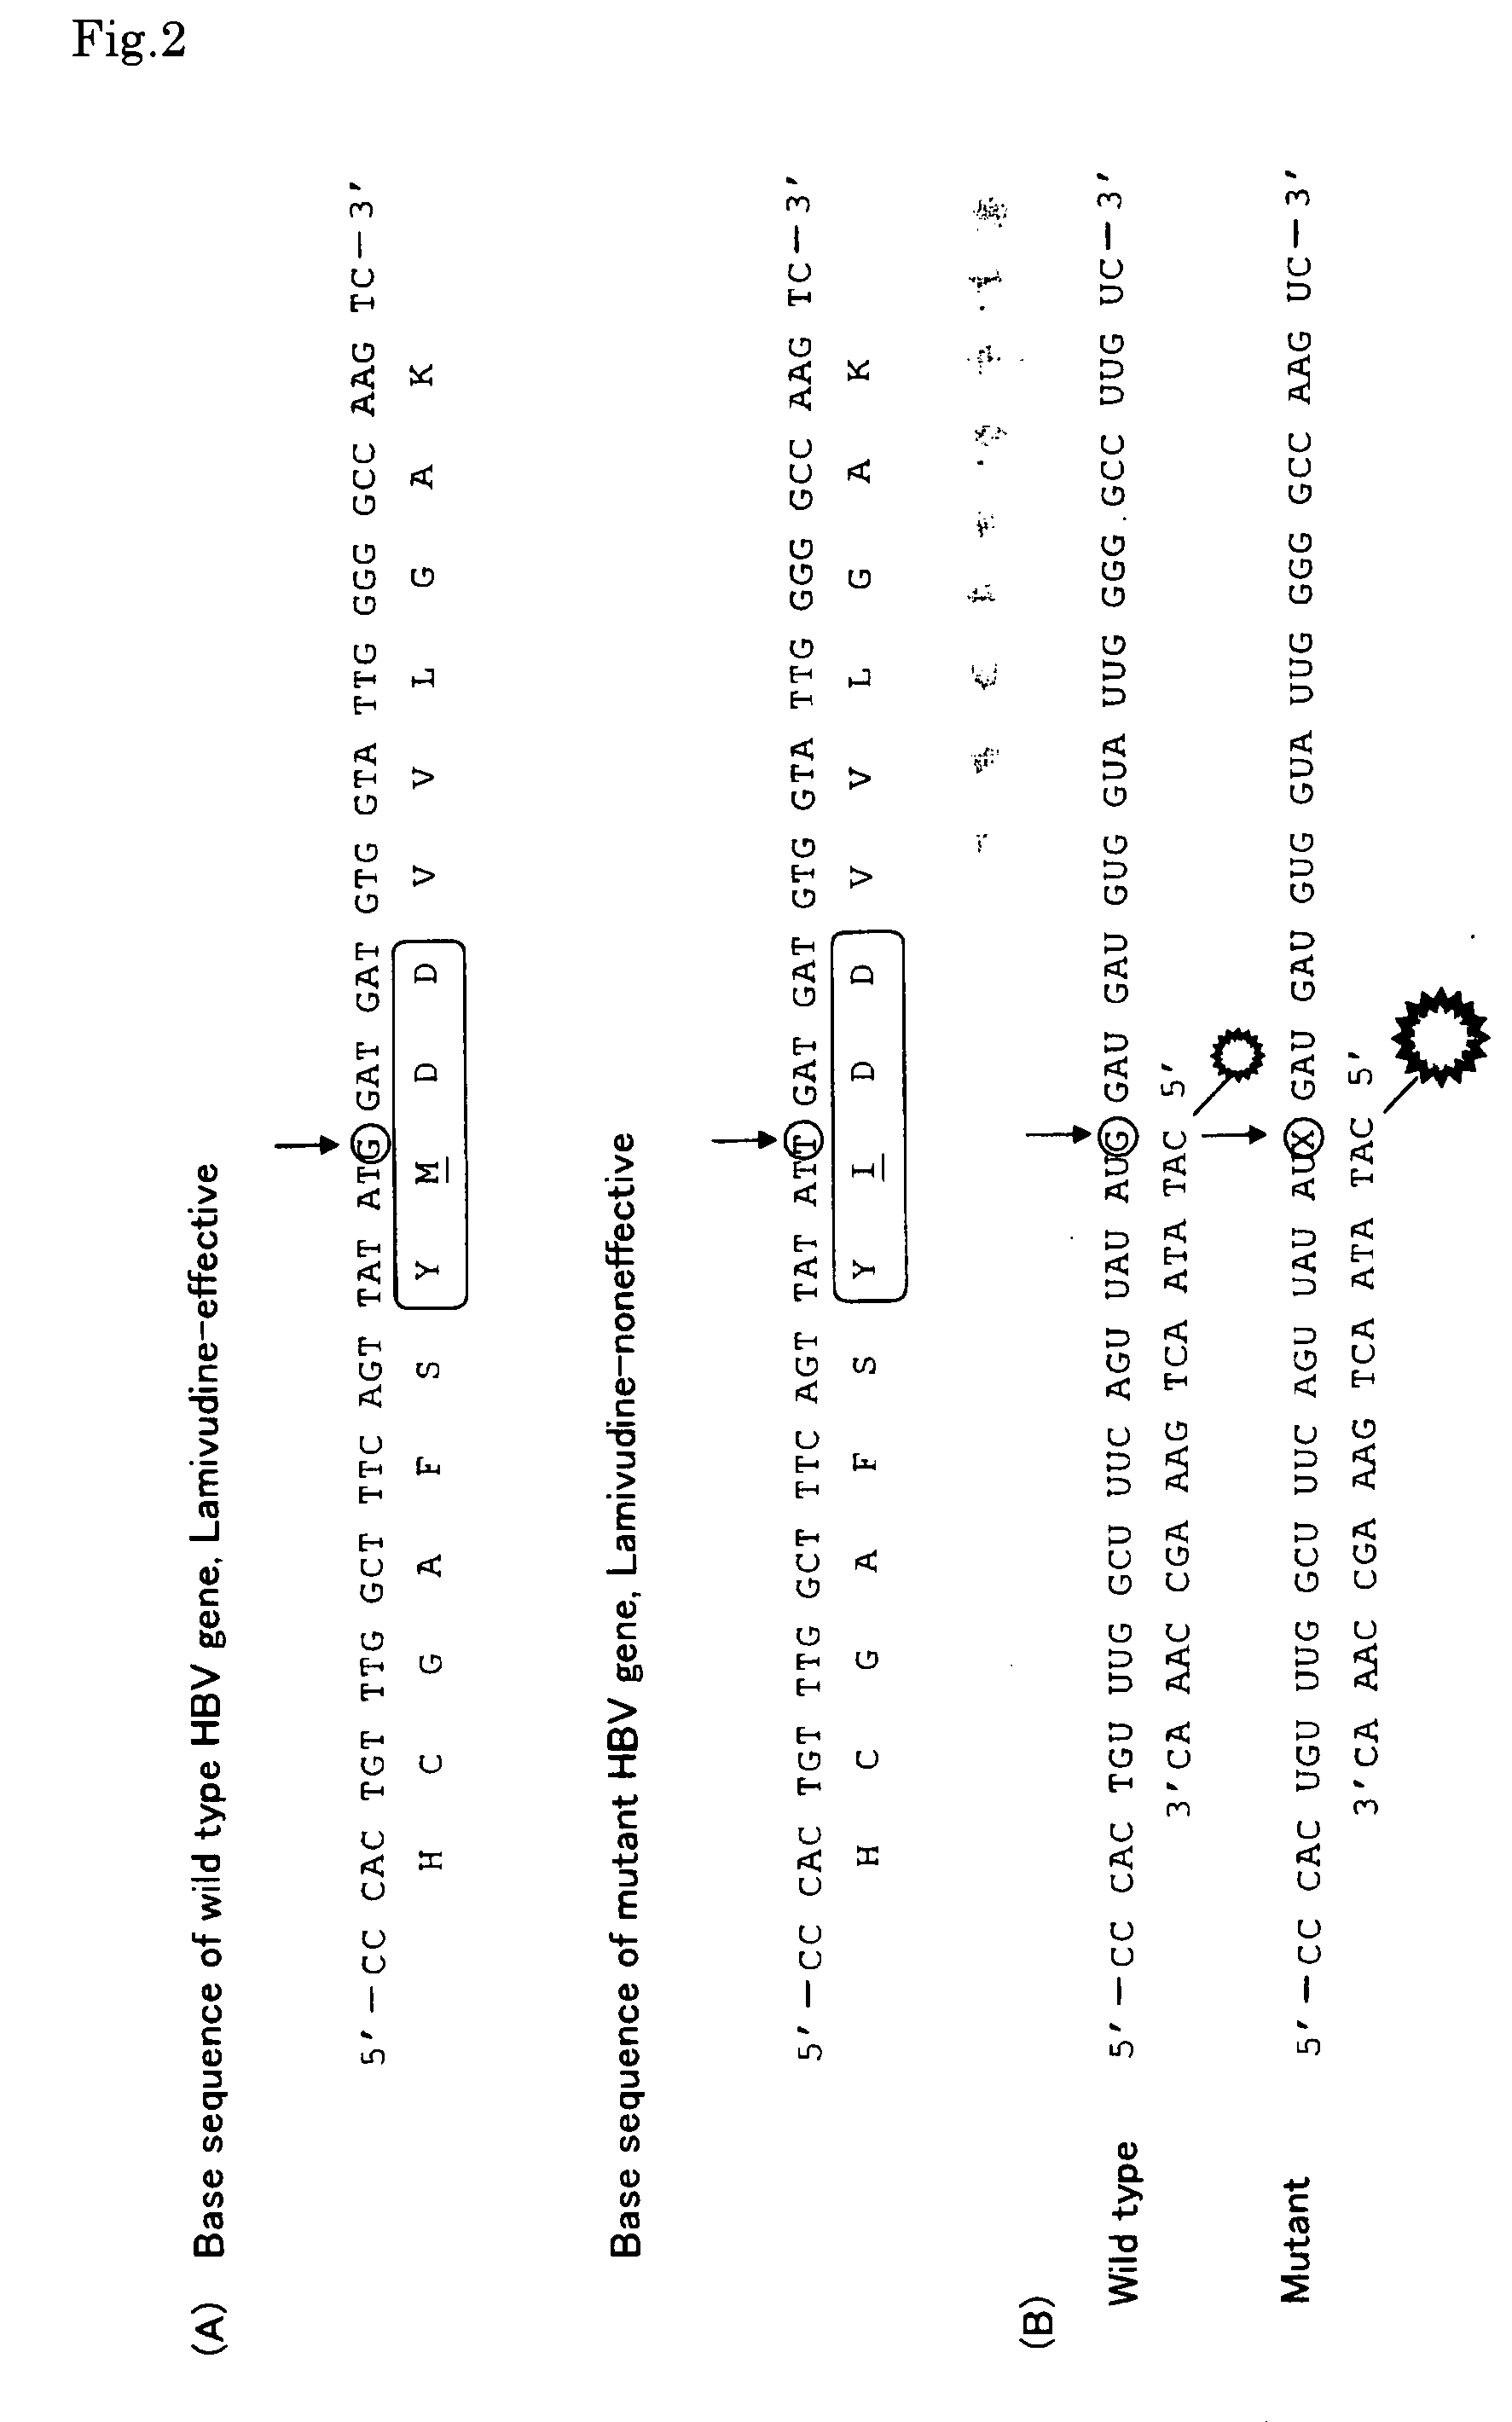
Detection of Gene Mutation Observed in Hepatitis B Virus
1.1 Preparation of DNA (PCR)
[0043]PCR reactions were carried out using plasmid gene containing hepatitis B virus gene (wild-type or control gene) and plasmid gene containing mutant hepatitis B virus gene (target gene) (cf. FIG. 1 (A)) as template, to obtain gene fragments containing the sites to be analyzed (to be detected), wherein each plasmid gene was composed of pUC18 with the SmaI site thereof being linked with the hepatitis B virus gene. As PCR primers there were used primer 1 having T7 RNA polymerase promoter sequence at the 5′-end thereof (SEQ ID NO:5), and primer 2 which is gene specific (SEQ ID NO:6) for DNA polymerase, Pyrobest® (TaKaRa). The reaction conditions are as follows: Composition for PCR (100 μl): template DNA (<1 μg), DNA polymerase Pyrobest® (2.5 unit), primer 1 (1 μm), primer 2 (1 μm), dNTP (200 μm), 1× Pyrobest Buffer II. PCR conditions: One cycle of thermal denaturation at 95° C., 15 sec, followed by thirty-five cycles of thermal denaturation at 95° C., 15 sec, annealing at 55° C., 30 sec, and then elongation reaction at 72° C., 30 sec.
Primer 1: 5′-ATGATCACTAATACGACTCACTATAGGGCTTTCCCCC ACTGTTTGGC-3′ Primer 2: 5′-GGTACCCCAACTTCCAATTACATAT-3′
1.2 Preparation of RNA Samples (In Vitro Transcription)
[0044]The PCR products obtained by the step of 1.1 were subjected to in vitro transcription reactions to prepare single-stranded RNA. The transcription reactions were carried out using T7 RiboMAX™ Express Large Scale RNA Production System (Promega). The RNA products are recovered through ethanol precipitation, followed by redissolution in sterilized water to prepare RNA samples. The reaction conditions were as follows:
Composition for the reaction (20 μL): PCR product (2 μL), Enzyme Mix, T7 Express (2 μl), 1× RiboMAX™ Express T7 buffer.
Reaction conditions: Following the synthesis reaction (at 30° C., 30 min.), each RNA sample was recovered using Dr. GenTLM™ Precipitation Carrier (TaKaRa).
1.3.1 Hybridization and RNA Decomposition
[0045]Each fluorescence-labeled probe used was composed of oligoDNA (5′-CATATAACTGAAAGCCAAAC-3′) being combined with one of various fluorescence dyes as shown in FIG. 2 (B).
[0046]Each fluorescence-labeled probe (40 pmol) was dissolved in 1 mL of hybridization buffer (10 mM Tris-HCl, 10 mM MgCl2, pH7.0) to measure fluorescence intensity. The fluorescence intensity obtained was defined as F0. Then there was added RNA sample (15 μL) to obtain RNA/DNA hybrid. Each hybrid was then treated with ribonuclease A (0.5 μg), followed by the measurement of fluorescence intensity, in which the fluorescence intensity obtained was defined as F1. Fluorescence quenching rate (Qr) was calculated by the formula 1 given below.
[0047]The results are shown in FIG. 3. It was found that, when RNA sample was completely complementary to fluorescence-labeled probe (i.e. in the case of RNA derived from control (wild-type) gene sample/DNA hybrid, in which the base to be detected was G), a high fluorescence quenching rate was produced, whereas, when there was no complementation at the terminal site (i.e. in the case of RNA derived from target (mutant) gene sample/DNA hybrid, in which the base to be detected is other than G), a greatly decreased fluorescence quenching rate was produced. Thus, gene mutation can be detected through the fluorescence intensity measurement before and after the hybridization, followed by the calculation.
1.3.2 Mutation Detection by Simultaneous Use of Fluorescence-Labeled Probe and Fluorescence-Quenching Probe
[0048]As shown in FIG. 6 there were used fluorescence-labeled probe composed of oligoDNA (5′-CCATATAACTGAAAGCCAAA-3′) with fluorescence dye (FITC) being combined with the 5′-end thereof and fluorescence-quenching probe composed of oligoDNA (5′-GGCCCCCAATACCACATCAT-3′) with fluorescence-quenching molecule (BHQ-1) being combined with the 3′-end thereof.
[0049]Fluorescence-labeled probe (20 pmol) and fluorescence-quenching probe (100 pmol) were dissolved in 1 mL of hybridization buffer (10 mM Tris-HCl, 10 mM MgCl2, pH7.0) to measure fluorescence intensity. The fluorescence intensity obtained was defined as F0. Then there was added RNA sample (15 μL) to obtain RNA/DNA hybrid. The hybrid was then treated with ribonuclease A (0.5 μg), followed by the measurement of fluorescence intensity, in which the fluorescence intensity obtained was defined as F1. Fluorescence quenching rate (Qr) was calculated by the formula 1 given below.
[0050]The results are shown in FIG. 7. It was found that, when RNA sample was completely complementary to fluorescence-labeled probe (i.e. in the case of RNA derived from standard (wild-type) gene sample/DNA hybrid, in which the base to be detected was G), a high fluorescence quenching rate was produced, whereas, when there was no complementation at the terminal site (i.e. in the case of RNA derived from target (mutant) gene sample/DNA hybrid, in which the base to be detected was other than G), a greatly decreased fluorescence quenching rate was produced. Thus, gene mutation can be detected through the fluorescence intensity measurement before and after the hybridization, followed by the calculation.
Qr=(F0−F1)/F0×100(%)  Formula 1

Example

EXAMPLE 2
Detection of Gene Mutation Observed in Aldehyde Hydrogenase Gene
1.1 Preparation of DNA (PCR)
[0051]PCR reactions were carried out using plasmid gene containing aldehyde hydrogenase gene (wild-type) and plasmid gene containing aldehyde hydrogenase gene (mutant) (cf. FIG. 4) as template, to obtain gene fragments containing the sites to be detected, wherein each plasmid gene was composed of pUC18 with the SmaI site thereof being linked with aldehyde hydrogenase gene. As PCR primers there were used primer 1 having T7 RNA polymerase promoter sequence at the 5′-end thereof (SEQ ID NO:7), and primer 2 which was gene specific (SEQ ID NO:8) for DNA polymerase, Pyrobest® (TaKaRa). The reaction conditions were as follows: Composition for PCR (100 μl): template DAN (<1 μg), DNA polymerase Pyrobest® (2.5 unit), primer 1 (1 μM), primer 2 (1 μM, dNTP (200 μm), 1× Pyrobest Buffer II.
PCR conditions: One cycle of thermal denaturation at 95° C., 15 sec, followed by thirty-five cycles of thermal denaturation at 95° C., 15 sec, annealing at 55° C., 30 sec, and then elongation reaction at 72° C., 30 sec.
Primer 1: 5′-ATGATCACTAATACGACTACACTATAGGGTCAACTGC TATGATGTG-3′ Primer 2: 5′-CCACACTCACAGTTTTCACTT-3′
2.2 Preparation of RNA Samples (In Vitro Transcription)
[0052]The PCR products obtained by the step of 2.1 were subjected to in vitro transcription reactions to prepare single-stranded RNA. The transcription reactions were carried out using T7 RiboMAX™ Express Large Scale RNA Production System (Promega). The RNA products were recovered through ethanol precipitation, followed by redissolution in sterilized water to prepare RNA samples. The reaction conditions were as follows:
Composition for the reaction (20 μl): PCR product (1 μl), Enzyme Mix, T7 Express (2 μl), 1× RiboMAX™ Express T7 buffer.
Reaction conditions: Following the synthesis reaction (at 30° C., 30 min.), each RNA was recovered using Dr. GenTLM™ Precipitation Carrier (TaKaRa).
2.3. Hybridization and RNA Decomposition
[0053]Fluorescence-labeled probe used was composed of oligoDNA (5′-ACACTCACAGTTTTCACTTC-3′) (SEQ ID NO:9) being combined with fluorescence dye TAMRA at the 3′-end thereof, as shown in FIG. 4.
[0054]The fluorescence-labeled probe (40 μmol) was dissolved in 1 mL of hybridization buffer (10 mM Tris-HCl, 10 mM MgCl2, pH7.0) to measure fluorescence intensity. The fluorescence intensity obtained was defined as F0. Then there was added RNA sample (15 μL) to obtain RNA/DNA hybrid. Each hybrid was then treated with ribonuclease A (0.5 μg), followed by the measurement of fluorescence intensity, in which the fluorescence intensity obtained was defined as F1. Fluorescence quenching rate (Qr) was calculated by the above-mentioned formula.
[0055]The results are shown in FIG. 4. It was found that RNA sample derived only from the wild-type (wild-type homozygote) produced a high fluorescence quenching rate (55%). By contrast, RNA sample only from the mutant (mutant homozygote) produced a greatly decreased fluorescence quenching rate (2%). Heterozygote from the wild-type and the mutant produced a fluorescence quenching rate of 28%. Thus, allele mutation can be detected through the fluorescence intensity measurement before and after the hybridization, followed by the calculation.

Example

EXAMPLE 3
Simultaneous Detection of Gene Mutations Observed in ADRB2 and Hepatitis B Virus
1.1 Preparation of DNA (PCR)
[0056]PCR reactions were carried out using plasmid genes containing human β2-Adrenergic Receptor (ADRB2) (wild-type and mutant) as template, to obtain gene fragments containing the sites to be detected. As PCR primers there were used primer 1 having T7 RNA polymerase promoter sequence at the 5′-end thereof (SEQ ID NO:9), and primer 2 which is gene specific (SEQ ID NO:10) with DNA polymerase, Pyrobest® (TaKaRa). The reaction conditions were as follows:
Composition for PCR (100 μl): template DNA (<1 μg), DNA polymerase Pyrobest® (2.5 unit), primer 1 (1 μM, primer 2 (1 μM, dNTP (200 μM), 1× Pyrobest Buffer II.
PCR conditions: One cycle of thermal denaturation at 95° C., 15 sec, followed by thirty-five cycles of thermal denaturation at 95° C., 15 sec, annealing at 55° C., 30 sec, and then elongation reaction at 72° C., 30 sec.
Primer 1: 5′-ATGATCACTAATACGACTCACTATAGGGCTTTCCCCC ACTGTTTGGC-3′ Primer 2: 5′-GGTACCCCAACTTCCAATTACATAT-3′
3.2 Preparation of RNA Samples (In Vitro Transcription)
[0057]The PCR products obtained by the step of 3.1 were subjected to in vitro transcription reactions to prepare single-stranded RNA. The transcription reactions were carried out using T7 RiboMAX™ Express Large Scale RNA Production System (Promega). The RNA products were recovered through ethanol precipitation, followed by redissolution in sterilized water to prepare RNA samples. The reaction conditions were as follows:
Composition for the reaction (20 μl): PCR product (each 2 μL), Enzyme Mix, T7 Express (2 μl), 1× RiboMAX™ Express T7 buffer.
Reaction conditions: Following the synthesis reaction (at 30° C., 30 min.), each RNA sample was recovered using Dr. GenTLM™ Precipitation Carrier (TaKaRa).
3.3. Hybridization and RNA Decomposition
[0058]There were used fluorescence-labeled probe composed of oligoDNA (5′-CCATATAACTGAAAGCCAAAC-3′) (SEQ ID NO:11) with fluorescence dye FITC being combined to the 5′-end thereof, for HBV, and fluorescence-labeled probe composed of oligoDNA (5′-ACCCACACCTCGTCCCTTTC-3′) (SEQ ID NO:12) with fluorescence dye TAMRA being combined with the 3′-end thereof, for ADRB2.
[0059]Each fluorescence-labeled probe (40 pmol) was dissolved in 1 mL of hybridization buffer (10 mM Tris-HCl, 10 mM MgCl2, pH7.0) to measure fluorescence intensities from FITC and TAMRA. Each fluorescence intensity obtained was defined as F0. Then there was added RNA sample (15 μL) to obtain RNA/DNA hybrid. Each hybrid was then treated with ribonuclease A (0.5 μg), followed by the measurement of fluorescence intensity, in which the fluorescence intensity obtained was defined as F1. Fluorescence quenching rate (Qr) was calculated by the above-mentioned following formula. The results are shown in FIG. 3. The Qr values correspond to the respective degrees of complementarity in the hybrids, resulting in simultaneous detection of different types of plural SNPs. The results suggest that the present invention enables simultaneous detection of a plurality of SNPs present in different gene strands or in the same gene strand.

PUM

PropertyMeasurementUnit
Fluorescence
tensileMPa
Particle sizePa
strength10

Description & Claims & Application Information

We can also present the details of the Description, Claims and Application information to help users get a comprehensive understanding of the technical details of the patent, such as background art, summary of invention, brief description of drawings, description of embodiments, and other original content. On the other hand, users can also determine the specific scope of protection of the technology through the list of claims; as well as understand the changes in the life cycle of the technology with the presentation of the patent timeline. Login to view more.

Similar technology patents

Classification and recommendation of technical efficacy words

  • Low reliability
  • Shorten time

Object oriented microfluidic design method and system

ActiveUS6885982B2Shorten timeEasy placement and routingGeometric CADValve arrangementsMicrofluidic chipSymbolic objects
Owner:STANDARD BIOTOOLS INC
Why Eureka
Try Eureka