Methods And Systems For Analyzing Biological Samples

a biological sample and method technology, applied in the field of methods and systems for analyzing biological samples, can solve the problems of impracticality for both research and clinical applications, large scanning time gap, and complicated overall analysis process, and achieve the effect of improving the analysis of labeled biological samples

Active Publication Date: 2009-02-19
APPLIED SPECTRAL IMAGING
View PDF13 Cites 39 Cited by
  • Summary
  • Abstract
  • Description
  • Claims
  • Application Information

AI Technical Summary

Benefits of technology

[0063]The present invention successfully addresses the shortcomings of the presently known configurations by providing methods and systems for improved analysis of labeled biological samples.

Problems solved by technology

However, since manual identification of ROIs is a time- and labor-consuming effort, which complicates the overall analysis process, systems for automatically scanning and analyzing biological samples have been developed.
However, if the cells to be scanned are not evenly distributed on the slide, scanning may begin with an area that is completely irrelevant for analysis, thus resulting in a considerable waist of scanning time until reaching the areas containing cells.
In addition, in many cases, the cells of interest (e.g., cancerous cells), which are part of a tissue sample, are not positioned in the center of the specimen, thus leading to either mis-diagnosis due to under-scanned areas or to enormously long scanning times which are impractical for both research and clinical applications.
To date, there is no available method which can efficiently select ROIs in a reliable and time-consuming manner.
One of the main problems associated with the currently available automated image analysis techniques is the presence of split, merged or overlapping spots resulting from either technical reasons or associated with the presence of translocations and / or sub-deletions which are difficult to interpret.
Moreover, the hybridization conditions may be sub-optimal, thus resulting in non-specific binding of probe and extra background stain which may lead to false analysis of the image.
Thus, if the imaging system includes only a color camera, it can result in poor quality and signal to noise measurements of the weak fluorescent staining.
On the other hand, if the imaging system includes a monochrome camera, measurements of the bright signals, which are often performed using a bright field mode, but sometimes also using a fluorescent mode, are time-consuming and complicated.

Method used


Image

  • Methods And Systems For Analyzing Biological Samples
  • Methods And Systems For Analyzing Biological Samples
  • Methods And Systems For Analyzing Biological Samples

Examples


example 1

User-Defined Ratio Between Spot Intensities Enables Accurate Analysis of Merged Spots

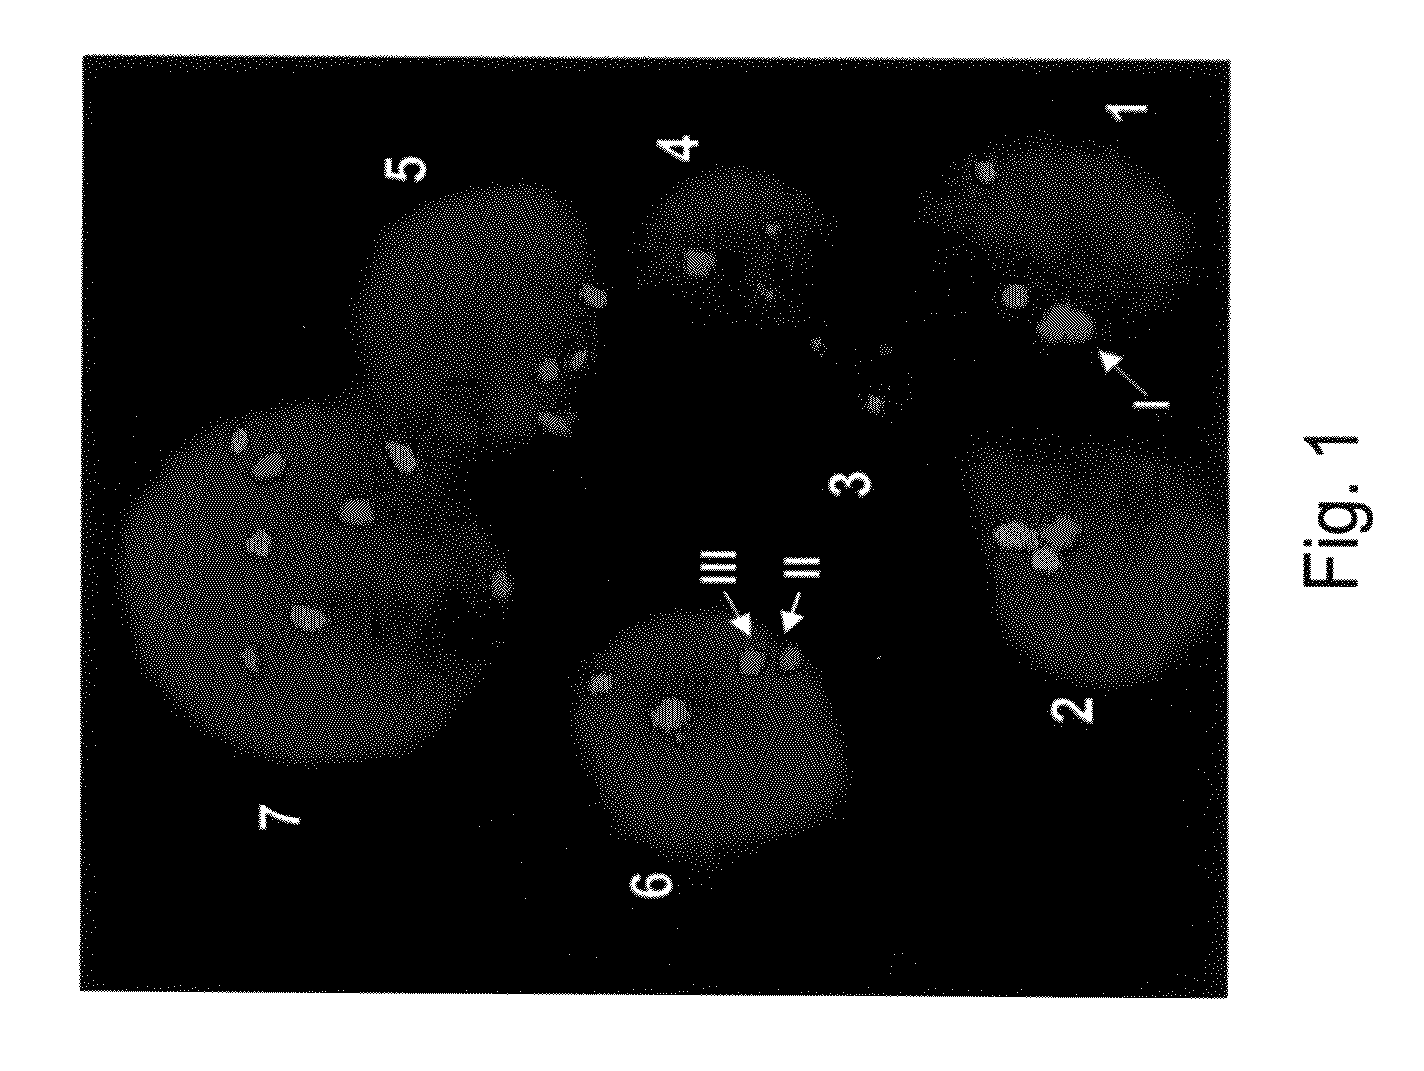
[0170]FISH analysis may often result in merged signals (i.e., two spots which form one big spot) which can be subjected to false interpretation by the currently available automatic image analysis methods. An example is provided in FIG. 1. FIG. 1 shows a region of interest (ROI) of a FISH experiment using probes derived from the centromere of chromosome 10 (Red) and the centromere of chromosome 4 (Green). DAPI was used as a counterstaining (blue) to allocate the area of the nuclei. In a normal cell the two FISH probes result in two red and two green spots (see for example, cell No. 5 of FIG. 1). In an abnormal cell such as cell No. 7 of FIG. 1, there are three copies of chromosome 4 and three copies of chromosome 10. However, in some cells the observed FISH signals are more complicated. For example, as is shown in cell No. 1 of FIG. 1, the two red spots representing two copies of chromosome 10 are me...

example 2

User-Defined Ratio Between Spot Intensities Enables Accurate Analysis of Translocations and / or Sub-Deletions

[0174]The detection of translocations and sub-deletions can be performed using various kits employing probes that span the breakpoint region thus resulting in split signals. For example, the BCR / ABL translocation of chromosomes 9:22 can be detected by the split-signal kit available from DakoCytomation (Glostrup, Denmark) and as described in van Zutven LJCM et al., 2004, Two dual-color split signal fluorescence in situ hybridization assays to detect t(5;14) involving HOX11L2 or CSX in T-cell acute lymphoblastic leukemia, Hematologica 89 p. 671-678. Another example is the TEL / AML1 (also known as ETV6 / RUNX1) rearrangement, which is frequently found in childhood B-acute lymphoblastic leukemia (b-ALL). This fusion gene is caused by translocation of the TEL gene on chromosome 12p13 to the AML1 gene on chromosome 21q22 (Golub, T. R., et al., Proc. Natl. Acad. Sci. U.S.A. 92: 4917-492...

example 3

Automatic Selection of Region of Interest

[0182]When scanning a slide automatically, the area that is being scanned on the slide is usually much larger than the region-of-interest (ROI) that can be captured by the imaging system (due to the magnification of the optics). As an example, if the relevant area on the slide is 1 cm×1 cm, and the area of the CCD camera is 5 mm×5 mm (such area is in a typical range), and if a magnification of 20× is used in the microscope, it means that 1600 images have to be captured in order to cover the whole slide. This can take a long time, especially in fluorescence imaging where the signal is not so bright and exposure times in the range of seconds have to be used. For example, assuming an exposure time of 1 second is used, and the image have to be acquired through 2 different filters, and there is another 1 second extra time per frame for focusing and motion purposes, it will take 80 minutes to scan the slide. In many cases the time can be significan...


PUM

PropertyMeasurementUnit
exposure timeaaaaaaaaaa
frequencyaaaaaaaaaa
areaaaaaaaaaaa

Abstract

Methods, computer readable storage media and systems which can be used for analyzing labeled biological samples, identifying chromosomal aberrations, identifying genetically abnormal cells and/or computationally scanning the samples using randomly or randomized scanning methods are provided. Specifically, the present invention can be used to analyze FISH-stained samples and automatically identify chromosomal aberrations associated with abnormal intensity ratio of stained occurrences in the sample.

Description

FIELD AND BACKGROUND OF THE INVENTION[0001]The present invention relates to methods, computer readable storage media and systems for analyzing labeled biological samples such as fluorescence in situ hybridization (FISH)— stained samples, such as for identifying chromosomal aberrations, for identifying genetically abnormal cells and for computational scanning of samples.[0002]Various pathologies such as infections, inflammation, cancer and / or genetic diseases are currently diagnosed by analyzing microscopic slides containing biological specimens such as blood samples, urine sample, tissue biopsies, spinal fluid aspirates, amniotic fluid, chorionic villi sample (CVS) and the like. Since most of the biological samples are transparent, the first step of analysis requires staining with a specific dye or probe which enables the detection of almost any tissue or cellular specimen constituent. Such constituents may be, for example, a connective tissue, a cell organelle (e.g. mitochondria), ...

Claims


Application Information

Patent Timeline
Patent Type & Authority Applications(United States)
IPC IPC(8): G06F19/00G01N33/48
CPCG06K9/00134C12Q1/6841G06V20/693
Inventor KATZIR, NIRKOLATT, TSAFRIRBAR-AM, IRIT
Owner APPLIED SPECTRAL IMAGING
Why Eureka
Try Eureka