Frozen confections
- Summary
- Abstract
- Description
- Claims
- Application Information
AI Technical Summary
Benefits of technology
Problems solved by technology
Method used
Image
Examples
example 1
Buffer Preparation
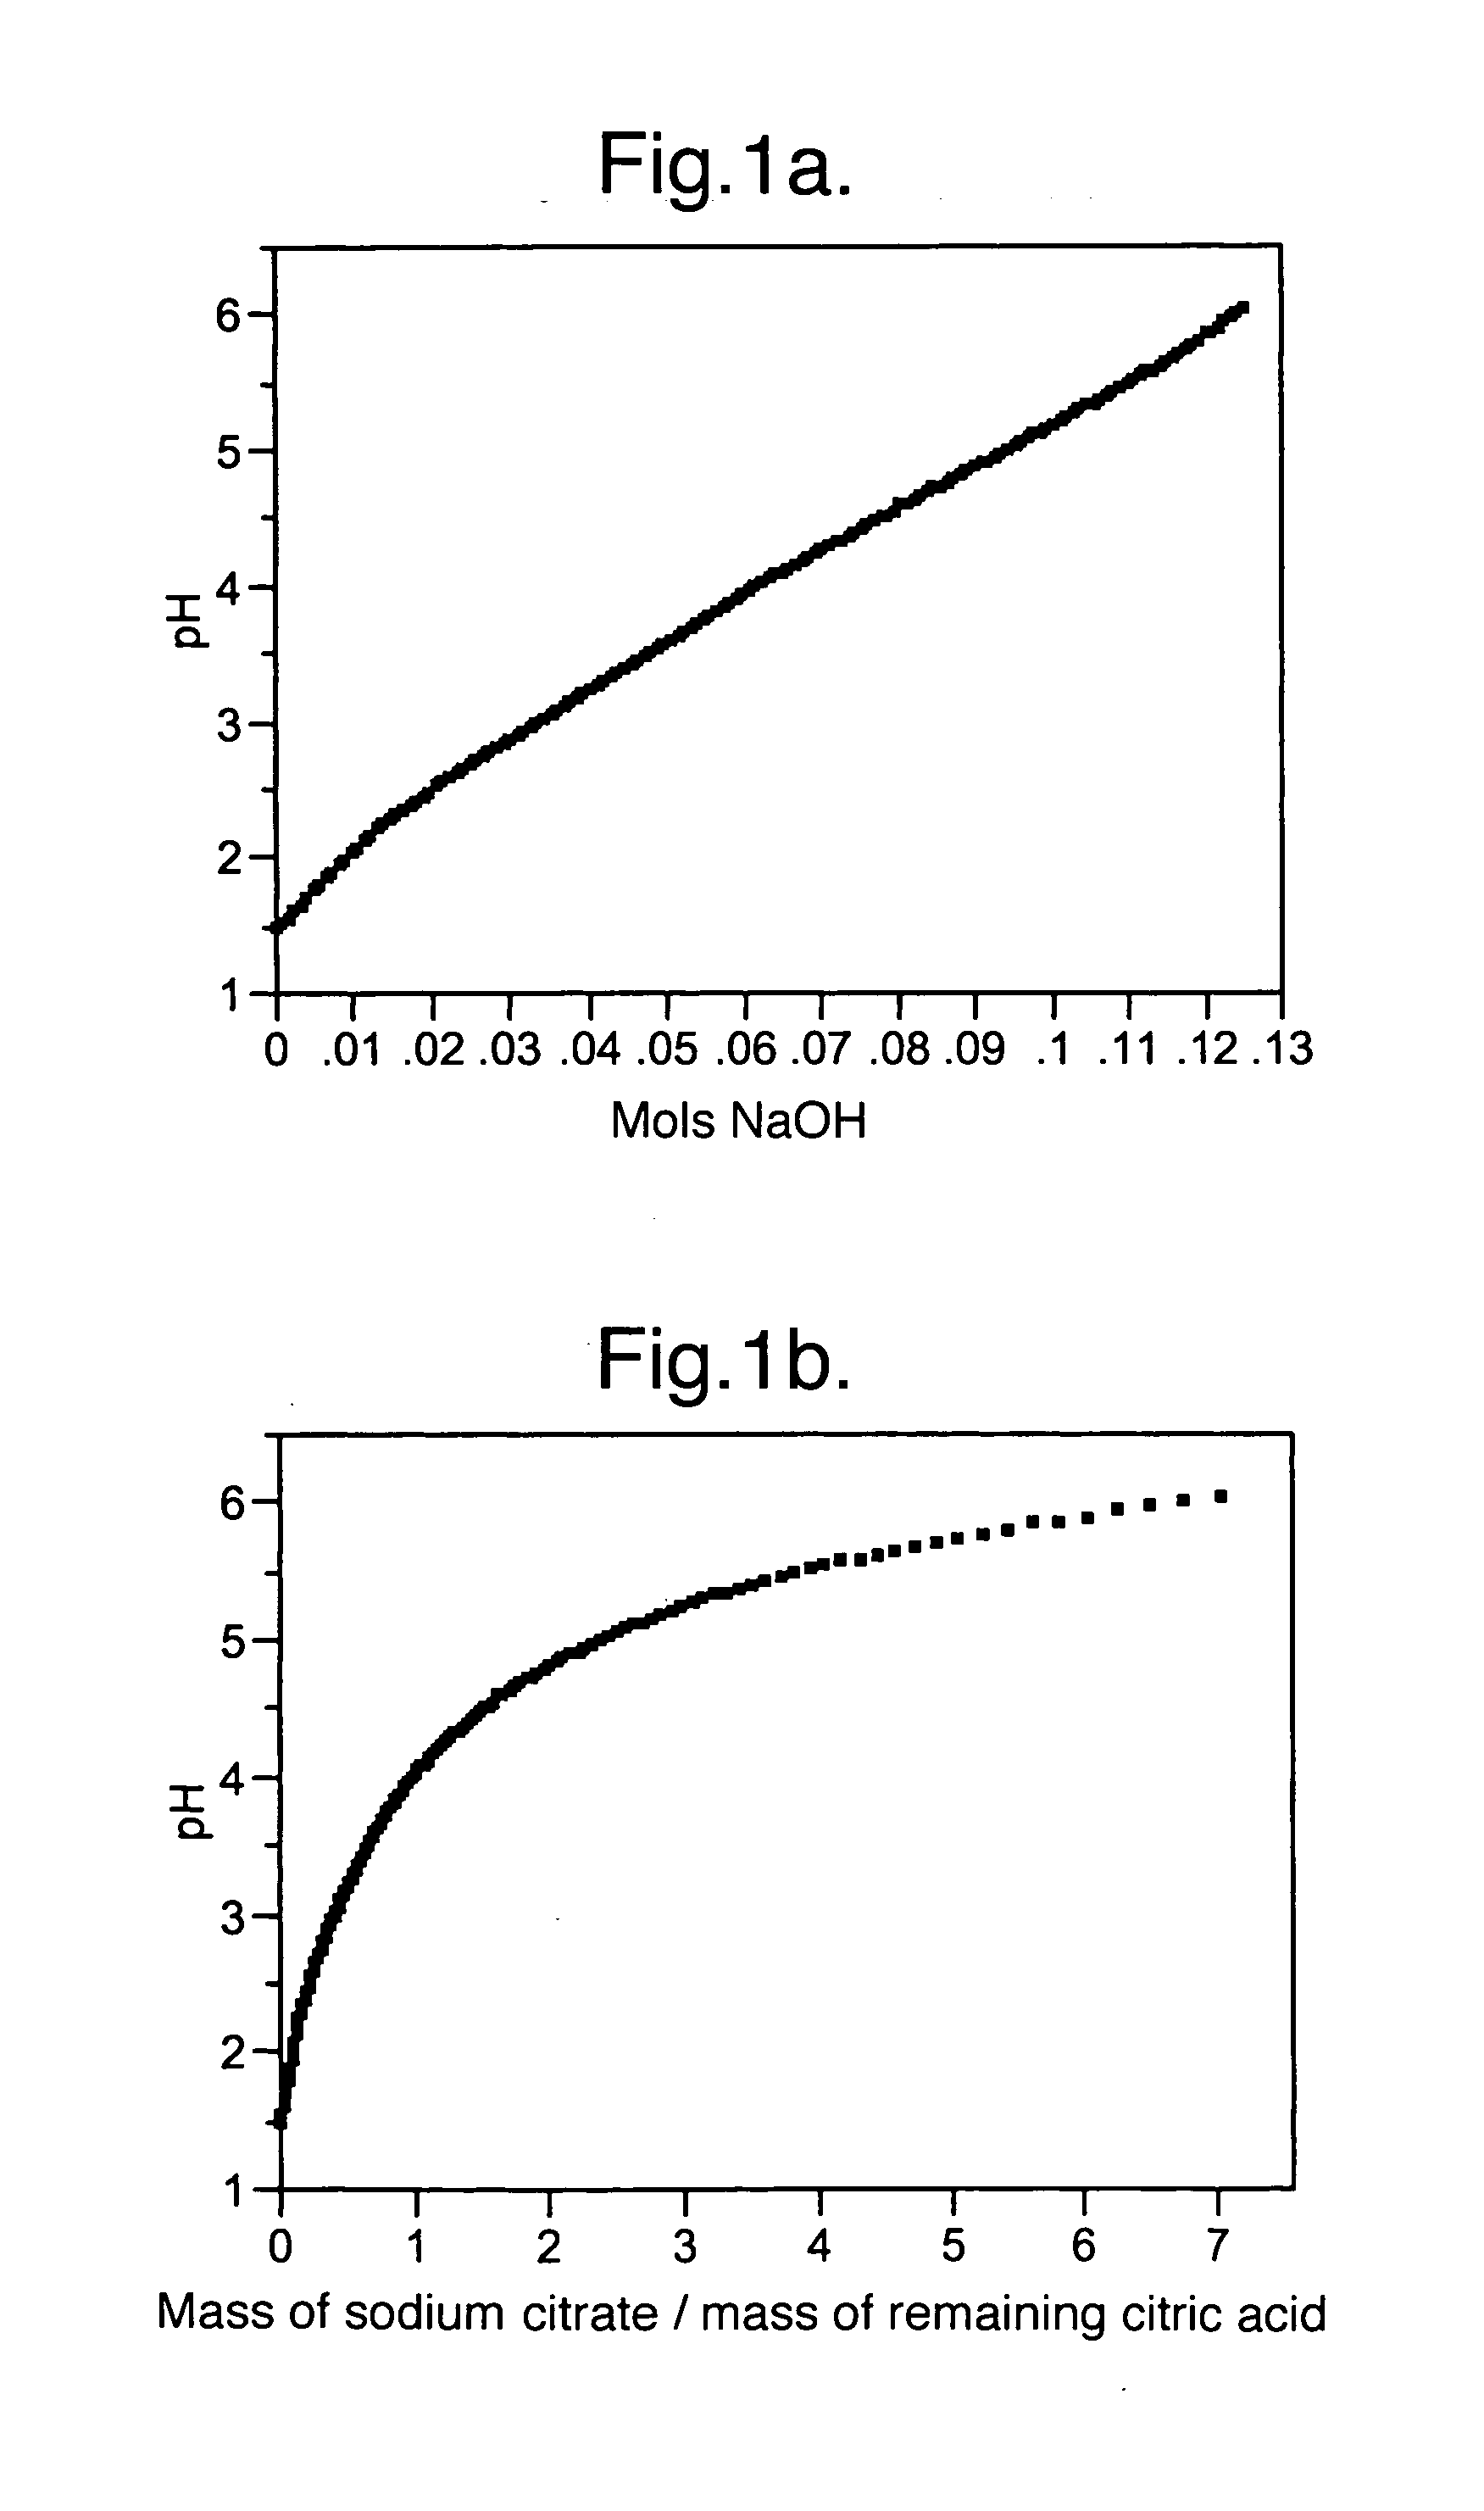
[0041]Example 1 demonstrates how to prepare a buffer with a desired pH. First, a 0.5 molar solution of citric acid was titrated using 1 molar sodium hydroxide solution at 18° C. The resulting titration curve is shown in FIG. 1(a). As sodium hydroxide is added, some of the citric acid is neutralized to sodium citrate and the pH of the solution rises. The pH at any point along the titration curve is determined by the ratio of citric acid to citrate. At the concentrations typically used in food products, e.g. less than about 10 wt %, the pH essentially depends only on the ratio and is approximately independent of the concentration (pH is affected by ionic strength at higher buffer concentrations).
[0042]The amounts of citric acid and sodium citrate at any point on the curve can be calculated from the sodium hydroxide concentration and the initial citric acid concentration. The pH curve may then be expressed as a ratio of the concentrations of sodium citrate to citric a...
example 2
Effect of pH and Temperature on Fructo-Oligosacharides
[0043]Example 2 demonstrates the effect of the pH on the hydrolysis of fructo-oligosaccharides during pasteurization. Model mixes consisting of 100 g / L aqueous solutions of oligofructose (Raftilose™) and inulin (Raftiline™) were prepared. A number of aliquots were taken from each mix, and their pHs were adjusted to values ranging from 3.0 to 5.9 using a citric acid / sodium citrate buffer, as described in example 1. Samples were also prepared at pH 2.7, using 0.25% citric acid, and pH 7.0 (i.e. no buffer added). The samples were heated to 70° C. for 20 minutes to simulate a normal mix process, rapidly heated to 83° C. to simulate pasteurization and then rapidly cooled by quenching into ice. The concentration of fructose in each sample was measured using HPLC. In each case an unheated control sample was also measured. The resulting amounts of fructose (g / L) are shown in Table 2.
TABLE 2Oligofructose (g / L)Inulin (g / L)pHunheatedheatedu...
example 3
Water Ices
[0046]Example 3 demonstrates water ices according to the invention, prepared to the formulation shown in Table 3. Three sodium citrate concentrations were used: 0.914, 1.64 and 2.75 wt %, resulting in mixes with expected pHs of 4.5, 5.0 and 5.5 respectively. A comparative example was made using the same formulation but without using a buffer salt (i.e. no sodium citrate). In order to raise the pH to above the level at which hydrolysis occurs, the citric acid monohydrate was also not included, and the citric acid present in the lemon juice was neutralized using 1 molar sodium hydroxide (to pH 5.1).
TABLE 3Ingredient (wt %)Example 3A / 3B / 3CComparative exampleOligofructose77Fructose55Sucrose55Dextrose monohydrate4.94.9Sodium Citrate0.914 / 1.64 / 2.750Citric acid monohydrate0.40Lemon juice concentrate0.70.7Lemon / lime flavour0.30.3Curcumin0.030.03Locust bean gum0.20.2Sodium hydroxide (1 M)0To pH 5.1WaterTo 100To 100
[0047]Water ice products in the form of ice lollies (approximately 1...
PUM
 Abstract
Description
Claims
Application Information
 - R&D
- Intellectual Property
- Life Sciences
- Materials
- Tech Scout
- Unparalleled Data Quality
- Higher Quality Content
- 60% Fewer Hallucinations
Browse by: Latest US Patents, China's latest patents, Technical Efficacy Thesaurus, Application Domain, Technology Topic, Popular Technical Reports.
© 2025 PatSnap. All rights reserved.Legal|Privacy policy|Modern Slavery Act Transparency Statement|Sitemap|About US| Contact US: help@patsnap.com


