Method for discriminating between benign and malignant prostate tumors

a prostate cancer and tumor technology, applied in the field of cancer diagnosis and tumor discrimination, can solve the problems of difficult diagnosis, difficult diagnosis, and difficult diagnosis, and achieve the effects of reducing the risk of cancer, and improving the accuracy of diagnosis and treatmen

Inactive Publication Date: 2010-07-08
KING SAUD UNIVERSITY
View PDF4 Cites 18 Cited by
  • Summary
  • Abstract
  • Description
  • Claims
  • Application Information

AI Technical Summary

Benefits of technology

[0014]These and other features of the present invention will become readily apparent upon further review of the following specification and drawings.

Problems solved by technology

Cancer is often a fatal disease.
Others, such as biopsy, endoscopy, bone marrow, and cytoscopy, are invasive tests that often result in considerable discomfort to the patient.
Still others, such as CAT scans and MRI scans, are quite expensive and require complex instrumentation.

Method used


Image

  • Method for discriminating between benign and malignant prostate tumors
  • Method for discriminating between benign and malignant prostate tumors
  • Method for discriminating between benign and malignant prostate tumors

Examples


example 1

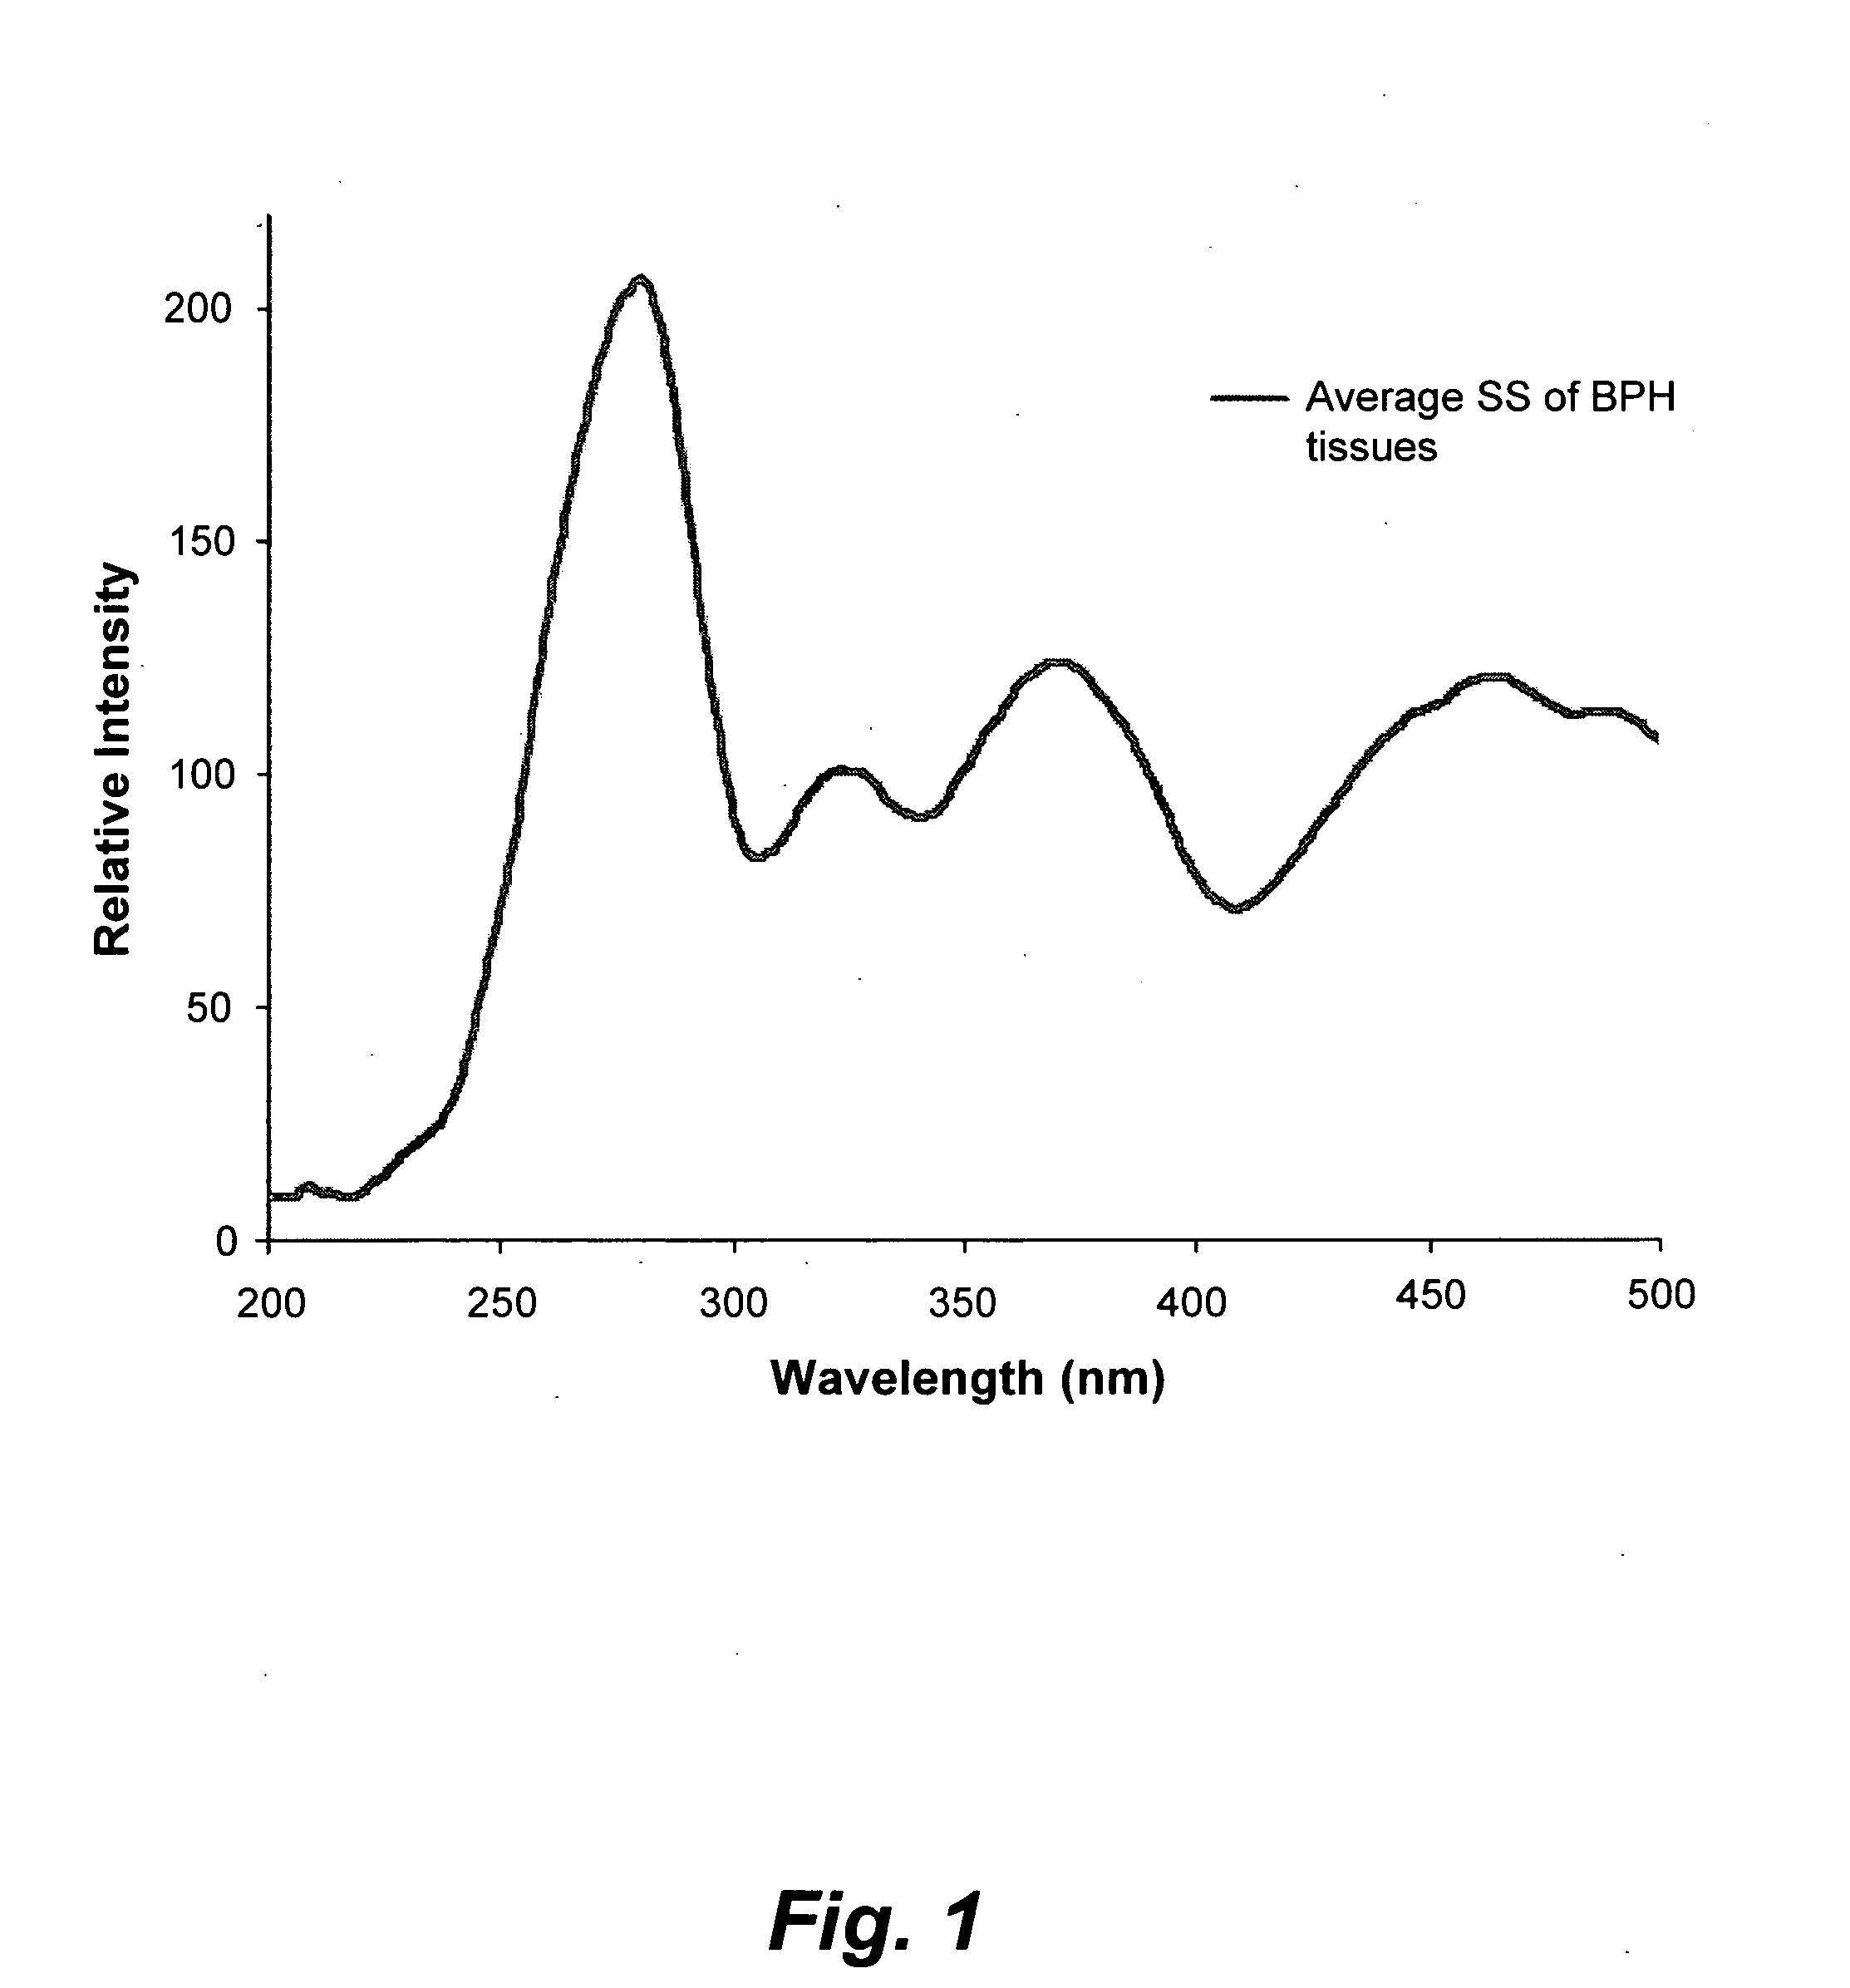
[0034]Excised prostate chips were obtained by transurethral surgery from twelve patients. The excised chips roughly measured 10 mm×2 mm×2 mm, and were kept immersed in saline solution. The excised chips were stored in a refrigerator and then carried through spectral analysis within 8 hours of excision. From each patient, a parallel set of samples was taken for conventional histopathology. The following spectral diagnoses are each compared to conventional histopathology diagnoses. Prior to spectral analysis, each sample was washed five times in saline solution, dried on blotting paper, minced and then loaded into a quartz cuvette, which had a 1 mm wide narrow space to hold the solid sample in fixed position. Light from a xenon lamp, of pre-selected wavelength with a size of 2 mm×2 mm, illuminated the tissue samples, thus exciting auto-fluorescence (the auto-fluorescence-based light was detected transverse to the incident light).

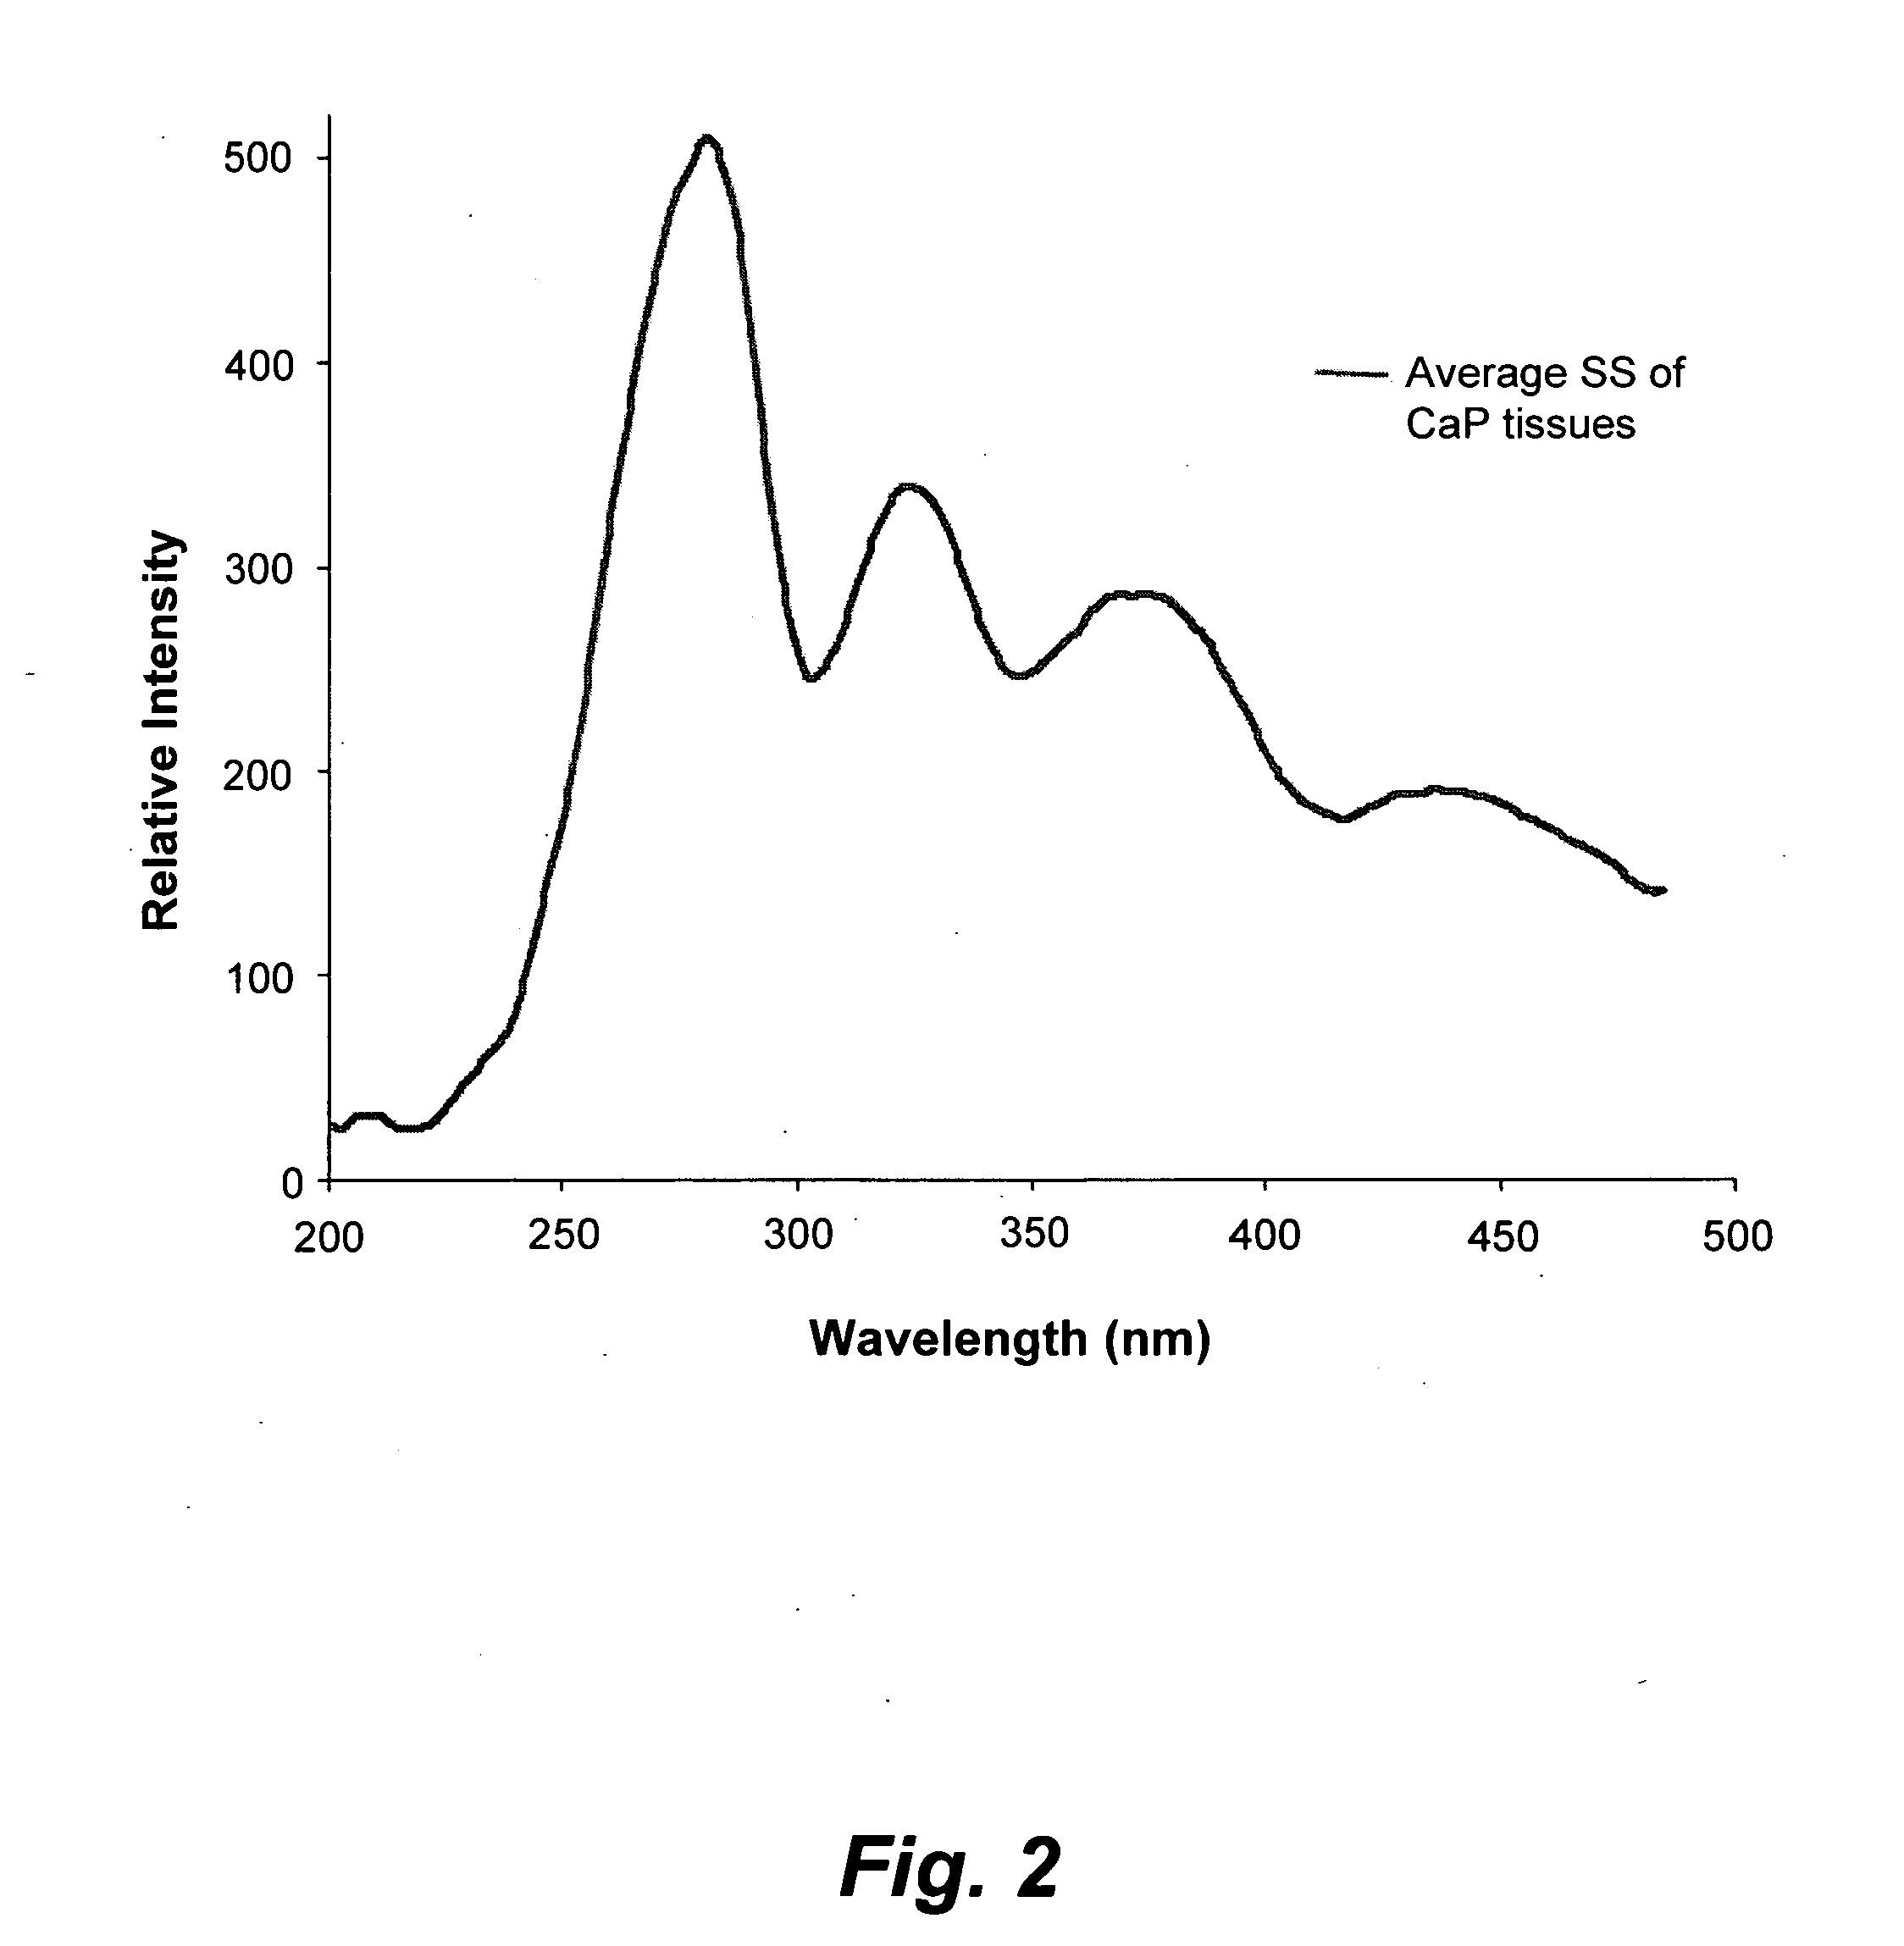
[0035]FIG. 1 illustrates the average synchronous spectra...

example 2

[0041]A disposable syringe was used to uptake 5 ml of venous blood from a subject. The blood was placed in a sterile vial containing ethylenediaminetetraacetic acid (EDTA) anticoagulant. The blood was then centrifuged at 4,000 rpm for 15 minutes, and the supernatant plasma was separated out and collected in a sterile vial. The formed elements, containing mostly cells, such as erythrocytes, were then treated with acetone in a ratio of 1:2 (i.e., 1 ml of formed elements to every 2 ml of acetone). The sample was vigorously shaken 100 times and then centrifuged again at 4,000 rpm for 15 minutes.

[0042]The supernatant obtained was a clear solution containing the bio-molecules used as tumor markers. These were subjected to the spectral analysis described before. The wavelength of excitation was fixed at 400 nm by adjusting the interference filter or grating, and the fluorescence emission spectrum was obtained in a range of 425 to 720 nm.

[0043]A typical result from this analysis is shown in...

example 3

[0047]Urine samples were prepared for analysis in this example. The subject was required to provide the first voided urine in a sterile vial after 48 hours of strict abstinence from non-essential medicines (including herbal and ayurvedic treatments), spicy meals and meats. 2 ml of urine was dropped in a quartz cuvette. The excitation wavelength was set at 400 nm, and the fluorescence spectrum from 425 to 700 nm was obtained. Exemplary spectra for a BPH patient and a prostate cancer patient are shown in FIG. 9. The 470 nm, 520 nm and 620 nm bands are of interest in this analysis, corresponding, respectively, to intensity maxima for NADH, flavins and porphyrin. A set of cancer-defining ratio parameters are given below in Table 2:

TABLE 2Ratio Parameters R3 and R4Ratio parameterBPHLow Grade CaPHigh Grade CaPR6 = I520 / I4700.8-1  R7 = I620 / I470≦0.2 0.2-0.3>0.3


PUM

PropertyMeasurementUnit
excitation wavelengthaaaaaaaaaa
sizeaaaaaaaaaa
wavelengthaaaaaaaaaa

Abstract

The method for discriminating between benign and malignant prostate tumors relates to analyzing samples of blood, urine and tissue by fluorescence spectroscopy in order to detect the presence of naturally occurring molecules in the fluids and tissue that serve as biomarkers indicative of cancer in the human body. The analysis can be carried out based on fluorescence emission spectra, fluorescence excitation spectra and synchronous (emission and excitation) spectra of bio-samples. The detection, diagnosis, and follow-up and also discrimination between malignant and benign prostate tumors may be made by comparison of ratios of fluorescence emissions and/or excitation intensities of tryptophan, tyrosine, elastin, collagen, bile pigments, NADH, flavins and various species of porphyrins.

Description

CROSS-REFERENCE TO RELATED APPLICATIONS[0001]This application is a continuation-in-part of U.S. patent application Ser. No. 12 / 591,749, filed Nov. 30, 2009, which is a continuation-in-part of U.S. patent application Ser. No. 12 / 458,489, filed Jul. 14, 2009, which claims priority to U.S. provisional patent application Ser. No. 61 / 129,728, filed Jul. 15, 2008. This application is also a continuation-in-part of U.S. patent application Ser. No. 12 / 285,670, filed Oct. 10, 2008, which is a continuation-in-part of U.S. patent application Ser. No. 12 / 000,233, filed Dec. 11, 2007, now abandoned, which is a continuation-in-part of U.S. patent application Ser. No. 11 / 017,913, filed Dec. 22, 2004, now abandoned, which claims priority to U.S. provisional patent application 60 / 531,987, filed Dec. 24, 2003. This application also claims priority to India patent application number 587 / CHE / 2003, filed Jul. 22, 2003 and issued as India patent number 209084 on Aug. 20, 2007.BACKGROUND OF THE INVENTION[...

Claims


Application Information

Patent Timeline
Patent Type & Authority Applications(United States)
IPC IPC(8): C12Q1/02
CPCG01N33/57434G01N21/6486
Inventor MASILAMANI, VADIVELRABAH, DANNY M.ALSALHI, MOHAMAD SALEH
Owner KING SAUD UNIVERSITY
Why Eureka
Try Eureka